OTN Export Bulletin no7 - Antigua & Barbuda
•
0 likes•1,177 views


Recommended
Recommended
More Related Content
Similar to OTN Export Bulletin no7 - Antigua & Barbuda
Similar to OTN Export Bulletin no7 - Antigua & Barbuda (20)
More from Office of Trade Negotiations (OTN), CARICOM Secretariat
More from Office of Trade Negotiations (OTN), CARICOM Secretariat (20)
OTN Export Bulletin no7 - Antigua & Barbuda
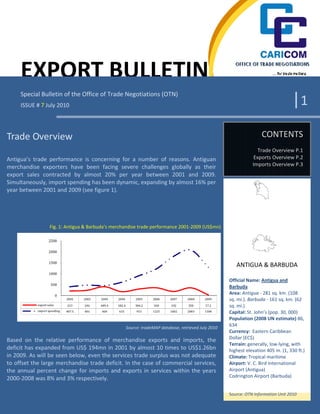
- 1. EXPORT BULLETIN Special Bulletin of the Office of Trade Negotiations (OTN) ISSUE # 7 July 2010 |1 Trade Overview CONTENTS Trade Overview P.1 Antigua’s trade performance is concerning for a number of reasons. Antiguan Exports Overview P.2 merchandise exporters have been facing severe challenges globally as their Imports Overview P.3 export sales contracted by almost 20% per year between 2001 and 2009. Simultaneously, import spending has been dynamic, expanding by almost 16% per year between 2001 and 2009 (see figure 1). Fig. 1: Antigua & Barbuda’s merchandise trade performance 2001‐2009 (US$mn) ANTIGUA & BARBUDA Official Name: Antigua and Barbuda Area: Antigua ‐ 281 sq. km. (108 sq. mi.). Barbuda ‐ 161 sq. km. (62 sq. mi.) Capital: St. John’s (pop. 30, 000) Population (2008 UN estimate) 86, Source: tradeMAP database, retrieved July 2010 634 Currency: Eastern Caribbean Based on the relative performance of merchandise exports and imports, the Dollar (EC$) Terrain: generally, low‐lying, with deficit has expanded from US$ 194mn in 2001 by almost 10 times to US$1.26bn highest elevation 405 m. (1, 330 ft.) in 2009. As will be seen below, even the services trade surplus was not adequate Climate: Tropical maritime to offset the large merchandise trade deficit. In the case of commercial services, Airport: V. C. Bird International the annual percent change for imports and exports in services within the years Airport (Antigua) 2000‐2008 was 8% and 3% respectively. Codrington Airport (Barbuda) Source: OTN Information Unit 2010
- 2. |2 This hyper expansion in the trade deficit has implications for Antigua and Barbuda’s international and domestic debt as within a fixed exchange rate system exporters have to improve their productivity to expand profits (as exchange rate devaluations are not possible). If exporters’ productivity declines severely, the stability of the exchange rate regimes becomes compromised. Export Overview The top ten (10) products exported by Antigua and Barbuda in 2008 are: • cargo vessels not specified elsewhere and other vessels for the transport of both persons and goods (US$ 130.5 mn); • aviation spirit (US$ 25 mn); • machinery for working rubber or plastics or for the manufacture of products from these materials, not specified or included elsewhere (US$ 22.6mn); • motorboats, other than outboard motor boats (US$ 22.1mn); • cold rolled iron or steel, coils >600mm x 0.5‐1mm (US$16.9mn); • Soya‐bean crude oil, whether or not degummed (US$ 13.6mn); • maize (corn) hulled, pearled, sliced or kibbled (US$ 6.7mn); • instruments and apparatus for measuring or detecting ionising radiations (US$ 6.4mn); • Silver in other semi – manufactured forms including silver plated with gold or platinum (US$ 4.5mn); • commodities not elsewhere specified (US$ 4.3mn). These top ten (10) exports accounted for almost 60% (59.6%) of the total export value for 2008 showing Antigua and Barbuda’s strong reliance on a narrow cohort of products. The most dynamic import markets for goods exported by Antigua and Barbuda between the years 2001 to 2009 included the Republic of Korea (4,460%) and Italy (4, 5475%). These two import markets contributed over 30% of 2009’s merchandise export earnings. However, the severe contraction in exports (mainly cargo vessel exports) to many other major markets such as Germany, the United Kingdom and Poland, severely offset these increases and contributed to the overall dismal export outturn. The export base of Antigua and Barbuda did not show any diversification, as more than 30% of the export values in 2008 (based on direct data) were accounted for by the export value of cargo vessels not elsewhere specified and other vessels for the transport of both persons and goods. In addition, in more general terms, the export value of ship, boats and other floating structures contributed over 40% of the total export earnings based on direct data for 2008. This lack of diversification is also seen in which the United States of America has the highest percentage (26.3%) of the total merchandise export earnings. Also, the top export destinations for Antigua and Barbuda were situated outside the CARICOM region. Based on mirror data, the major importing markets for goods exported from Antigua and Barbuda in 2009 were: the USA, Republic of Korea, Singapore, Italy and France. Antigua’s top regional market for exports was Barbados, which was the 11th largest market for its exports in 2009, with the Dominican Republic the 10th largest export market. This illustrates the continued dependence on overseas markets for export sales. www.crnm.org
- 3. |3 Import Overview Merchandise imports are concentrated in the area of fuels and mining. The top ten (10) products imported by Antigua and Barbuda based on the imported values in 2008 are: 1. cargo vessels not elsewhere specified and other vessels for the transport of both persons and goods (US$863.9mn); 2. commodities (US$443.6 mn); 3. light petroleum distillates not elsewhere specified (US$267mn); 4. tankers (US$36.7mn); 5. vessels and other floating structures for breaking up (US$30.6mn); 6. aviation spirit (US$21.4mn); 7. automobiles with reciprocating piston engine of a cylinder capacity exceeding 1500 cc but not exceeding 3000 cc (US$16.9mn); 8. turbo Propellers of a power exceeding 1100 KW (US$8.5mn); 9. articles of jewellery and part of other precious metal, whether or not clad with precious metals (US$8.1mn); and 10. fowls (gallus domesticus), cuts & offal, frozen (US$7.9mn). Mirror data of 2009 illustrates that the main supplying markets for Antigua and Barbuda included: • China (US$493.7 mn); • Singapore (US$282.9 mn) • United States of America (US$157 mn); • Trinidad and Tobago (US$92.8 mn); • Portugal (US$61.9 mn); • Germany (US$43.8mn); • United Kingdom (US$37.5mn); • Canada (US$18.5 mn); • Norway (US$16,443mn); and • Japan (US$12.6mn). Trade in Services Based on the export values in 2008, there is an increase in earnings in the Commercial Trade Services. Travel accounts for 65.6% of the total export earnings from services. This reflects the fact that the trade in services is not adequately diversified as there was a strong concentration of exports and imports in the areas of transport and travel, which is largely influenced by the tourism sector in the Caribbean. www.crnm.org
- 4. |4 Transportation was the other top service exported by Antigua and Barbuda, accounting for 17.9% of total export earnings from services, specifically air transport which accounted for 21.7% of total earnings from travel, and 14.3% of total export earnings from the commercial services trade. Other top services exported by Antigua and Barbuda are in table 1 below: Table. 1: Total Exports in the Commercial Services Trade from Antigua & Barbuda 2006‐2008 For imports, transportation specifically sea transport which accounted for 20% of total spending on import of services, dominates with 36.5% share of import spending by Antigua and Barbuda. In addition, there has been a steady increase in the import value of transportation services from 2004 to 2008. Other major imports in services by Antigua and Barbuda are seen in table 2 below. Unlike the total balance for the trade in goods for 2008, Antigua and Barbuda posses a surplus of US$246.3mn thousand in the trade of commercial services. www.crnm.org
- 5. |5 Table. 2: Total Imports in the Commercial Services Trade from Antigua & Barbuda 2006‐2008 _______________ 1 Sources for the profile: a) All tables and graphs takenTrademap.org database (2010) b) Statistics taken from WTO Trade Profiles and Trademap.org database (2010) c) Information was used from CIA World Fact book (2010) www.crnm.org