Spatial load forecasting in smart grids
•
0 likes•298 views

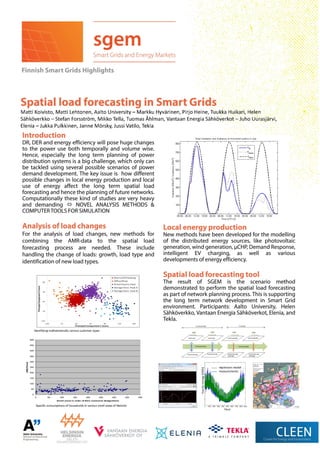
This graph shows energy use in kWh per square meter of floor area for small areas numbered 1 through 10. The y-axis measures energy use from 0 to 500 kWh/m^2, while the x-axis lists the numerical designations of the small areas from 0 to 450. The graph provides a visualization of the energy use of different small areas.
Report
Share
Report
Share
Download to read offline
Recommended
Stratifikasi sosial
Stratifikasi sosial adalah pembedaan masyarakat ke dalam kelas-kelas secara vertikal yang diwujudkan dengan adanya tingkatan masyarakat dari yang paling tinggi sampai yang paling rendah. Stratifikasi sosial telah ada sejak manusia hidup bersama dan terbentuk dari kebiasaan manusia berhubungan secara teratur dan tersusun dalam masyarakat.
Fiche-Sy#1
This project conducted the first large-scale environmental audit of Syria's textile industry. The audit assessed pollution from 10 textile mills, focusing on wastewater discharge. It found that textile production uses large amounts of water and generates significant wastewater. The project then developed individualized pollution prevention plans for each mill, introducing methods to control pollution and promote cleaner technologies. This work aimed to help the industry comply with environmental standards by improving performance.
Suma de vectores
Para sumar vectores, se puede usar el método algébrico o el método de polígono. El método algébrico suma las componentes correspondientes de cada vector, mientras que el método de polígono dibuja los vectores y conecta sus puntos finales para formar un polígono cuyo vector resultante es la suma buscada.
Luxury apartment in greater noida west
Arihant Ambar, offers luxurious residential apartments in Greater Noida West, which is carefully crafted to provide the best of amenities and facilities. To know more visit @ http://goo.gl/wa74pD
Ingles 2
The document provides examples of different parts of speech in English, including the present simple verb conjugation, adjectives like demonstrative, quantitative, interrogative, possessive, and numeric adjectives. It lists common present simple verbs and their third person singular conjugations, as well as adjectives with different functions and their examples like "fat, blue, nice" to describe things and "this, that, these, those" to point at or identify things.
Exilia Han ad - SH Family SY1516
SCIS offers an international education that equips students with skills to succeed globally. The IB program and supportive faculty allow students to excel in university. Most significantly, SCIS cultivates an open-minded community of over 60 nationalities, teaching students to communicate across cultures. The diverse and caring environment prepares students for success in any environment.
Combining Two Datasets into a Single Map Animation
The amount of environmental data is increasing, and the data would be valuable to the society if they are delivered to the right processes at the right time. In the seminar, we show examples of available data, how they are produced and processed, and how the data can be used in new innovative applications.
This presentation is part of the Environmental Data for Applications Seminar held on the 23rd of September 2015. The seminar was organised by the MMEA (Measurement, Measuring and Environmental Assessment) research programme under the Cleen Ltd (SHOK). The presentations are based on the research results related to environmental data interoperability. The participants included key players and partners in the field of environmental monitoring in Finland.
More info at www.mmea.fi
Variogram-derived measures for QC purposes
The amount of environmental data is increasing, and the data would be valuable to the society if they are delivered to the right processes at the right time. In the seminar, we show examples of available data, how they are produced and processed, and how the data can be used in new innovative applications.
This presentation is part of the Environmental Data for Applications Seminar held on the 23rd of September 2015. The seminar was organised by the MMEA (Measurement, Measuring and Environmental Assessment) research programme under the Cleen Ltd (SHOK). The presentations are based on the research results related to environmental data interoperability. The participants included key players and partners in the field of environmental monitoring in Finland.
More info at www.mmea.fi
Quality Control and Measurement Uncertainty
The amount of environmental data is increasing, and the data would be valuable to the society if they are delivered to the right processes at the right time. In the seminar, we show examples of available data, how they are produced and processed, and how the data can be used in new innovative applications.
This presentation is part of the Environmental Data for Applications Seminar held on the 23rd of September 2015. The seminar was organised by the MMEA (Measurement, Measuring and Environmental Assessment) research programme under the Cleen Ltd (SHOK). The presentations are based on the research results related to environmental data interoperability. The participants included key players and partners in the field of environmental monitoring in Finland.
More info at www.mmea.fi
MMEA Platform
The amount of environmental data is increasing, and the data would be valuable to the society if they are delivered to the right processes at the right time. In the seminar, we show examples of available data, how they are produced and processed, and how the data can be used in new innovative applications.
This presentation is part of the Environmental Data for Applications Seminar held on the 23rd of September 2015. The seminar was organised by the MMEA (Measurement, Measuring and Environmental Assessment) research programme under the Cleen Ltd (SHOK). The presentations are based on the research results related to environmental data interoperability. The participants included key players and partners in the field of environmental monitoring in Finland.
More info at www.mmea.fi
Environmental Big Data: Business Perspective
This document discusses big data from a business perspective. It explains that big data can create value for organizations by making information more transparent and usable, enabling better performance monitoring, improving decision making, allowing more precise customer segmentation, and aiding product development. Big data creates opportunities for new business models and competitive advantages but also poses challenges such as measuring ROI, developing functional strategies, integrating diverse data sources, and ensuring security, governance, and privacy. The document then discusses how environmental big data from sources like satellite imagery can provide insights for businesses seeking sustainability.
Combining Various Data Sources
The amount of environmental data is increasing, and the data would be valuable to the society if they are delivered to the right processes at the right time. In the seminar, we show examples of available data, how they are produced and processed, and how the data can be used in new innovative applications.
This presentation is part of the Environmental Data for Applications Seminar held on the 23rd of September 2015. The seminar was organised by the MMEA (Measurement, Measuring and Environmental Assessment) research programme under the Cleen Ltd (SHOK). The presentations are based on the research results related to environmental data interoperability. The participants included key players and partners in the field of environmental monitoring in Finland.
More info at www.mmea.fi
Engaging Citizens – Participatory Sensing
The amount of environmental data is increasing, and the data would be valuable to the society if they are delivered to the right processes at the right time. In the seminar, we show examples of available data, how they are produced and processed, and how the data can be used in new innovative applications.
This presentation is part of the Environmental Data for Applications Seminar held on the 23rd of September 2015. The seminar was organised by the MMEA (Measurement, Measuring and Environmental Assessment) research programme under the Cleen Ltd (SHOK). The presentations are based on the research results related to environmental data interoperability. The participants included key players and partners in the field of environmental monitoring in Finland.
More info at www.mmea.fi
Controlling Environment Monitoring Networks
The amount of environmental data is increasing, and the data would be valuable to the society if they are delivered to the right processes at the right time. In the seminar, we show examples of available data, how they are produced and processed, and how the data can be used in new innovative applications.
This presentation is part of the Environmental Data for Applications Seminar held on the 23rd of September 2015. The seminar was organised by the MMEA (Measurement, Measuring and Environmental Assessment) research programme under the Cleen Ltd (SHOK). The presentations are based on the research results related to environmental data interoperability. The participants included key players and partners in the field of environmental monitoring in Finland.
More info at www.mmea.fi
Available data sources & Real-time data collection
The amount of environmental data is increasing, and the data would be valuable to the society if they are delivered to the right processes at the right time. In the seminar, we show examples of available data, how they are produced and processed, and how the data can be used in new innovative applications.
This presentation is part of the Environmental Data for Applications Seminar held on the 23rd of September 2015. The seminar was organised by the MMEA (Measurement, Measuring and Environmental Assessment) research programme under the Cleen Ltd (SHOK). The presentations are based on the research results related to environmental data interoperability. The participants included key players and partners in the field of environmental monitoring in Finland.
More info at www.mmea.fi
Introduction to data interoperability
The amount of environmental data is increasing, and the data would be valuable to the society if they are delivered to the right processes at the right time. In the seminar, we show examples of available data, how they are produced and processed, and how the data can be used in new innovative applications.
This presentation is part of the Environmental Data for Applications Seminar held on the 23rd of September 2015. The seminar was organised by the MMEA (Measurement, Measuring and Environmental Assessment) research programme under the Cleen Ltd (SHOK). The presentations are based on the research results related to environmental data interoperability. The participants included key players and partners in the field of environmental monitoring in Finland.
More info at www.mmea.fi
Water spray geoengineering to clean air pollution for mitigating severe haze ...
CLEEN's MMEA program organised an international seminar on cleaner air - Outdoor and indoor air quality together with Zhejiang University and assistant organizer Insigma group.
This is one of the keynote presentations in the seminar.
More info in www.mmea.fi
The cleantech field is expanding rapidly and Finnish companies are committed to working for a better environment in the fields of energy efficiency, air quality and monitoring. The world-class Cleantech know-how from Finland and the cooperation with Chinese partners and the results were highlighted in the MMEA seminar. Some of the leading Finnish cleantech companies together with Finnish and Chinese research institutions were present at the event. The seminars focused on cooperation between Finland and China concerning indoor and outdoor air quality and solutions to make them better.
Solutions for vehicular emission control and evaluation for urban aq attainme...
CLEEN's MMEA program organised an international seminar on cleaner air - Outdoor and indoor air quality together with Zhejiang University and assistant organizer Insigma group.
This is one of the keynote presentations in the seminar.
More info in www.mmea.fi
The cleantech field is expanding rapidly and Finnish companies are committed to working for a better environment in the fields of energy efficiency, air quality and monitoring. The world-class Cleantech know-how from Finland and the cooperation with Chinese partners and the results were highlighted in the MMEA seminar. Some of the leading Finnish cleantech companies together with Finnish and Chinese research institutions were present at the event. The seminars focused on cooperation between Finland and China concerning indoor and outdoor air quality and solutions to make them better.
Mmea program - from sensors to services. Keynote from Dr. Tero Eklin
CLEEN's MMEA program organised an international seminar on cleaner air - Outdoor and indoor air quality together with Zhejiang University and assistant organizer Insigma group.
This is one of the keynote presentations in the seminar.
More info in www.mmea.fi
The cleantech field is expanding rapidly and Finnish companies are committed to working for a better environment in the fields of energy efficiency, air quality and monitoring. The world-class Cleantech know-how from Finland and the cooperation with Chinese partners and the results were highlighted in the MMEA seminar. Some of the leading Finnish cleantech companies together with Finnish and Chinese research institutions were present at the event. The seminars focused on cooperation between Finland and China concerning indoor and outdoor air quality and solutions to make them better.
Keynote from Insigma group by Dr. Ying Lin
CLEEN's MMEA program organised an international seminar on cleaner air - Outdoor and indoor air quality together with Zhejiang University and assistant organizer Insigma group.
This is one of the keynote presentations in the seminar.
More info in www.mmea.fi
The cleantech field is expanding rapidly and Finnish companies are committed to working for a better environment in the fields of energy efficiency, air quality and monitoring. The world-class Cleantech know-how from Finland and the cooperation with Chinese partners and the results were highlighted in the MMEA seminar. Some of the leading Finnish cleantech companies together with Finnish and Chinese research institutions were present at the event. The seminars focused on cooperation between Finland and China concerning indoor and outdoor air quality and solutions to make them better.
Analytical model to determine the influence of building area size on subslab ...
CLEEN's MMEA program organised an international seminar on cleaner air - Outdoor and indoor air quality together with Zhejiang University and assistant organizer Insigma group.
This is one of the keynote presentations in the seminar.
More info in www.mmea.fi
The cleantech field is expanding rapidly and Finnish companies are committed to working for a better environment in the fields of energy efficiency, air quality and monitoring. The world-class Cleantech know-how from Finland and the cooperation with Chinese partners and the results were highlighted in the MMEA seminar. Some of the leading Finnish cleantech companies together with Finnish and Chinese research institutions were present at the event. The seminars focused on cooperation between Finland and China concerning indoor and outdoor air quality and solutions to make them better.
激光云高仪在空气质量监测的应用
CLEEN's MMEA program organised an international seminar on cleaner air - Outdoor and indoor air quality together with Zhejiang University and assistant organizer Insigma group.
This is one of the presentations in the seminar.
More info in www.mmea.fi
The cleantech field is expanding rapidly and Finnish companies are committed to working for a better environment in the fields of energy efficiency, air quality and monitoring. The world-class Cleantech know-how from Finland and the cooperation with Chinese partners and the results were highlighted in the MMEA seminar. Some of the leading Finnish cleantech companies together with Finnish and Chinese research institutions were present at the event. The seminars focused on cooperation between Finland and China concerning indoor and outdoor air quality and solutions to make them better.
Why ultrafines? Dr. Lei Dong presented by Markku Rajala
CLEEN's MMEA program organised an international seminar on cleaner air - Outdoor and indoor air quality together with Zhejiang University and assistant organizer Insigma group.
This is one of the presentations in the seminar.
More info in www.mmea.fi
The cleantech field is expanding rapidly and Finnish companies are committed to working for a better environment in the fields of energy efficiency, air quality and monitoring. The world-class Cleantech know-how from Finland and the cooperation with Chinese partners and the results were highlighted in the MMEA seminar. Some of the leading Finnish cleantech companies together with Finnish and Chinese research institutions were present at the event. The seminars focused on cooperation between Finland and China concerning indoor and outdoor air quality and solutions to make them better.
Shenzhen demo Mr. Heikki Pentikäinen
CLEEN's MMEA program organised an international seminar on cleaner air - Outdoor and indoor air quality together with Zhejiang University and assistant organizer Insigma group.
This is one of the presentations in the seminar.
More info in www.mmea.fi
The cleantech field is expanding rapidly and Finnish companies are committed to working for a better environment in the fields of energy efficiency, air quality and monitoring. The world-class Cleantech know-how from Finland and the cooperation with Chinese partners and the results were highlighted in the MMEA seminar. Some of the leading Finnish cleantech companies together with Finnish and Chinese research institutions were present at the event. The seminars focused on cooperation between Finland and China concerning indoor and outdoor air quality and solutions to make them better.
Measuring the filtration efficiency and particle indoor outdoor concentration...
CLEEN's MMEA program organised an international seminar on cleaner air - Outdoor and indoor air quality together with Zhejiang University and assistant organizer Insigma group.
This is one of the presentations in the seminar.
More info in www.mmea.fi
The cleantech field is expanding rapidly and Finnish companies are committed to working for a better environment in the fields of energy efficiency, air quality and monitoring. The world-class Cleantech know-how from Finland and the cooperation with Chinese partners and the results were highlighted in the MMEA seminar. Some of the leading Finnish cleantech companies together with Finnish and Chinese research institutions were present at the event. The seminars focused on cooperation between Finland and China concerning indoor and outdoor air quality and solutions to make them better.
Measuring megacity air by Miikka Dal Maso and Craes
CLEEN's MMEA program organised an international seminar on cleaner air - Outdoor and indoor air quality together with Zhejiang University and assistant organizer Insigma group.
This is one of the presentations in the seminar.
More info in www.mmea.fi
The cleantech field is expanding rapidly and Finnish companies are committed to working for a better environment in the fields of energy efficiency, air quality and monitoring. The world-class Cleantech know-how from Finland and the cooperation with Chinese partners and the results were highlighted in the MMEA seminar. Some of the leading Finnish cleantech companies together with Finnish and Chinese research institutions were present at the event. The seminars focused on cooperation between Finland and China concerning indoor and outdoor air quality and solutions to make them better.
Essentials of Automations: The Art of Triggers and Actions in FME
In this second installment of our Essentials of Automations webinar series, we’ll explore the landscape of triggers and actions, guiding you through the nuances of authoring and adapting workspaces for seamless automations. Gain an understanding of the full spectrum of triggers and actions available in FME, empowering you to enhance your workspaces for efficient automation.
We’ll kick things off by showcasing the most commonly used event-based triggers, introducing you to various automation workflows like manual triggers, schedules, directory watchers, and more. Plus, see how these elements play out in real scenarios.
Whether you’re tweaking your current setup or building from the ground up, this session will arm you with the tools and insights needed to transform your FME usage into a powerhouse of productivity. Join us to discover effective strategies that simplify complex processes, enhancing your productivity and transforming your data management practices with FME. Let’s turn complexity into clarity and make your workspaces work wonders!
Programming Foundation Models with DSPy - Meetup Slides
Prompting language models is hard, while programming language models is easy. In this talk, I will discuss the state-of-the-art framework DSPy for programming foundation models with its powerful optimizers and runtime constraint system.
More Related Content
More from CLEEN_Ltd
Combining Two Datasets into a Single Map Animation
The amount of environmental data is increasing, and the data would be valuable to the society if they are delivered to the right processes at the right time. In the seminar, we show examples of available data, how they are produced and processed, and how the data can be used in new innovative applications.
This presentation is part of the Environmental Data for Applications Seminar held on the 23rd of September 2015. The seminar was organised by the MMEA (Measurement, Measuring and Environmental Assessment) research programme under the Cleen Ltd (SHOK). The presentations are based on the research results related to environmental data interoperability. The participants included key players and partners in the field of environmental monitoring in Finland.
More info at www.mmea.fi
Variogram-derived measures for QC purposes
The amount of environmental data is increasing, and the data would be valuable to the society if they are delivered to the right processes at the right time. In the seminar, we show examples of available data, how they are produced and processed, and how the data can be used in new innovative applications.
This presentation is part of the Environmental Data for Applications Seminar held on the 23rd of September 2015. The seminar was organised by the MMEA (Measurement, Measuring and Environmental Assessment) research programme under the Cleen Ltd (SHOK). The presentations are based on the research results related to environmental data interoperability. The participants included key players and partners in the field of environmental monitoring in Finland.
More info at www.mmea.fi
Quality Control and Measurement Uncertainty
The amount of environmental data is increasing, and the data would be valuable to the society if they are delivered to the right processes at the right time. In the seminar, we show examples of available data, how they are produced and processed, and how the data can be used in new innovative applications.
This presentation is part of the Environmental Data for Applications Seminar held on the 23rd of September 2015. The seminar was organised by the MMEA (Measurement, Measuring and Environmental Assessment) research programme under the Cleen Ltd (SHOK). The presentations are based on the research results related to environmental data interoperability. The participants included key players and partners in the field of environmental monitoring in Finland.
More info at www.mmea.fi
MMEA Platform
The amount of environmental data is increasing, and the data would be valuable to the society if they are delivered to the right processes at the right time. In the seminar, we show examples of available data, how they are produced and processed, and how the data can be used in new innovative applications.
This presentation is part of the Environmental Data for Applications Seminar held on the 23rd of September 2015. The seminar was organised by the MMEA (Measurement, Measuring and Environmental Assessment) research programme under the Cleen Ltd (SHOK). The presentations are based on the research results related to environmental data interoperability. The participants included key players and partners in the field of environmental monitoring in Finland.
More info at www.mmea.fi
Environmental Big Data: Business Perspective
This document discusses big data from a business perspective. It explains that big data can create value for organizations by making information more transparent and usable, enabling better performance monitoring, improving decision making, allowing more precise customer segmentation, and aiding product development. Big data creates opportunities for new business models and competitive advantages but also poses challenges such as measuring ROI, developing functional strategies, integrating diverse data sources, and ensuring security, governance, and privacy. The document then discusses how environmental big data from sources like satellite imagery can provide insights for businesses seeking sustainability.
Combining Various Data Sources
The amount of environmental data is increasing, and the data would be valuable to the society if they are delivered to the right processes at the right time. In the seminar, we show examples of available data, how they are produced and processed, and how the data can be used in new innovative applications.
This presentation is part of the Environmental Data for Applications Seminar held on the 23rd of September 2015. The seminar was organised by the MMEA (Measurement, Measuring and Environmental Assessment) research programme under the Cleen Ltd (SHOK). The presentations are based on the research results related to environmental data interoperability. The participants included key players and partners in the field of environmental monitoring in Finland.
More info at www.mmea.fi
Engaging Citizens – Participatory Sensing
The amount of environmental data is increasing, and the data would be valuable to the society if they are delivered to the right processes at the right time. In the seminar, we show examples of available data, how they are produced and processed, and how the data can be used in new innovative applications.
This presentation is part of the Environmental Data for Applications Seminar held on the 23rd of September 2015. The seminar was organised by the MMEA (Measurement, Measuring and Environmental Assessment) research programme under the Cleen Ltd (SHOK). The presentations are based on the research results related to environmental data interoperability. The participants included key players and partners in the field of environmental monitoring in Finland.
More info at www.mmea.fi
Controlling Environment Monitoring Networks
The amount of environmental data is increasing, and the data would be valuable to the society if they are delivered to the right processes at the right time. In the seminar, we show examples of available data, how they are produced and processed, and how the data can be used in new innovative applications.
This presentation is part of the Environmental Data for Applications Seminar held on the 23rd of September 2015. The seminar was organised by the MMEA (Measurement, Measuring and Environmental Assessment) research programme under the Cleen Ltd (SHOK). The presentations are based on the research results related to environmental data interoperability. The participants included key players and partners in the field of environmental monitoring in Finland.
More info at www.mmea.fi
Available data sources & Real-time data collection
The amount of environmental data is increasing, and the data would be valuable to the society if they are delivered to the right processes at the right time. In the seminar, we show examples of available data, how they are produced and processed, and how the data can be used in new innovative applications.
This presentation is part of the Environmental Data for Applications Seminar held on the 23rd of September 2015. The seminar was organised by the MMEA (Measurement, Measuring and Environmental Assessment) research programme under the Cleen Ltd (SHOK). The presentations are based on the research results related to environmental data interoperability. The participants included key players and partners in the field of environmental monitoring in Finland.
More info at www.mmea.fi
Introduction to data interoperability
The amount of environmental data is increasing, and the data would be valuable to the society if they are delivered to the right processes at the right time. In the seminar, we show examples of available data, how they are produced and processed, and how the data can be used in new innovative applications.
This presentation is part of the Environmental Data for Applications Seminar held on the 23rd of September 2015. The seminar was organised by the MMEA (Measurement, Measuring and Environmental Assessment) research programme under the Cleen Ltd (SHOK). The presentations are based on the research results related to environmental data interoperability. The participants included key players and partners in the field of environmental monitoring in Finland.
More info at www.mmea.fi
Water spray geoengineering to clean air pollution for mitigating severe haze ...
CLEEN's MMEA program organised an international seminar on cleaner air - Outdoor and indoor air quality together with Zhejiang University and assistant organizer Insigma group.
This is one of the keynote presentations in the seminar.
More info in www.mmea.fi
The cleantech field is expanding rapidly and Finnish companies are committed to working for a better environment in the fields of energy efficiency, air quality and monitoring. The world-class Cleantech know-how from Finland and the cooperation with Chinese partners and the results were highlighted in the MMEA seminar. Some of the leading Finnish cleantech companies together with Finnish and Chinese research institutions were present at the event. The seminars focused on cooperation between Finland and China concerning indoor and outdoor air quality and solutions to make them better.
Solutions for vehicular emission control and evaluation for urban aq attainme...
CLEEN's MMEA program organised an international seminar on cleaner air - Outdoor and indoor air quality together with Zhejiang University and assistant organizer Insigma group.
This is one of the keynote presentations in the seminar.
More info in www.mmea.fi
The cleantech field is expanding rapidly and Finnish companies are committed to working for a better environment in the fields of energy efficiency, air quality and monitoring. The world-class Cleantech know-how from Finland and the cooperation with Chinese partners and the results were highlighted in the MMEA seminar. Some of the leading Finnish cleantech companies together with Finnish and Chinese research institutions were present at the event. The seminars focused on cooperation between Finland and China concerning indoor and outdoor air quality and solutions to make them better.
Mmea program - from sensors to services. Keynote from Dr. Tero Eklin
CLEEN's MMEA program organised an international seminar on cleaner air - Outdoor and indoor air quality together with Zhejiang University and assistant organizer Insigma group.
This is one of the keynote presentations in the seminar.
More info in www.mmea.fi
The cleantech field is expanding rapidly and Finnish companies are committed to working for a better environment in the fields of energy efficiency, air quality and monitoring. The world-class Cleantech know-how from Finland and the cooperation with Chinese partners and the results were highlighted in the MMEA seminar. Some of the leading Finnish cleantech companies together with Finnish and Chinese research institutions were present at the event. The seminars focused on cooperation between Finland and China concerning indoor and outdoor air quality and solutions to make them better.
Keynote from Insigma group by Dr. Ying Lin
CLEEN's MMEA program organised an international seminar on cleaner air - Outdoor and indoor air quality together with Zhejiang University and assistant organizer Insigma group.
This is one of the keynote presentations in the seminar.
More info in www.mmea.fi
The cleantech field is expanding rapidly and Finnish companies are committed to working for a better environment in the fields of energy efficiency, air quality and monitoring. The world-class Cleantech know-how from Finland and the cooperation with Chinese partners and the results were highlighted in the MMEA seminar. Some of the leading Finnish cleantech companies together with Finnish and Chinese research institutions were present at the event. The seminars focused on cooperation between Finland and China concerning indoor and outdoor air quality and solutions to make them better.
Analytical model to determine the influence of building area size on subslab ...
CLEEN's MMEA program organised an international seminar on cleaner air - Outdoor and indoor air quality together with Zhejiang University and assistant organizer Insigma group.
This is one of the keynote presentations in the seminar.
More info in www.mmea.fi
The cleantech field is expanding rapidly and Finnish companies are committed to working for a better environment in the fields of energy efficiency, air quality and monitoring. The world-class Cleantech know-how from Finland and the cooperation with Chinese partners and the results were highlighted in the MMEA seminar. Some of the leading Finnish cleantech companies together with Finnish and Chinese research institutions were present at the event. The seminars focused on cooperation between Finland and China concerning indoor and outdoor air quality and solutions to make them better.
激光云高仪在空气质量监测的应用
CLEEN's MMEA program organised an international seminar on cleaner air - Outdoor and indoor air quality together with Zhejiang University and assistant organizer Insigma group.
This is one of the presentations in the seminar.
More info in www.mmea.fi
The cleantech field is expanding rapidly and Finnish companies are committed to working for a better environment in the fields of energy efficiency, air quality and monitoring. The world-class Cleantech know-how from Finland and the cooperation with Chinese partners and the results were highlighted in the MMEA seminar. Some of the leading Finnish cleantech companies together with Finnish and Chinese research institutions were present at the event. The seminars focused on cooperation between Finland and China concerning indoor and outdoor air quality and solutions to make them better.
Why ultrafines? Dr. Lei Dong presented by Markku Rajala
CLEEN's MMEA program organised an international seminar on cleaner air - Outdoor and indoor air quality together with Zhejiang University and assistant organizer Insigma group.
This is one of the presentations in the seminar.
More info in www.mmea.fi
The cleantech field is expanding rapidly and Finnish companies are committed to working for a better environment in the fields of energy efficiency, air quality and monitoring. The world-class Cleantech know-how from Finland and the cooperation with Chinese partners and the results were highlighted in the MMEA seminar. Some of the leading Finnish cleantech companies together with Finnish and Chinese research institutions were present at the event. The seminars focused on cooperation between Finland and China concerning indoor and outdoor air quality and solutions to make them better.
Shenzhen demo Mr. Heikki Pentikäinen
CLEEN's MMEA program organised an international seminar on cleaner air - Outdoor and indoor air quality together with Zhejiang University and assistant organizer Insigma group.
This is one of the presentations in the seminar.
More info in www.mmea.fi
The cleantech field is expanding rapidly and Finnish companies are committed to working for a better environment in the fields of energy efficiency, air quality and monitoring. The world-class Cleantech know-how from Finland and the cooperation with Chinese partners and the results were highlighted in the MMEA seminar. Some of the leading Finnish cleantech companies together with Finnish and Chinese research institutions were present at the event. The seminars focused on cooperation between Finland and China concerning indoor and outdoor air quality and solutions to make them better.
Measuring the filtration efficiency and particle indoor outdoor concentration...
CLEEN's MMEA program organised an international seminar on cleaner air - Outdoor and indoor air quality together with Zhejiang University and assistant organizer Insigma group.
This is one of the presentations in the seminar.
More info in www.mmea.fi
The cleantech field is expanding rapidly and Finnish companies are committed to working for a better environment in the fields of energy efficiency, air quality and monitoring. The world-class Cleantech know-how from Finland and the cooperation with Chinese partners and the results were highlighted in the MMEA seminar. Some of the leading Finnish cleantech companies together with Finnish and Chinese research institutions were present at the event. The seminars focused on cooperation between Finland and China concerning indoor and outdoor air quality and solutions to make them better.
Measuring megacity air by Miikka Dal Maso and Craes
CLEEN's MMEA program organised an international seminar on cleaner air - Outdoor and indoor air quality together with Zhejiang University and assistant organizer Insigma group.
This is one of the presentations in the seminar.
More info in www.mmea.fi
The cleantech field is expanding rapidly and Finnish companies are committed to working for a better environment in the fields of energy efficiency, air quality and monitoring. The world-class Cleantech know-how from Finland and the cooperation with Chinese partners and the results were highlighted in the MMEA seminar. Some of the leading Finnish cleantech companies together with Finnish and Chinese research institutions were present at the event. The seminars focused on cooperation between Finland and China concerning indoor and outdoor air quality and solutions to make them better.
More from CLEEN_Ltd (20)
Combining Two Datasets into a Single Map Animation
Combining Two Datasets into a Single Map Animation
Available data sources & Real-time data collection
Available data sources & Real-time data collection
Water spray geoengineering to clean air pollution for mitigating severe haze ...
Water spray geoengineering to clean air pollution for mitigating severe haze ...
Solutions for vehicular emission control and evaluation for urban aq attainme...
Solutions for vehicular emission control and evaluation for urban aq attainme...
Mmea program - from sensors to services. Keynote from Dr. Tero Eklin
Mmea program - from sensors to services. Keynote from Dr. Tero Eklin
Analytical model to determine the influence of building area size on subslab ...
Analytical model to determine the influence of building area size on subslab ...
Why ultrafines? Dr. Lei Dong presented by Markku Rajala
Why ultrafines? Dr. Lei Dong presented by Markku Rajala
Measuring the filtration efficiency and particle indoor outdoor concentration...
Measuring the filtration efficiency and particle indoor outdoor concentration...
Measuring megacity air by Miikka Dal Maso and Craes
Measuring megacity air by Miikka Dal Maso and Craes
Recently uploaded
Essentials of Automations: The Art of Triggers and Actions in FME
In this second installment of our Essentials of Automations webinar series, we’ll explore the landscape of triggers and actions, guiding you through the nuances of authoring and adapting workspaces for seamless automations. Gain an understanding of the full spectrum of triggers and actions available in FME, empowering you to enhance your workspaces for efficient automation.
We’ll kick things off by showcasing the most commonly used event-based triggers, introducing you to various automation workflows like manual triggers, schedules, directory watchers, and more. Plus, see how these elements play out in real scenarios.
Whether you’re tweaking your current setup or building from the ground up, this session will arm you with the tools and insights needed to transform your FME usage into a powerhouse of productivity. Join us to discover effective strategies that simplify complex processes, enhancing your productivity and transforming your data management practices with FME. Let’s turn complexity into clarity and make your workspaces work wonders!
Programming Foundation Models with DSPy - Meetup Slides
Prompting language models is hard, while programming language models is easy. In this talk, I will discuss the state-of-the-art framework DSPy for programming foundation models with its powerful optimizers and runtime constraint system.
Artificial Intelligence for XMLDevelopment
In the rapidly evolving landscape of technologies, XML continues to play a vital role in structuring, storing, and transporting data across diverse systems. The recent advancements in artificial intelligence (AI) present new methodologies for enhancing XML development workflows, introducing efficiency, automation, and intelligent capabilities. This presentation will outline the scope and perspective of utilizing AI in XML development. The potential benefits and the possible pitfalls will be highlighted, providing a balanced view of the subject.
We will explore the capabilities of AI in understanding XML markup languages and autonomously creating structured XML content. Additionally, we will examine the capacity of AI to enrich plain text with appropriate XML markup. Practical examples and methodological guidelines will be provided to elucidate how AI can be effectively prompted to interpret and generate accurate XML markup.
Further emphasis will be placed on the role of AI in developing XSLT, or schemas such as XSD and Schematron. We will address the techniques and strategies adopted to create prompts for generating code, explaining code, or refactoring the code, and the results achieved.
The discussion will extend to how AI can be used to transform XML content. In particular, the focus will be on the use of AI XPath extension functions in XSLT, Schematron, Schematron Quick Fixes, or for XML content refactoring.
The presentation aims to deliver a comprehensive overview of AI usage in XML development, providing attendees with the necessary knowledge to make informed decisions. Whether you’re at the early stages of adopting AI or considering integrating it in advanced XML development, this presentation will cover all levels of expertise.
By highlighting the potential advantages and challenges of integrating AI with XML development tools and languages, the presentation seeks to inspire thoughtful conversation around the future of XML development. We’ll not only delve into the technical aspects of AI-powered XML development but also discuss practical implications and possible future directions.
Mind map of terminologies used in context of Generative AI
Mind map of common terms used in context of Generative AI.
Removing Uninteresting Bytes in Software Fuzzing
Imagine a world where software fuzzing, the process of mutating bytes in test seeds to uncover hidden and erroneous program behaviors, becomes faster and more effective. A lot depends on the initial seeds, which can significantly dictate the trajectory of a fuzzing campaign, particularly in terms of how long it takes to uncover interesting behaviour in your code. We introduce DIAR, a technique designed to speedup fuzzing campaigns by pinpointing and eliminating those uninteresting bytes in the seeds. Picture this: instead of wasting valuable resources on meaningless mutations in large, bloated seeds, DIAR removes the unnecessary bytes, streamlining the entire process.
In this work, we equipped AFL, a popular fuzzer, with DIAR and examined two critical Linux libraries -- Libxml's xmllint, a tool for parsing xml documents, and Binutil's readelf, an essential debugging and security analysis command-line tool used to display detailed information about ELF (Executable and Linkable Format). Our preliminary results show that AFL+DIAR does not only discover new paths more quickly but also achieves higher coverage overall. This work thus showcases how starting with lean and optimized seeds can lead to faster, more comprehensive fuzzing campaigns -- and DIAR helps you find such seeds.
- These are slides of the talk given at IEEE International Conference on Software Testing Verification and Validation Workshop, ICSTW 2022.
20240609 QFM020 Irresponsible AI Reading List May 2024
Everything I found interesting about the irresponsible use of machine intelligence in May 2024
“Building and Scaling AI Applications with the Nx AI Manager,” a Presentation...
“Building and Scaling AI Applications with the Nx AI Manager,” a Presentation...Edge AI and Vision Alliance
For the full video of this presentation, please visit: https://www.edge-ai-vision.com/2024/06/building-and-scaling-ai-applications-with-the-nx-ai-manager-a-presentation-from-network-optix/
Robin van Emden, Senior Director of Data Science at Network Optix, presents the “Building and Scaling AI Applications with the Nx AI Manager,” tutorial at the May 2024 Embedded Vision Summit.
In this presentation, van Emden covers the basics of scaling edge AI solutions using the Nx tool kit. He emphasizes the process of developing AI models and deploying them globally. He also showcases the conversion of AI models and the creation of effective edge AI pipelines, with a focus on pre-processing, model conversion, selecting the appropriate inference engine for the target hardware and post-processing.
van Emden shows how Nx can simplify the developer’s life and facilitate a rapid transition from concept to production-ready applications.He provides valuable insights into developing scalable and efficient edge AI solutions, with a strong focus on practical implementation.TrustArc Webinar - 2024 Global Privacy Survey
How does your privacy program stack up against your peers? What challenges are privacy teams tackling and prioritizing in 2024?
In the fifth annual Global Privacy Benchmarks Survey, we asked over 1,800 global privacy professionals and business executives to share their perspectives on the current state of privacy inside and outside of their organizations. This year’s report focused on emerging areas of importance for privacy and compliance professionals, including considerations and implications of Artificial Intelligence (AI) technologies, building brand trust, and different approaches for achieving higher privacy competence scores.
See how organizational priorities and strategic approaches to data security and privacy are evolving around the globe.
This webinar will review:
- The top 10 privacy insights from the fifth annual Global Privacy Benchmarks Survey
- The top challenges for privacy leaders, practitioners, and organizations in 2024
- Key themes to consider in developing and maintaining your privacy program
Best 20 SEO Techniques To Improve Website Visibility In SERP
Boost your website's visibility with proven SEO techniques! Our latest blog dives into essential strategies to enhance your online presence, increase traffic, and rank higher on search engines. From keyword optimization to quality content creation, learn how to make your site stand out in the crowded digital landscape. Discover actionable tips and expert insights to elevate your SEO game.
Let's Integrate MuleSoft RPA, COMPOSER, APM with AWS IDP along with Slack
Discover the seamless integration of RPA (Robotic Process Automation), COMPOSER, and APM with AWS IDP enhanced with Slack notifications. Explore how these technologies converge to streamline workflows, optimize performance, and ensure secure access, all while leveraging the power of AWS IDP and real-time communication via Slack notifications.
UiPath Test Automation using UiPath Test Suite series, part 6
Welcome to UiPath Test Automation using UiPath Test Suite series part 6. In this session, we will cover Test Automation with generative AI and Open AI.
UiPath Test Automation with generative AI and Open AI webinar offers an in-depth exploration of leveraging cutting-edge technologies for test automation within the UiPath platform. Attendees will delve into the integration of generative AI, a test automation solution, with Open AI advanced natural language processing capabilities.
Throughout the session, participants will discover how this synergy empowers testers to automate repetitive tasks, enhance testing accuracy, and expedite the software testing life cycle. Topics covered include the seamless integration process, practical use cases, and the benefits of harnessing AI-driven automation for UiPath testing initiatives. By attending this webinar, testers, and automation professionals can gain valuable insights into harnessing the power of AI to optimize their test automation workflows within the UiPath ecosystem, ultimately driving efficiency and quality in software development processes.
What will you get from this session?
1. Insights into integrating generative AI.
2. Understanding how this integration enhances test automation within the UiPath platform
3. Practical demonstrations
4. Exploration of real-world use cases illustrating the benefits of AI-driven test automation for UiPath
Topics covered:
What is generative AI
Test Automation with generative AI and Open AI.
UiPath integration with generative AI
Speaker:
Deepak Rai, Automation Practice Lead, Boundaryless Group and UiPath MVP
Full-RAG: A modern architecture for hyper-personalization
Mike Del Balso, CEO & Co-Founder at Tecton, presents "Full RAG," a novel approach to AI recommendation systems, aiming to push beyond the limitations of traditional models through a deep integration of contextual insights and real-time data, leveraging the Retrieval-Augmented Generation architecture. This talk will outline Full RAG's potential to significantly enhance personalization, address engineering challenges such as data management and model training, and introduce data enrichment with reranking as a key solution. Attendees will gain crucial insights into the importance of hyperpersonalization in AI, the capabilities of Full RAG for advanced personalization, and strategies for managing complex data integrations for deploying cutting-edge AI solutions.
Microsoft - Power Platform_G.Aspiotis.pdf
Revolutionizing Application Development
with AI-powered low-code, presentation by George Aspiotis, Sr. Partner Development Manager, Microsoft
GraphSummit Singapore | Graphing Success: Revolutionising Organisational Stru...
Sudheer Mechineni, Head of Application Frameworks, Standard Chartered Bank
Discover how Standard Chartered Bank harnessed the power of Neo4j to transform complex data access challenges into a dynamic, scalable graph database solution. This keynote will cover their journey from initial adoption to deploying a fully automated, enterprise-grade causal cluster, highlighting key strategies for modelling organisational changes and ensuring robust disaster recovery. Learn how these innovations have not only enhanced Standard Chartered Bank’s data infrastructure but also positioned them as pioneers in the banking sector’s adoption of graph technology.
Unlock the Future of Search with MongoDB Atlas_ Vector Search Unleashed.pdf
Discover how MongoDB Atlas and vector search technology can revolutionize your application's search capabilities. This comprehensive presentation covers:
* What is Vector Search?
* Importance and benefits of vector search
* Practical use cases across various industries
* Step-by-step implementation guide
* Live demos with code snippets
* Enhancing LLM capabilities with vector search
* Best practices and optimization strategies
Perfect for developers, AI enthusiasts, and tech leaders. Learn how to leverage MongoDB Atlas to deliver highly relevant, context-aware search results, transforming your data retrieval process. Stay ahead in tech innovation and maximize the potential of your applications.
#MongoDB #VectorSearch #AI #SemanticSearch #TechInnovation #DataScience #LLM #MachineLearning #SearchTechnology
GraphSummit Singapore | Neo4j Product Vision & Roadmap - Q2 2024
Maruthi Prithivirajan, Head of ASEAN & IN Solution Architecture, Neo4j
Get an inside look at the latest Neo4j innovations that enable relationship-driven intelligence at scale. Learn more about the newest cloud integrations and product enhancements that make Neo4j an essential choice for developers building apps with interconnected data and generative AI.
Uni Systems Copilot event_05062024_C.Vlachos.pdf
Unlocking Productivity: Leveraging the Potential of Copilot in Microsoft 365, a presentation by Christoforos Vlachos, Senior Solutions Manager – Modern Workplace, Uni Systems
Communications Mining Series - Zero to Hero - Session 1
This session provides introduction to UiPath Communication Mining, importance and platform overview. You will acquire a good understand of the phases in Communication Mining as we go over the platform with you. Topics covered:
• Communication Mining Overview
• Why is it important?
• How can it help today’s business and the benefits
• Phases in Communication Mining
• Demo on Platform overview
• Q/A
Recently uploaded (20)
Essentials of Automations: The Art of Triggers and Actions in FME
Essentials of Automations: The Art of Triggers and Actions in FME
Programming Foundation Models with DSPy - Meetup Slides
Programming Foundation Models with DSPy - Meetup Slides
Mind map of terminologies used in context of Generative AI
Mind map of terminologies used in context of Generative AI
20240609 QFM020 Irresponsible AI Reading List May 2024
20240609 QFM020 Irresponsible AI Reading List May 2024
“Building and Scaling AI Applications with the Nx AI Manager,” a Presentation...
“Building and Scaling AI Applications with the Nx AI Manager,” a Presentation...
Best 20 SEO Techniques To Improve Website Visibility In SERP
Best 20 SEO Techniques To Improve Website Visibility In SERP
Let's Integrate MuleSoft RPA, COMPOSER, APM with AWS IDP along with Slack
Let's Integrate MuleSoft RPA, COMPOSER, APM with AWS IDP along with Slack
UiPath Test Automation using UiPath Test Suite series, part 6
UiPath Test Automation using UiPath Test Suite series, part 6
Full-RAG: A modern architecture for hyper-personalization
Full-RAG: A modern architecture for hyper-personalization
GraphSummit Singapore | Graphing Success: Revolutionising Organisational Stru...
GraphSummit Singapore | Graphing Success: Revolutionising Organisational Stru...
Unlock the Future of Search with MongoDB Atlas_ Vector Search Unleashed.pdf
Unlock the Future of Search with MongoDB Atlas_ Vector Search Unleashed.pdf
GraphSummit Singapore | Neo4j Product Vision & Roadmap - Q2 2024
GraphSummit Singapore | Neo4j Product Vision & Roadmap - Q2 2024
Communications Mining Series - Zero to Hero - Session 1
Communications Mining Series - Zero to Hero - Session 1
Spatial load forecasting in smart grids
- 1. 0 50 100 150 200 250 300 350 400 450 500 0 50 100 150 200 250 300 350 400 Small areas in order of their numerical designations kWh/FA-m2