
Recommended
Recommended
More Related Content
Viewers also liked
Viewers also liked (19)
Similar to October 2016-2
Similar to October 2016-2 (20)
Recently uploaded
Recently uploaded (20)
October 2016-2
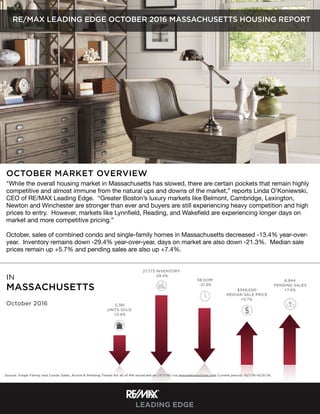
- 1. OCTOBER MARKET OVERVIEW IN MASSACHUSETTS October 2016 59 DOM -21.3% 6,944 PENDING SALES +7.4% 27,773 INVENTORY -29.4% 5,381 UNITS SOLD -13.4% $349,000 MEDIAN SALE PRICE +5.7% RE/MAX LEADING EDGE OCTOBER 2016 MASSACHUSETTS HOUSING REPORT Source: Single Family and Condo Sales, Active & Pending Trends for all of MA extracted on (11/1/16) via imaxwebsolutions.com Current period: 10/1/16-10/31/16 "While the overall housing market in Massachusetts has slowed, there are certain pockets that remain highly competitive and almost immune from the natural ups and downs of the market,” reports Linda O’Koniewski, CEO of RE/MAX Leading Edge. “Greater Boston’s luxury markets like Belmont, Cambridge, Lexington, Newton and Winchester are stronger than ever and buyers are still experiencing heavy competition and high prices to entry. However, markets like Lynnfield, Reading, and Wakefield are experiencing longer days on market and more competitive pricing.” October, sales of combined condo and single-family homes in Massachusetts decreased -13.4% year-over- year. Inventory remains down -29.4% year-over-year, days on market are also down -21.3%. Median sale prices remain up +5.7% and pending sales are also up +7.4%.
- 2. MEDIAN $ -6.4% MEDIAN $ -28.7% UNITS +37.5% UNITS -46.8% OCTOBER 2016 BOSTON HOUSING REPORT MEDIAN $ +23.7% UNITS -16.6% MEDIAN $ -21.1% BACK BAY 2016 2015 BEACON HILL 2016 2015 CHARLESTOWN 2016 2015 DORCHESTER 2016 2015 UNITS SOLD 33 24 INVENTORY 138 181 DOM 59 82 MEDIAN $ $799,000 $1,121,000 PENDING 47 34 UNITS SOLD 5 10 INVENTORY 69 75 DOM 47 36 MEDIAN $ $860,000 $695,000 PENDING 13 17 UNITS SOLD 17 32 INVENTORY 82 81 DOM 31 38 MEDIAN $ $610,000 $652,000 PENDING 37 30 UNITS SOLD 15 18 INVENTORY 76 92 DOM 28 65 MEDIAN $ $309,000 $392,000 PENDING 11 29 53 Hereford Street, Boston | 617.262.8200 LeadingEdgeAgents.com Source: MLSPIN via imaxwebsolutions. Condo & Single Family Trends for period ending 10/31/16. UNITS -50%
- 3. UNITS +75% MEDIAN $ -16.6% OCTOBER 2016 BOSTON HOUSING REPORT MEDIAN $ +36.9% FENWAY 2016 2015 NORTH END 2016 2015 ROXBURY 2016 2015 SEAPORT 2016 2015 UNITS SOLD 7 4 INVENTORY 13 17 DOM 31 19 MEDIAN $ $400,000 $480,000 PENDING 7 4 UNITS SOLD 9 5 INVENTORY 13 21 DOM 26 24 MEDIAN $ $715,000 $522,000 PENDING 5 4 UNITS SOLD 4 4 INVENTORY 9 14 DOM 34 52 MEDIAN $ $582,500 $1,999,500 PENDING 4 6 53 Hereford Street, Boston | 617.262.8200 LeadingEdgeAgents.com Source: MLSPIN via imaxwebsolutions. Condo & Single Family Trends for period ending 10/31/16. UNITS +80% MEDIAN $ -70.8% UNITS 0% UNITS SOLD 7 2 INVENTORY 25 18 DOM 35 80 MEDIAN $ $475,000 $512,500 PENDING 9 0 MEDIAN $ -7.3% UNITS +250%
- 4. MEDIAN $ -29.9% UNITS +12.5% OCTOBER 2016 BOSTON HOUSING REPORT UNITS -16.6% MEDIAN $ -21.2% SOUTH BOSTON 2016 2015 SOUTH END 2016 2015 WATERFRONT 2016 2015 WEST ROXBURY 2016 2015 UNITS SOLD 22 46 INVENTORY 193 164 DOM 36 38 MEDIAN $ $656,500 $622,500 PENDING 58 45 UNITS SOLD 9 8 INVENTORY 47 58 DOM 55 46 MEDIAN $ $835,000 $1,192,000 PENDING 7 9 UNITS SOLD 15 18 INVENTORY 58 98 DOM 35 48 MEDIAN $ $387,500 $492,250 PENDING 24 27 53 Hereford Street, Boston | 617.262.8200 LeadingEdgeAgents.com Source: MLSPIN via imaxwebsolutions. Condo & Single Family Trends for period ending 10/31/16. MEDIAN $ +5.4% UNITS -52.1% UNITS +3.7% MEDIAN $ +12.5% UNITS SOLD 28 27 INVENTORY 154 210 DOM 37 32 MEDIAN $ $844,375 $750,000 PENDING 55 66
- 5. OCTOBER 2016 ARLINGTON SINGLE FAMILY MEDIAN SALE PRICE +8.5% AVERAGE DAYS ON MARKET -4.7% PENDING SALES -7.1% 2016 2015 2016 2015 2016 2015 NUMBER OF UNITS SOLD -41.6% 2016 2015 TOTAL INVENTORY -36.3% 2016 2015 1 10 100 14 UNITS 24 UNITS 1 10 100 49 UNITS 77 UNITS 1000 1000000 $708,750 $653,250 10 100 20 DAYS 21 DAYS 10 100 26 UNITS 28 UNITS 319 Mass Ave, Arlington | 781.643.0430 LeadingEdgeAgents.com Source: MLSPIN via imaxwebsolutions. Single Family Trends for period ending 10/31/16.
- 6. OCTOBER 2016 ARLINGTON CONDOMINIUMS MEDIAN SALE PRICE +0.7% AVERAGE DAYS ON MARKET -36.3% PENDING SALES +27.7% 2016 2015 2016 2015 2016 2015 NUMBER OF UNITS SOLD -36.3% 2016 2015 TOTAL INVENTORY -22.9% 2016 2015 1 10 100 14 UNITS 22 UNITS 1 10 100 37 UNITS 48 UNITS 1000 1000000 $495,500 $492,000 1 10 100 14 DAYS 22 DAYS 1 10 100 23 UNITS 18 UNITS 319 Mass Ave, Arlington | 781.643.0430 LeadingEdgeAgents.com Source: MLSPIN via imaxwebsolutions. Condo trends for period ending 10/31/16.
- 7. OCTOBER 2016 BELMONT SINGLE FAMILIES MEDIAN SALE PRICE +25.5% AVERAGE DAYS ON MARKET -23.5% PENDING SALES -50% 2016 2015 2016 2015 2016 2015 NUMBER OF UNITS SOLD +33.3% 2016 2015 TOTAL INVENTORY -46% 2016 2015 0 2 4 6 8 8 UNITS 6 UNITS 1 10 100 27 UNITS 50 UNITS 1 1000 1000000 $1,086,250 $865,000 1 10 100 39 DAYS 51 DAYS 1 10 100 10 UNITS 20 UNITS Source: MLSPIN via imaxwebsolutions. Single Family for period ending 10/31/16. 84 Leonard Street, Belmont| 617.484.1900 LeadingEdgeAgents.com
- 8. OCTOBER 2016 BELMONT CONDOMINIUMS MEDIAN SALE PRICE +17.7% AVERAGE DAYS ON MARKET +214.2% PENDING SALES +200% 2016 2015 2016 2015 2016 2015 NUMBER OF UNITS SOLD +200% 2016 2015 TOTAL INVENTORY -15.7% 2016 2015 0 2.25 4.5 6.75 9 9 UNITS 3 UNITS 10 100 22 UNITS 19 UNITS 1000 1000000 $585,000 $497,000 1 10 100 44 DAYS 14 DAYS 0 2.25 4.5 6.75 9 9 UNITS 3 UNITS Source: MLSPIN via imaxwebsolutions. Condo for period ending 10/31/16. 84 Leonard Street, Belmont| 617.484.1900 LeadingEdgeAgents.com
- 9. OCTOBER 2016 BELMONT MULTI FAMILY MEDIAN SALE PRICE -100% AVERAGE DAYS ON MARKET -100% PENDING SALES 0% 2016 2015 2016 2015 2016 2015 NUMBER OF UNITS SOLD -100% 2016 2015 TOTAL INVENTORY +66.6% 2016 2015 0 1.25 2.5 3.75 5 0 UNITS 5 UNITS 0 2.5 5 7.5 10 10 UNIT 6 UNITS 1 1000 1000000 $0 $868,000 1 10 100 0 DAYS 34 DAYS 0 0.75 1.5 2.25 3 3 UNIT 3 UNITS Source: MLSPIN via imaxwebsolutions. Multi Family for period ending 10/31/16. 84 Leonard Street, Belmont| 617.484.1900 LeadingEdgeAgents.com
- 10. OCTOBER 2016 CAMBRIDGE SINGLE FAMILIES MEDIAN SALE PRICE -17.5% AVERAGE DAYS ON MARKET -50.9% PENDING SALES -26.6% 2016 2015 2016 2015 2016 2015 NUMBER OF UNITS SOLD +33.3% 2016 2015 TOTAL INVENTORY -15.5% 2016 2015 1 10 100 8 UNITS 6 UNITS 10 100 38 UNITS 45 UNITS 1 1000 1000000 $1,112,500 $1,348,500 1 10 100 27 DAYS 55 DAYS 1 10 100 11 UNITS 15 UNITS Source: MLSPIN via imaxwebsolutions. Single Family for period ending 10/31/16. 2 Brattle Square, Cambridge| 617.497.4400 LeadingEdgeAgents.com
- 11. OCTOBER 2016 CAMBRIDGE CONDOMINIUMS MEDIAN SALE PRICE +16.6% AVERAGE DAYS ON MARKET +14.2% PENDING SALES +50% 2016 2015 2016 2015 2016 2015 NUMBER OF UNITS SOLD -25% 2016 2015 TOTAL INVENTORY +16.2% 2016 2015 1 10 100 36 UNITS 48 UNITS 10 100 150 UNITS 129 UNITS 1000 1000000 $700,000 $600,000 10 100 24 DAYS 21 DAYS 1 10 100 75 UNITS 50 UNITS Source: MLSPIN via imaxwebsolutions. Condo Trends for period ending 10/31/16 2 Brattle Square, Cambridge| 617.497.4400 LeadingEdgeAgents.com
- 12. OCTOBER 2016 CAMBRIDGE MULTI FAMILY MEDIAN SALE PRICE +18.3% AVERAGE DAYS ON MARKET -39.2% PENDING SALES +40% 2016 2015 2016 2015 2016 2015 NUMBER OF UNITS SOLD -25% 2016 2015 TOTAL INVENTORY -30.5% 2016 2015 1 10 100 6 UNITS 8 UNITS 1 10 100 25 UNITS 36 UNITS 1000 1000000 $1,474,950 $1,246,000 1 10 100 34 DAYS 56 DAYS 0 3.5 7 10.5 14 14 UNITS 10 UNITS Source: MLSPIN via imaxwebsolutions. Multi Family Trends for period ending 10/31/16. 2 Brattle Square, Cambridge| 617.497.4400 LeadingEdgeAgents.com
- 13. OCTOBER 2016 LEXINGTON SINGLE FAMILIES MEDIAN SALE PRICE +20.4% AVERAGE DAYS ON MARKET +54.3% PENDING SALES +15.6% 2016 2015 2016 2015 2016 2015 NUMBER OF UNITS SOLD -31.2% 2016 2015 TOTAL INVENTORY -14.4% 2016 2015 1 10 100 22 UNITS 32 UNITS 10 100 107 UNITS 125 UNITS 1000 1000000 $1,210,000 $1,005,000 1 10 100 88 DAYS 57 DAYS 10 100 37 UNITS 32 UNITS 1756 Massachusetts Avenue, Lexington | 781.325.7002 LeadingEdgeAgents.com LEADING EDGE Source: MLSPIN via imaxwebsolutions. Single Family for period ending 10/31/16
- 14. xs OCTOBER 2016 LYNNFIELD SINGLE FAMILIES MEDIAN SALE PRICE +28.5% AVERAGE DAYS ON MARKET -31.5% PENDING SALES -11.1% 2016 2015 2016 2015 2016 2015 NUMBER OF UNITS SOLD 0% 2016 2015 TOTAL INVENTORY +5.6% 2016 2015 1 10 100 11 UNITS 11 UNITS 10 100 56 UNITS 53 UNITS 1 1000 1000000 $675,000 $525,000 1 10 100 50 DAYS 73 DAYS 10 100 8 UNITS 9 UNITS 590 Main Street, Lynnfield | 781.325.7002 LeadingEdgeAgents.com Source: MLSPIN via imaxwebsolutions. Single Family for period ending 10/31/16.
- 15. OCTOBER 2016 MEDFORD SINGLE FAMILIES MEDIAN SALE PRICE +10.3% AVERAGE DAYS ON MARKET -12.5% PENDING SALES +3.8% 2016 2015 2016 2015 2016 2015 NUMBER OF UNITS SOLD -71.4% 2016 2015 TOTAL INVENTORY -50% 2016 2015 1 10 100 8 UNITS 28 UNITS 1 10 100 46 UNITS 92 UNITS 1000 1000000 $534,750 $484,500 10 100 35 DAYS 40 DAYS 10 100 27 UNITS 26 UNITS LeadingEdgeAgents.com Source: MLSPIN via imaxwebsolutions. Single Family for period ending 10/31/16
- 16. OCTOBER 2016 MEDFORD CONDOMINIUMS MEDIAN SALE PRICE +5% AVERAGE DAYS ON MARKET +62.9% PENDING SALES +46.6% 2016 2015 2016 2015 2016 2015 NUMBER OF UNITS SOLD -10.5% 2016 2015 TOTAL INVENTORY -14.5% 2016 2015 10 100 17 UNITS 19 UNITS 10 100 47 UNITS 55 UNITS 1000 1000000 $420,000 $400,000 1 10 100 44 DAYS 27 DAYS 1 10 100 22 UNITS 15 UNITS LeadingEdgeAgents.com Source: MLSPIN via imaxwebsolutions. Condo Trends for period ending 10/31/16.
- 17. OCTOBER 2016 MEDFORD MULTI FAMILY MEDIAN SALE PRICE -0.7% AVERAGE DAYS ON MARKET -18.7% PENDING SALES -50% 2016 2015 2016 2015 2016 2015 NUMBER OF UNITS SOLD -10% 2016 2015 TOTAL INVENTORY -50% 2016 2015 10 100 9 UNITS 10 UNITS 1 10 100 17 UNITS 34 UNITS 1000 1000000 $655,000 $660,000 1 10 100 26 DAYS 32 DAYS 1 10 100 6 UNITS 12 UNITS LeadingEdgeAgents.com Source: MLSPIN via imaxwebsolutions. Multi Family Trends for period ending 10/31/16.
- 18. OCTOBER 2016 MELROSE SINGLE FAMILIES MEDIAN SALE PRICE +11.2% AVERAGE DAYS ON MARKET -26.1% PENDING SALES -8% 2016 2015 2016 2015 2016 2015 NUMBER OF UNITS SOLD +16.6% 2016 2015 TOTAL INVENTORY -30.3% 2016 2015 10 100 21 UNITS 18 UNITS 1 10 100 46 UNITS 66 UNITS 1000 1000000 $570,000 $512,500 1 10 100 31 DAYS 42 DAYS 10 100 23 UNITS 25 UNITS 536 Main Street, Melrose | 781.979.0100 LeadingEdgeAgents.com Source: MLSPIN via imaxwebsolutions. Single Family for period ending 10/31/16
- 19. OCTOBER 2016 NEWTON SINGLE FAMILIES MEDIAN SALE PRICE +11% AVERAGE DAYS ON MARKET -43% PENDING SALES -33.8% 2016 2015 2016 2015 2016 2015 NUMBER OF UNITS SOLD -17.1% 2016 2015 TOTAL INVENTORY -27.5% 2016 2015 1 10 100 29 UNITS 35 UNITS 1 10 100 197 UNITS 272 UNITS 1000 1000000 $1,085,000 $977,000 1 10 100 41 DAYS 72 DAYS 1 10 100 41 UNITS 62 UNITS 294 Walnut Street, Newton | 617.244.4499 LeadingEdgeAgents.com Source: MLSPIN via imaxwebsolutions. Single Family for period ending 10/31/16
- 20. OCTOBER 2016 READING SINGLE FAMILIES MEDIAN SALE PRICE +1.8% AVERAGE DAYS ON MARKET -17.1% PENDING SALES -22.2% 2016 2015 2016 2015 2016 2015 NUMBER OF UNITS SOLD -10% 2016 2015 TOTAL INVENTORY -23.2% 2016 2015 10 100 18 UNITS 20 UNITS 1 10 100 56 UNITS 73 UNITS 1000 1000000 $471,250 $462,500 1 10 100 29 DAYS 35 DAYS 1 10 100 21 UNITS 27 UNITS 248 Main Street, Reading | 781.944.6060 LeadingEdgeAgents.com Source: MLSPIN via imaxwebsolutions. Single Family for period ending 10/31/16.
- 21. OCTOBER 2016 SOMERVILLE SINGLE FAMILIES MEDIAN SALE PRICE -25.7% AVERAGE DAYS ON MARKET -44.1% PENDING SALES +71.4% 2016 2015 2016 2015 2016 2015 NUMBER OF UNITS SOLD +33.3% 2016 2015 TOTAL INVENTORY +4% 2016 2015 1 10 100 8 UNITS 6 UNITS 10 100 26 UNITS 25 UNITS 1 1000 1000000 $580,000 $780,750 1 10 100 24 DAYS 43 DAYS 1 10 100 12 UNITS 7 UNITS 20 Holland Street, Somerville | 617.623.1140 LeadingEdgeAgents.com Source: MLSPIN via imaxwebsolutions. Single Family for period ending 10/31/16.
- 22. OCTOBER 2016 SOMERVILLE CONDOMINIUMS MEDIAN SALE PRICE +11.1% AVERAGE DAYS ON MARKET -7.1% PENDING SALES +33.3% 2016 2015 2016 2015 2016 2015 NUMBER OF UNITS SOLD -28.5% 2016 2015 TOTAL INVENTORY -1.5% 2016 2015 1 10 100 25 UNITS 35 UNITS 10 100 125 UNITS 127 UNITS 1000 1000000 $600,000 $540,000 10 100 26 DAYS 28 DAYS 1 10 100 44 UNITS 33 UNITS 20 Holland Street, Somerville | 617.623.1140 LeadingEdgeAgents.com Source: MLSPIN via imaxwebsolutions. Condo Trends for period ending 10/31/16.
- 23. OCTOBER 2016 SOMERVILLE MULTI FAMILY MEDIAN SALE PRICE -7.2% AVERAGE DAYS ON MARKET -17% PENDING SALES -6.2% 2016 2015 2016 2015 2016 2015 NUMBER OF UNITS SOLD -25% 2016 2015 TOTAL INVENTORY -42.1% 2016 2015 1 10 100 9 UNITS 12 UNITS 1 10 100 44 UNITS 76 UNITS 1000 1000000 $805,000 $867,500 1 10 100 34 DAYS 41 DAYS 10 100 15 UNITS 16 UNITS 20 Holland Street, Somerville | 617.623.1140 LeadingEdgeAgents.com Source: MLSPIN via imaxwebsolutions. Multi Family Trends for period ending 10/31/16.
- 24. OCTOBER 2016 STONEHAM SINGLE FAMILIES MEDIAN SALE PRICE +35.7% AVERAGE DAYS ON MARKET +83.3% PENDING SALES -4.3% 2016 2015 2016 2015 2016 2015 NUMBER OF UNITS SOLD 0% 2016 2015 TOTAL INVENTORY -27.4% 2016 2015 1 10 100 8 UNITS 8 UNITS 1 10 100 53 UNITS 73 UNITS 1 1000 1000000 $594,500 $438,000 1 10 100 33 DAYS 18 DAYS 10 100 22 UNITS 23 UNITS LeadingEdgeAgents.com Source: MLSPIN via imaxwebsolutions. Single Family for period ending 10/31/16.
- 25. OCTOBER 2016 WAKEFIELD SINGLE FAMILIES MEDIAN SALE PRICE +9.5% AVERAGE DAYS ON MARKET -57.8% PENDING SALES -31.8% 2016 2015 2016 2015 2016 2015 NUMBER OF UNITS SOLD -23.5% 2016 2015 TOTAL INVENTORY -37.1% 2016 2015 1 10 100 13 UNITS 17 UNITS 1 10 100 49 UNITS 78 UNITS 1000 1000000 $448,000 $409,000 1 10 100 32 DAYS 76 DAYS 1 10 100 15 UNITS 22 UNITS 25 Tuttle Street, Wakefield | 781.245.8100 LeadingEdgeAgents.com Source: MLSPIN via imaxwebsolutions. Single Family for period ending 10/31/16.
- 26. OCTOBER 2016 WALTHAM SINGLE FAMILIES MEDIAN SALE PRICE +11.4% AVERAGE DAYS ON MARKET -40% PENDING SALES +14.7% 2016 2015 2016 2015 2016 2015 NUMBER OF UNITS SOLD -9.3% 2016 2015 TOTAL INVENTORY -29% 2016 2015 10 100 29 UNITS 32 UNITS 1 10 100 78 UNITS 110 UNITS 1000 1000000 $523,000 $469,500 1 10 100 27 DAYS 45 DAYS 10 100 39 UNITS 34 UNITS LeadingEdgeAgents.com Source: MLSPIN via imaxwebsolutions. Single Family for period ending 10/31/16.
- 27. OCTOBER 2016 WALTHAM CONDOMINIUMS MEDIAN SALE PRICE +2.3% AVERAGE DAYS ON MARKET -51% PENDING SALES -48.1% 2016 2015 2016 2015 2016 2015 NUMBER OF UNITS SOLD +17.6% 2016 2015 TOTAL INVENTORY -63.1% 2016 2015 10 100 20 UNITS 17 UNITS 1 10 100 31 UNITS 84 UNITS 1000 1000000 $441,250 $431,000 1 10 100 23 DAYS 47 DAYS 1 10 100 14 UNITS 27 UNITS LeadingEdgeAgents.com Source: MLSPIN via imaxwebsolutions. Condo for period ending 10/31/16.
- 28. OCTOBER 2016 WALTHAM MULTI FAMILY MEDIAN SALE PRICE +53.8% AVERAGE DAYS ON MARKET -60.9% PENDING SALES +66.6% 2016 2015 2016 2015 2016 2015 NUMBER OF UNITS SOLD +20% 2016 2015 TOTAL INVENTORY -33.3% 2016 2015 0 1.5 3 4.5 6 6 UNITS 5 UNITS 1 10 100 8 UNITS 12 UNITS 1 1000 1000000 $911,500 $592,351 1 10 100 16 DAYS 41 DAYS 0 1.25 2.5 3.75 5 5 UNIT 3 UNITS LeadingEdgeAgents.com Source: MLSPIN via imaxwebsolutions. Multi Family for period ending 10/31/16.
- 29. OCTOBER 2016 WATERTOWN SINGLE FAMILIES MEDIAN SALE PRICE +25% AVERAGE DAYS ON MARKET -15.2% PENDING SALES 0% 2016 2015 2016 2015 2016 2015 NUMBER OF UNITS SOLD -20% 2016 2015 TOTAL INVENTORY -33.3% 2016 2015 0 1.25 2.5 3.75 5 4 UNITS 5 UNIT 1 10 100 16 UNITS 24 UNITS 1 1000 1000000 $657,500 $526,017 10 100 39 DAYS 46 DAYS 1 10 100 7 UNITS 7 UNITS 142 Galen Street, Watertown | 617.926.5400 LeadingEdgeAgents.com Source: MLSPIN via imaxwebsolutions. Single Family for period ending 10/31/16.
- 30. OCTOBER 2016 WATERTOWN CONDOMINIUMS MEDIAN SALE PRICE +6.8% AVERAGE DAYS ON MARKET -35% PENDING SALES -23% 2016 2015 2016 2015 2016 2015 NUMBER OF UNITS SOLD +15.3% 2016 2015 TOTAL INVENTORY -32.8% 2016 2015 10 100 15 UNITS 13 UNITS 1 10 100 49 UNITS 73 UNITS 1000 1000000 $455,000 $426,000 1 10 100 26 DAYS 40 DAYS 1 10 100 20 UNITS 26 UNITS 142 Galen Street, Watertown | 617.926.5400 LeadingEdgeAgents.com Source: MLSPIN via imaxwebsolutions. Condo Trends for period ending 10/31/16.
- 31. OCTOBER 2016 WATERTOWN MULTI FAMILY MEDIAN SALE PRICE +8.6% AVERAGE DAYS ON MARKET 0% PENDING SALES 0% 2016 2015 2016 2015 2016 2015 NUMBER OF UNITS SOLD 0% 2016 2015 TOTAL INVENTORY -29.4% 2016 2015 0 0.3 0.6 0.9 1.2 2 UNITS 2 UNITS 1 10 100 12 UNITS 17 UNITS 1000 1000000 $692,500 $637,500 1 10 100 49 DAYS 49 DAYS 0 1.25 2.5 3.75 5 5 UNITS 5 UNITS 142 Galen Street, Watertown | 617.926.5400 LeadingEdgeAgents.com Source: MLSPIN via imaxwebsolutions. Multi Family Trends for period ending 10/31/16.
- 32. OCTOBER 2016 WINCHESTER SINGLE FAMILIES MEDIAN SALE PRICE +10% AVERAGE DAYS ON MARKET -39.5% PENDING SALES -15.7% 2016 2015 2016 2015 2016 2015 NUMBER OF UNITS SOLD -47.3% 2016 2015 TOTAL INVENTORY -20.6% 2016 2015 1 10 100 10 UNITS 19 UNITS 1 10 100 77 UNITS 97 UNITS 1000 1000000 $990,000 $900,000 1 10 100 29 DAYS 48 DAYS 10 100 16 UNITS 19 UNITS 2 Mount Vernon Street, Winchester | 781.729.5505 LeadingEdgeAgents.com Source: MLSPIN via imaxwebsolutions. Single Family for period ending 10/31/16.