Trucking Industry Valuation Update Shows Continued Strength
•
1 like•55 views

Bridgepoint Merchant Banking releases an update on the trucking industry, including reporting and insights on valuation cycles and key business considerations.

Recommended
Recommended
More Related Content
Similar to Trucking Industry Valuation Update Shows Continued Strength
Similar to Trucking Industry Valuation Update Shows Continued Strength (20)
More from Bridgepoint Merchant Banking
More from Bridgepoint Merchant Banking (20)
Recently uploaded
Recently uploaded (20)
Trucking Industry Valuation Update Shows Continued Strength
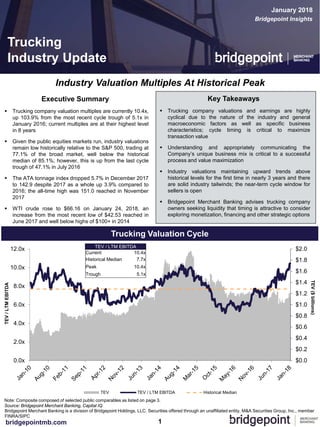
- 1. $0.0 $0.2 $0.4 $0.6 $0.8 $1.0 $1.2 $1.4 $1.6 $1.8 $2.0 0.0x 2.0x 4.0x 6.0x 8.0x 10.0x 12.0x TEV TEV / LTM EBITDA Historical Median 1bridgepointmb.com Note: Composite composed of selected public comparables as listed on page 3. Source: Bridgepoint Merchant Banking, Capital IQ Industry Valuation Multiples At Historical Peak January 2018 Trucking Industry Update Trucking Valuation Cycle Bridgepoint Insights Bridgepoint Merchant Banking is a division of Bridgepoint Holdings, LLC. Securities offered through an unaffiliated entity, M&A Securities Group, Inc., member FINRA/SIPC TEV/LTMEBITDA TEV($billions) Executive Summary Trucking company valuation multiples are currently 10.4x, up 103.9% from the most recent cycle trough of 5.1x in January 2016; current multiples are at their highest level in 8 years Given the public equities markets run, industry valuations remain low historically relative to the S&P 500, trading at 77.1% of the broad market, well below the historical median of 85.1%; however, this is up from the last cycle trough of 47.1% in July 2016 The ATA tonnage index dropped 5.7% in December 2017 to 142.9 despite 2017 as a whole up 3.9% compared to 2016; the all-time high was 151.0 reached in November 2017 WTI crude rose to $66.16 on January 24, 2018, an increase from the most recent low of $42.53 reached in June 2017 and well below highs of $100+ in 2014 Key Takeaways Trucking company valuations and earnings are highly cyclical due to the nature of the industry and general macroeconomic factors as well as specific business characteristics; cycle timing is critical to maximize transaction value Understanding and appropriately communicating the Company’s unique business mix is critical to a successful process and value maximization Industry valuations maintaining upward trends above historical levels for the first time in nearly 3 years and there are solid industry tailwinds; the near-term cycle window for sellers is open Bridgepoint Merchant Banking advises trucking company owners seeking liquidity that timing is attractive to consider exploring monetization, financing and other strategic options TEV / LTM EBITDA Current 10.4x Historical Median 7.7x Peak 10.4x Trough 5.1x
- 2. 40% 50% 60% 70% 80% 90% 100% 110% 120% TEV / LTM EBITDA Trucking vs. S&P 500 Historical Median Trucking Industry Update – January 2018 2bridgepointmb.com Source: Bridgepoint Merchant Banking, Capital IQ TEV / LTM EBITDA – Trucking Sector vs. S&P 500 Key Business Considerations Framing Discussions = Maximizing Value Deliver strong and diverse customer base complementary to acquiror’s existing end market exposure Customer Mix and Related End Markets Minimize the impact of variable fuel costs to the Company’s operations (flat fee, mileage based, etc.) Fuel Cost Allocation Industry-wide driver shortage heightens focus on quality of drivers, driver retention rates and safety history Driver Retention and Fleet Optimization Scale of operations and number of company drivers vs. independent contractors to determine strategic fit Size of Fleet and Driver Type The ELD mandate represents a real value-add for companies who have successfully transitioned and historically utilized electronic logs; potential value adjustment for non-conforming companies Adoption of ELD Technology Enhance acquiror footprint with new lines and / or optimize existing routes to limit / eliminate empty loads (backhaul) Geographic Footprint and Existing Lines Drive synergistic value through complementary or diversifying service offerings and / or economies of scale through consolidation Services Provided / Type of Freight Hauled Business Characteristics Current 77.1% Historical Median 85.1% Premium (Discount) -8.1%
- 3. Trucking Industry Update – January 2018 3bridgepointmb.com Selected Recent Industry Transactions Selected Public Comparables Source: Bridgepoint Merchant Banking, Capital IQ Date Announced Target Country Acquiror Country 01/12/2018 Lone Star Truck Group United States Tag Truck Centers United States 01/02/2018 Washington Glass Hauler United States Daseke, Inc. (NasdaqCM:DSKE) United States 12/05/2017 Tennessee Steel Haulers & Co United States Daseke, Inc. (NasdaqCM:DSKE) United States 12/05/2017 The Roadmaster Group United States Daseke, Inc. (NasdaqCM:DSKE) United States 12/05/2017 Moore Freight Service United States Daseke, Inc. (NasdaqCM:DSKE) United States 11/01/2017 Indiana Transport, Inc. United States Patrick Industries, Inc. United States 10/5/2017 Consolidated Carriers Canada Freight Brokers International Corp Canada 09/18/2017 Celadon – Flatbed Division United States PS Logistics United States 09/05/2017 United Road Services United States The Carlyle Group United States 09/05/2017 R&R Trucking United States Daseke, Inc. (NasdaqCM:DSKE) United States 07/06/2017 Interstate Distributor Co United States Heartland Express, Inc. United States 07/05/2017 The Steelman Companies United States Daseke, Inc. (NasdaqCM:DSKE) United States 05/25/2017 Estenson Logistics, LLC United States Hub Group Trucking, Inc. United States 05/17/2017 Dependable Auto Shippers, Inc. United States CarsArrive Network, Inc. United States 05/09/2017 EXTRA Express Cerritos, Inc. United States St. George Trucking & Warehouse Inc United States 05/01/2017 Big Freight Systems United States Daseke, Inc. (NasdaqCM:DSKE) United States 05/01/2017 The Shilli Companies United States Daseke, Inc. (NasdaqCM:DSKE) United States 03/02/2017 Swift Transportation Company (NYSE:SWFT) United States Knight Transportation, Inc. (NYSE:KNX) United States 02/20/2017 Daseke, Inc. (NasdaqCM:DSKE) United States Initial Public Offering United States 02/18/2017 AsepTrans, LLC United States Odyssey FoodTrans LLC United States 01/20/2017 Wilson Trucking Corporation United States Central Freight Lines, Inc. United States 01/17/2017 Worldwide Express Operations, LLC United States Ridgemont Equity Partners United States 01/09/2017 Fusion Logistics United States Worldwide Express Operations, LLC United States 01/05/2017 C & S Carpet Distribution, Inc. United States Best Logistics Group, Inc. United States 12/29/2016 National Fast Freight Inc. Canada TFI International Inc. (TSX:TFII) Canada 12/22/2016 Blue Sky Logistics LLC and Interide Transport LC United States KM Capital LLC United States 12/29/2016 National Fast Freight Inc. Canada TFI International Inc. (TSX:TFII) Canada ($ in millions, except per share data) 1/25/2018 Equity Enterprise P / E TEV / Revenue TEV / EBITDA TEV / EBIT Company Name Country Share Price Value Value 2017E LTM 2017E 2018E LTM 2017E 2018E 2017E ArcBest Corporation United States $37.75 $976.8 $1,073.9 29.6x 0.4x 0.4x 0.4x 7.0x 7.0x 5.9x 18.3x Celadon Group, Inc. United States 5.73 163.5 537.9 NM 0.5x - - 6.3x - - - Covenant Transportation Group, Inc. United States 28.20 520.4 731.9 33.0x 1.1x 1.0x 1.0x 7.1x 6.7x 5.6x 24.2x Heartland Express, Inc. United States 23.36 1,968.4 1,917.1 43.2x 3.3x 3.0x 2.4x 12.5x 11.2x 9.1x 28.0x J.B. Hunt Transport Services, Inc. United States 124.78 13,790.5 14,861.5 23.8x 2.1x 1.8x 1.7x 14.9x 12.2x 10.9x 18.6x Knight-Swift Transportation Holdings Inc. United States 46.28 8,252.6 9,078.5 - 6.7x 3.7x 1.6x 34.1x 21.9x 10.1x 41.5x Landstar System, Inc. United States 110.80 4,664.5 4,523.9 30.3x 1.3x 1.3x 1.1x 16.4x 16.0x 14.1x 18.7x Marten Transport, Ltd. United States 21.65 1,185.8 1,184.7 35.1x 1.7x 1.7x 1.5x 8.9x 8.2x 7.1x 20.6x Old Dominion Freight Line, Inc. United States 148.02 12,216.4 12,233.3 34.1x 3.8x 3.7x 3.3x 16.4x 15.5x 13.7x 21.0x P.A.M. Transportation Services, Inc. United States 37.33 230.7 359.4 - 0.8x - - 6.9x - - - Patriot Transportation Holding, Inc. United States 18.30 59.5 48.2 - 0.4x - - 4.0x - - - Roadrunner Transportation Systems, Inc. United States 7.52 292.9 692.2 8.6x 0.4x 0.3x 0.3x 6.9x 6.5x 5.8x 10.4x Saia, Inc. United States 78.95 1,965.3 2,092.4 35.5x 1.6x 1.5x 1.4x 12.2x 11.5x 9.6x 21.9x Swift Transportation Co., LLC United States 0.00 0.0 0.0 - - - - - - - - Universal Logistics Holdings, Inc. United States 24.60 703.6 929.6 66.6x 0.8x - - 11.8x - - - USA Truck, Inc. United States 19.89 157.4 278.1 NM 0.7x 0.6x 0.6x 14.1x 10.7x 6.2x NM Werner Enterprises, Inc. United States 41.65 3,034.5 3,098.8 33.7x 1.5x 1.5x 1.4x 9.0x 8.6x 7.5x 21.5x XPO Logistics, Inc. United States 96.74 11,579.5 16,283.2 50.2x 1.1x 1.1x 1.0x 13.4x 11.9x 10.1x 23.6x YRC Worldwide Inc. United States 16.95 571.8 1,352.5 269.3x 0.3x 0.3x 0.3x 5.3x 4.9x 4.0x 11.6x High 269.3x 6.7x 3.7x 3.3x 34.1x 21.9x 14.1x 41.5x Mean 53.3x 1.6x 1.6x 1.3x 11.5x 10.9x 8.5x 21.5x Median 34.1x 1.1x 1.4x 1.3x 10.4x 10.9x 8.3x 21.0x Low 8.6x 0.3x 0.3x 0.3x 4.0x 4.9x 4.0x 10.4x
- 4. Trucking Industry Update – January 2018 4bridgepointmb.com About Us: Combined Experience Contact Us Matt Plooster Managing Principal 402.817.7900 mplooster@bridgepointmb.com Adam Claypool Managing Principal 515.325.7615 aclaypool@bridgepointmb.com Wm. Lee Merritt Managing Principal 402.817.7900 wmerritt@bridgepointmb.com USD99 million Initial public offering Joint Bookrunner USD5.7 billion Buy-side Advisors to private equity consortium on its potential acquisition of Allison Transmission & related financing Financial Advisor USD1.2 billion Buy-side Advisor to Asahi Tec (Chinese automotive supplier) on its acquisition of N.A. automotive supplier Financial Advisor Selected Vehicular Transaction Experience $41 billion in vehicular transaction experience $158+ billion of M&A, capital raising, corporate finance and transaction advisory services experience 43 completed M&A assignments spanning more than $36 billion 75 completed corporate finance transactions, raising more than $74 billion in capital 51 completed advisory assignments spanning more than $48 billion 117+ years cumulative investment banking & private equity experience Principals currently sit on 11 Boards USD375 million Senior secured credit facilities/senior notes Joint Bookrunner USD811 million Acquisition advisory and financing Financial Advisor Gary Grote Managing Principal 402.817.7900 ggrote@bridgepointmb.com James Mackay Managing Principal 515.325.7615 jmackay@bridgepointmb.com Omaha Office 450 Regency Parkway Suite 300 Omaha, NE 68114 Lincoln Office 816 P Street Suite 200 Lincoln, NE 68508 Des Moines Office 700 Locust Street Suite 203 Des Moines, IA 50309 Denver Office 1010 Depot Hill Road Suite 206 Broomfield, CO 80020 Geographic Focus Area Mike Anderson Managing Principal 402.817.7902 manderson@bridgepointmb.com The list contained herein represents selected transactions completed by Bridgepoint principals while associated with Bridgepoint Merchant Banking, as well as securities transactions on which they advised in their capacity as investment bankers registered with various broker-dealers.