Bridgepoint Insights: Physical Therapy
•
0 likes•60 views

Bridgepoint Merchant Banking's newest industry update on the physical therapy industry, including reporting and insights on current market trends and selected industry transactions.

Recommended
Recommended
More Related Content
Similar to Bridgepoint Insights: Physical Therapy
Similar to Bridgepoint Insights: Physical Therapy (20)
More from Bridgepoint Merchant Banking
More from Bridgepoint Merchant Banking (20)
Recently uploaded
Recently uploaded (20)
Bridgepoint Insights: Physical Therapy
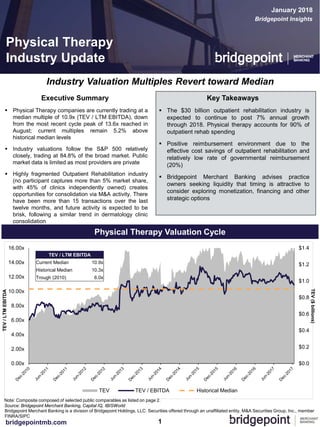
- 1. $0.0 $0.2 $0.4 $0.6 $0.8 $1.0 $1.2 $1.4 0.00x 2.00x 4.00x 6.00x 8.00x 10.00x 12.00x 14.00x 16.00x TEV TEV / EBITDA Historical Median 1bridgepointmb.com Note: Composite composed of selected public comparables as listed on page 2. Source: Bridgepoint Merchant Banking, Capital IQ, IBISWorld Industry Valuation Multiples Revert toward Median January 2018 Physical Therapy Industry Update Physical Therapy Valuation Cycle Bridgepoint Insights Bridgepoint Merchant Banking is a division of Bridgepoint Holdings, LLC. Securities offered through an unaffiliated entity, M&A Securities Group, Inc., member FINRA/SIPC TEV/LTMEBITDA TEV($billions) TEV / LTM EBITDA Current Median 10.9x Historical Median 10.3x Trough (2010) 6.0x Executive Summary Physical Therapy companies are currently trading at a median multiple of 10.9x (TEV / LTM EBITDA), down from the most recent cycle peak of 13.6x reached in August; current multiples remain 5.2% above historical median levels Industry valuations follow the S&P 500 relatively closely, trading at 84.8% of the broad market. Public market data is limited as most providers are private Highly fragmented Outpatient Rehabilitation industry (no participant captures more than 5% market share, with 45% of clinics independently owned) creates opportunities for consolidation via M&A activity. There have been more than 15 transactions over the last twelve months, and future activity is expected to be brisk, following a similar trend in dermatology clinic consolidation Key Takeaways The $30 billion outpatient rehabilitation industry is expected to continue to post 7% annual growth through 2018. Physical therapy accounts for 90% of outpatient rehab spending Positive reimbursement environment due to the effective cost savings of outpatient rehabilitation and relatively low rate of governmental reimbursement (20%) Bridgepoint Merchant Banking advises practice owners seeking liquidity that timing is attractive to consider exploring monetization, financing and other strategic options
- 2. 0% 20% 40% 60% 80% 100% 120% 140% Public Comparables TEV / EBITDA as % of S&P 500 Historical % of S&P 500 Physical Therapy Update – January 2018 Selected Recent Industry Transactions 2bridgepointmb.com Selected Public Comparables Source: Bridgepoint Merchant Banking, Capital IQ TEV / LTM EBITDA – Physical Therapy Sector vs. S&P 500 Strategic 67% Private Equity 33% Current 84.8% Historical Median 99.2% Premium (Discount) -14.4% ($ in millions, except per share data) 12/27/2017 Equity Enterprise P / E TEV / Revenue TEV / EBITDA TEV / EBIT Company Name Country Share Price Value Value 2017E LTM 2017E 2018E LTM 2017E 2018E 2017E U.S. Physical Therapy, Inc. United States 71.25 896.4 1,039.5 34.4x 2.7x 2.5x 2.4x 16.9x 18.0x 15.9x 19.2x Acadia Healthcare Company, Inc. United States 32.45 2,850.8 6,062.8 14.5x 2.2x 2.1x 2.0x 10.6x 10.1x 9.4x 14.0x The Ensign Group, Inc. United States 21.93 1,122.2 1,375.8 15.7x 0.8x 0.8x 0.7x 10.6x 8.1x 7.1x 11.0x Select Medical Holdings United States 17.25 2,308.5 5,730.7 20.3x 1.3x 1.3x 1.2x 11.2x 10.7x 9.8x 15.6x BioScrip, Inc. United States 2.82 359.6 884.6 NM 1.0x 1.1x 1.2x 25.0x 20.6x 14.1x NM Civitas Solutions, Inc. United States 17.40 651.5 1,275.8 22.8x 0.9x 0.8x 0.8x 8.6x 7.4x 7.0x 15.4x High 34.4x 2.7x 2.5x 2.4x 25.0x 20.6x 15.9x 19.2x Mean 21.5x 1.5x 1.4x 1.4x 13.8x 12.5x 10.5x 15.0x Median 20.3x 1.2x 1.2x 1.2x 10.9x 10.4x 9.6x 15.4x Low 14.5x 0.8x 0.8x 0.7x 8.6x 7.4x 7.0x 11.0x Physical Therapy Date Target Country Acquiror Buyer Type 11/13/2017 Physical Therapy In Motion United States Proex Physical Therapy Strategic 10/09/2017 Excel Physical Therapy (Omaha) United States Athletico Physical Therapy Strategic 10/04/2017 Armada Physical Therapy Of Albuquerque United States Physical Rehabilitation Netw ork Strategic 08/24/2017 Back in Motion Physical Therapy United States GPB Capital Holdings Private Equity 08/24/2017 Rehab Access, Inc. United States GPB Capital Holdings Private Equity 08/23/2017 Medicomp, Inc. United States Interstate Rehab Strategic 04/19/2017 Care New England Health System Inc. United States Partners Innovation Management Strategic 04/05/2017 Tidew ater Physical Therapy, Inc. United States PTN Strategic 03/29/2017 Dynamic Physical Therapy & Aquatic Rehabilitation United States PTN Strategic 03/22/2017 ProCare Physical Therapy, Inc. United States PTN Strategic 01/09/2017 Invo HealthCare Associates, Inc. United States The Wicks Group of Companies Private Equity 01/04/2017 Care Advantage, Inc. United States BelHealth Investment Partners Private Equity 12/27/2016 NLJ Physical Therapy P.C. United States Bellin Health Systems, Inc. Strategic 12/19/2016 Professional Physical Therapy United States Thomas H. Lee Partners, L.P. Private Equity 12/19/2016 Corporate Health Center United States Concentra, Inc. Strategic 12/06/2016 Tw in Cities Occupational Health & Rehabilitation United States U.S. Healthw orks, Inc. Strategic 11/29/2016 Great Lakes Home Health Services, Inc. United States Blue Wolf Capital Partners Private Equity 10/31/2016 Carolina Physical Therapy Associates United States CORA Health Services, Inc. Strategic
- 3. 3bridgepointmb.com About Us: Combined Experience Contact Us Matt Plooster Managing Principal 402.817.7900 mplooster@bridgepointmb.com Adam Claypool Managing Principal 515.325.7615 aclaypool@bridgepointmb.com Wm. Lee Merritt Managing Principal 402.817.7900 wmerritt@bridgepointmb.com Selected Bridgepoint Transaction Experience $158+ billion of M&A and capital raising experience 43 completed M&A assignments spanning more than $36 billion 75 completed corporate finance transactions, raising more than $74 billion in capital 117+ years cumulative investment banking & private equity experience Principals currently sit on 11 Boards 18 Investment bankers and professionals focused on Midwest companies Gary Grote Managing Principal 402.817.7900 ggrote@bridgepointmb.com James Mackay Managing Principal 515.325.7615 jmackay@bridgepointmb.com Omaha Office 10250 Regency Circle Suite 110 Omaha, NE 68114 Lincoln Office 816 P Street Suite 200 Lincoln, NE 68508 Des Moines Office 700 Locust Street Suite 203 Des Moines, IA 50309 Denver Office 1010 Depot Hill Road Suite 206 Broomfield, CO 80020 Geographic Focus Area Mike Anderson Managing Principal 402.817.7900 manderson@bridgepointmb.com Physical Therapy Update – January 2018 USD811 million Acquisition advisory and financing Financial Advisor USD20 million Preferred stock offering Sole Bookrunner USD266 million Exit financing facilities Sole Bookrunner USD17 million Sell-side advisory on sale to Beacon Roofing Supply, Inc. Sole Financial Advisor Not Disclosed Buy-side Advisor on acquisition of Bank of Nebraska Financial Advisor Not Disclosed Buy-side M&A advisory (Not Completed) Financial Advisor Business Services Company USD50+ million Sell-side advisory Financial Advisor Not Disclosed Sell-side Advisor to Austin Complete Nutrition Sole Financial Advisor Biopharmaceutical Company USD20+ million Sell-side advisory Sole Financial Advisor Not Disclosed Sell-side advisory on sale to publicly-traded cross- border strategic Sole Financial Advisor The list contained herein represents selected transactions completed by Bridgepoint principals while associated with Bridgepoint Merchant Banking, as well as securities transactions on which they advised in their capacity as investment bankers registered with various broker-dealers.