SlideShare a Scribd company logo
1 of 77
Download to read offline
EFFECTS OF WEANING AGE ON BODY COMPOSITION AND GROWTH
OF EX SITU CALIFORNIA SEA LION (Zalophus californianus) PUPS
by
BRANDON TYLER DAVIS
B.S. Davidson College, 1997
A thesis submitted in partial fulfillment of the requirements
for the degree of Master of Science
in the Department of Biology
in the College of Sciences
at the University of Central Florida
Orlando, Florida
Summer Term
2014
Major Professor: Graham A. J. Worthy
ii
©2014 Brandon Tyler Davis
iii
ABSTRACT
Pinnipeds exhibit a wide range of lactation strategies that vary from just a few days to
nearly three years in duration. Phocids have a relatively short, intense nursing period culminating
in weaning after just a few days or weeks, while dependent otariids generally take several
months of consuming a combined milk and solid food diet before being completely from the
dam. The transition to nutritional independence can be particularly challenging for newly
weaned pups, which must adjust to behavioral, physiological and nutritional changes as a milk
diet is replaced with solid food. An interruption in energy resources during this formative stage
could result in a prioritization away from growth, maintenance, or activity resulting in
suboptimal development.
Three groups of ex situ California sea lion (Zalophus californianus) pups were examined
during the initial period of independence after they were weaned at approximately five (Group
1), seven (Group 2), and nine months of age (Group 3). Absolute growth rates of pups were
calculated and changes in body composition were estimated using blubber depth measurements
and deuterium oxide dilution to determine if weaning age had an effect on subsequent pup
development and growth. Blood urea nitrogen and blood glucose levels were observed for their
response to changes in body condition, while thyroid hormone levels in the blood were examined
as a possible nutritional stress indicator during the pup’s transition to solid food.
For contextual perspective, the initial measurements of the five month old and nine
month old ex situ pups in this project were compared to same age in situ pups measured on San
Nicolas Island, CA and Año Nuevo Island, CA. The five month old ex situ pups (Group 1) in the
present study were significantly larger with greater body mass (39.6 ± 1.6 kg, p< 0.01), axillary
iv
girth (85.3 ± 2.9 cm, p< 0.01), and axillary blubber depth (2.3 ± 0.1 cm, p< 0.01) compared to 5
month old in situ pups (26.6 ± 5.2 kg / 70.6 ± 5.34 cm / 1.5 ± 0.2 cm). Although nine month old
ex situ pups (Group 3) in the present study did not differ significantly from the same age in situ
pups in body mass, ex situ pups had significantly greater axillary blubber depth (3.7 ± 0.9 cm, p<
0.01) and total body lipid percentage (24.9 ± 4.7%, p= 0.01) than in situ pups (1.5 ± 0.2 cm /
17.1 ± 4.9%).
Examining differences between age groups in the present study, Group 1 pups initially
had significantly smaller overall average blubber depth (2.6 ± 0.9 cm) compared to Group 2 pups
(4.4 ± 0.6 cm, p= 0.02) and Group 3 pups (4.4 ± 0.8 cm, p= 0.03). As Group 1 pups progressed
through the transition period to solid food consumption, they experienced a significantly greater
amount of mean mass loss (-8.5 ± 1.6 kg) compared to Group 3 pups (-6.1 ± 1.1 kg, p= 0.04),
and greater percentage of mass loss (-21.5 ± 3.3%) compared to the Group 3 pups (-15.6 ± 3.6%,
p= 0.04). The loss of mass was evident as the Group 1 pups lost more girth in the umbilical (-
11.2 ± 1.8 cm) and hip (-14.2 ± 3.3 cm) locations than both Group 2 umbilical (-7.5 ± 0.5 cm, p=
0.01) and hip (-7.2 ± 1.5 cm, p= 0.01) locations as well as Group 3 umbilical (-4.2 ± 2.6 cm, p<
0.01) and hip (-2.3 ± 3.1 cm, p< 0.01) locations. Group 1 pups also took significantly longer
(31.7 ± 1.2 d) to reverse mass loss and begin the recovery phase of growth and development
compared to Group 2 (24.3 ± 4.5 d, p= 0.03) and Group 3 pups (20.7 ± 4.0, p< 0.01). However,
despite losing the greatest amount of mass, pups in Group 1 experienced a significantly greater
change in overall blubber depth (+1.6 ± 0.9 cm) compared to Group 2 (-0.3 ±0.9 cm, p= 0.03)
and Group 3 pups (-0.4 ± 0.2 cm, p<. 0.01).
v
Group 3 began the transition to solid food with a significantly higher percentage of total
body lipid (24.9 ± 4.7%) compared to the younger Group 1 (12.5 ± 4.3%, p=0.01) and Group 2
pups (14.1 ± 2.0%, p=0.01), and began voluntary consumption of the novel solid fish diet in a
significantly shorter amount of time (16.3 ± 0.6 d) than the younger Group 1 (21.7 ± 1.5 d, p<
0.01) and Group 2 pups (21.0 ± 1.7 d, p< 0.01). During the recovery period Group 3 pups also
had the greatest absolute mass increase (n= 2, +12.4 ± 4.3 kg) and rate of mass increase (+0.4 ±
0.1 kg d-1
), significantly greater than Group 2 pups (+5.0 ± 1.2 kg, p= 0.03 / +0.2 ± 0.0 kg d-1
,
p= 0.02 ). Blood glucose and urea nitrogen levels largely fell within previously observed normal
ranges and did not correlate with shifts in body mass (r= 0.19, r= -0.55), total body protein (r=
0.06 , r= -0.38), or total body lipid percentages (r= 0.24, r= -0.32). Thyroid hormone analysis
revealed a weak correlation between total T4 levels and body mass fluctuation (r= 0.52).
Although all pups in the present study survived the transition to solid food, there were
apparent differences in how the different age groups responded physiologically. The youngest
Group 1 pups began the switch to solid food with the lowest overall blubber depth and
experienced the greatest change in body mass and composition, while older Group 3 pups
entered the transition with more energy reserves and were able to utilize those reserves more
efficiently to minimize loss and promote faster growth. From the present study there is a
suggestion that California sea lion pups benefit physiologically from the extended nursing period
and older weaning age that is natural for otariids. Several factors such as staffing, logistics, and
safety may affect the timing of pup weaning within ex situ population management of sea lion
pups. However, if the driving factor is the ease at which the transition can be made and the
overall health of the animal, the results of the present study revealed a potential benefit to
weaning at approximately nine months of age. Likewise, these results could prove beneficial
vi
during the observation of in situ sea lion pups and their response to external pressures that affect
weaning age.
vii
I would like to dedicate this paper
to my mother, who always reminded me to stay focused;
to my wife and family, who really sacrificed the most so that I could entertain this curiosity,
and of course to my study subjects, the sea lion pups, who probably wondered why this goofy
guy was looking at them so intently.
and
In remembrance of Stephanie E. James.
viii
ACKNOWLEDGMENTS
As this project has taken several years to finally come to completion, it would not have
been possible if not for the generous support of numerous individuals. First, I would like to thank
Dr. Graham Worthy for giving me the opportunity to collaborate with him. His patience with me
was incredible as I was faced with many challenges over the years. A special thanks goes to the
rest of my advisory committee including Dr. C. Ross Hinkle for joining the team midstream and
providing some much needed moral support and guidance. I would like to also acknowledge the
encouragement I received from committee-member Dr. Elizabeth Chittick-Nolan and Reid
Miller to investigate further and possibly advance our knowledge of sea lion weaning. If it
wasn’t for them, I don’t think I would have entertained the thought of going back to school while
working. Sometimes it just takes a little push to help someone to pursue a dream. A huge thanks
to Mr. Vu “Tom” Nguyen whose statistical assistance ultimately made it all possible when it
looked like this thesis was never going to get finished. I would like to send my thanks to Bill
Hughes, Todd Coffman, and the Zoological staffs at SeaWorld Orlando for allowing me to
accompany their husbandry of the sea lion pups and for accommodating my requests for
samples. Without their support, this project would not have been possible. A big thank you also
goes to Cathy Perry and the SeaWorld veterinary staff for being so helpful and accommodating
as I interrupted their daily routine using their equipment and supplies for blood sample
preparation. I also appreciate the in-kind support and experienced gained from Michael Jacobasz
and the nutrition lab at the Smithsonian National Zoo which helped me to better understand the
deuterium oxide dilution process. The generosity and hospitality of the Bryce Family was also
amazing as they accepted me into their home when I needed a place to stay while in Washington
DC. Thank you so much for your kindness! I am also very thankful for the funding and support
ix
received from the International Marine Animal Trainers Association (IMATA) through their
Conservation Research Grant. IMATA’s interest in this paper helped to validate my feelings of
its potential importance to the zoological and wildlife rehabilitative communities. But most of
all, I want to thank my loving and supportive family - especially my wife, who I had to lean on
quite a bit and who never asked for anything in return. I love and appreciate you so very much
and hope that someday I may be able to return the favor.
x
TABLE OF CONTENTS
LIST OF FIGURES .................................................................................................................. xi
LIST OF TABLES................................................................................................................... xii
LIST OF ACRONYMS AND ABBREVIATIONS ................................................................. xiii
INTRODUCTION ......................................................................................................................1
MATERIALS AND METHODS...............................................................................................14
Location and Subjects ...........................................................................................................14
Experimental Design .............................................................................................................15
Sample Analysis....................................................................................................................20
Body Composition ................................................................................................................21
Statistical Analyses ...............................................................................................................23
RESULTS.................................................................................................................................24
Initial Parameters ..................................................................................................................24
Transition Period...................................................................................................................31
Recovery Period....................................................................................................................42
Other Variables .....................................................................................................................45
DISCUSSION...........................................................................................................................47
CONCLUSION.........................................................................................................................57
LIST OF REFERENCES ..........................................................................................................59
xi
LIST OF FIGURES
Figure 1: Ultrasound measurements were taken in triplicate at six locations on the body: dorsal
axillary, lateral axillary, dorsal umbilical, lateral umbilical, dorsal hips and lateral hips.
Photo credit: Brandon Davis ..........................................................................................17
Figure 2: Changes in individual blood glucose values over time. Pups #71, #00, #60 weaned at 5
mo. (Group 1), pups #11, #19, #38 weaned at 7 mo. (Group 2), and pups #27, #65, #20
weaned at 9 mo. (Group 3).............................................................................................36
Figure 3: Changes in individual blood urea nitrogen values over time. Pups #71, #00, #60
weaned at 5 mo. (Group 1), pups #11, #19, #38 weaned at 7 mo. (Group 2), and pups
#27, #65, #20 weaned at 9 mo. (Group 3). .....................................................................37
Figure 4: Changes in individual total thyroxine (tT4) hormone levels over time. Pups #71, #00,
#60 weaned at 5 mo. (Group 1), pups #11, #19, #38 weaned at 7 mo. (Group 2), and
pups #27, #65, #20 weaned at 9 mo. (Group 3). .............................................................38
Figure 5: Changes in individual total triiodothyronine (tT3) hormone levels over time. Pups #71,
#00, #60 weaned at 5 mo. (Group 1), pups #11, #19, #38 weaned at 7 mo. (Group 2), and
pups #27, #65, #20 weaned at 9 mo. (Group 3). .............................................................39
Figure 6: Changes in individual free thyroxine (fT4) hormone levels over time. Pups #71, #00,
#60 weaned at 5 mo. (Group 1), pups #11, #19, #38 weaned at 7 mo. (Group 2), and
pups #27, #65, #20 weaned at 9 mo. (Group 3). .............................................................40
Figure 7: Changes in individual free triiodothyronine (fT3) hormone levels over time. Pups #71,
#00, #60 weaned at 5 mo. (Group 1), pups #11, #19, #38 weaned at 7 mo. (Group 2), and
pups #27, #65, #20 weaned at 9 mo. (Group 3). .............................................................41
Figure 8: Body mass data of estimated 5, 9, 10, and 13 month old in situ California sea lion
(Zalophus californianus) pups from San Nicolas Island and Aňo Nuevo Island (1988-
1991) (Worthy and Costa, unpublished data). ................................................................51
xii
LIST OF TABLES
Table 1: Initial, transition, and final recovery girth measurements (cm) at the axillary, umbilical
and hip locations along the sea lion trunk.......................................................................25
Table 2: Initial, post-transition, and final recovery blubber depth measurements (cm) at the
axillary (dorsal and lateral), umbilical (dorsal and lateral) and hip (dorsal and lateral)
locations along the sea lion trunk...................................................................................27
Table 3: Initial and post-transition thyroid hormone measurements for total thyroxine (tT4; nmol
L-1
), total triiodothyronine (tT3; nmol L-1
), free thyroxine (fT4; ρmol L-1
), and free
triiodothyronine (fT3; ρmol L-1
).....................................................................................30
Table 4: The initial measurements of body mass (kg), axillary girth (cm), axillary blubber depth
(cm), and total body lipid percentage for this project’s ex situ sea lion pups (5mo and
9mo) compared to same-aged in situ pup data from San Nicolas Island (SNI) and Aňo
Nuevo Island (ANI) (1988–1991) (Worthy and Costa, unpubl. data)..............................50
xiii
LIST OF ACRONYMS AND ABBREVIATIONS
BMR Basal Metabolic Rate
BUN Blood Urea Nitrogen
CSL California sea lion
fT3 Free Triiodothyronine
fT4 Free Thyroxine
kg Kilogram
kJ Kilojoule
LBM Lean Body Mass
MSRML Mass Specific Rate of Mass Loss
NOAA National Oceanic and Atmospheric Administration
SSC Species Survival Commission
tT3 Total Triiodothyronine
tT4 Total Thyroxine
TBL Total Body Lipid
TBM Total Body Mass
TBP Total Body Protein
TBW Total Body Water
TSH Thyroid Stimulating Hormone
UME Unusual Mortality Event
1
INTRODUCTION
Weaning is a uniquely mammalian event that involves the transition of young from their
natal diet to the diet they will consume as adults. Though natural, this transition to nutritional
independence can be particularly challenging for newly weaned mammals, which must adjust to
behavioral, physiological and nutritional changes as the milk diet is replaced with solid food (e.g.
Reiter, et al. 1978; Galef, Jr., 1981; Martin, 1984). The nutrient-rich easily-assimilated milk that
has thus far been vital to their proper development and overall health gives way to a food source
that requires considerably more effort to acquire and digest - at a time when rapid growth is
occurring and any interruption in nutrition could be detrimental. For the young, food intake is
important as any reduction in energy requires a prioritization between growth, maintenance and
activity (e.g. Hill et al., 2004; Hoopes 2007). For the mother, milk production represents her
largest energetic investment to her offspring as she quickly shifts her energy reserves to feed her
young and improve its chances of survival (e.g. Arnould and Hindell, 2002). As each day passes,
her offspring’s growing demand for milk further depletes her energy resources. The faster the
female can finish lactation and successfully wean her offspring, the less of an energy deficit she
will incur, and the sooner she will be prepared for her next offspring. For this reason, various
lactation strategies have evolved among mammals, as the energy requirements of the mother are
balanced with the energy requirements of her offspring.
Pinnipeds, a monophyletic group in the Order Carnivora that includes the Families
Phocidae (true seals), Otariidae (sea lions and fur seals), and Odobenidae (walrus), are semi-
aquatic fin-footed animals that give birth on land or ice but forage at sea. They exhibit a wide
2
range of lactation strategies with weaning occurring after as few as 4 days in the hooded seal
(Phocidae: Cystophora cristata) to as long as 3 years in the Galapagos fur seal (Otariidae:
Arctocephalus galapagoensis) (e.g. Oftedal et al., 1987a; Shulz and Bowen, 2005). Despite this
range of lactation strategies, which include a variety of nursing intervals and weaning ages,
members of each of the three pinniped families share certain characteristics. Phocids, or true
seals, are generally found in the colder waters of the sub-polar to temperate regions with many
species giving birth on the ever-changing landscape of landfast or pack ice. Female phocids,
considered classic examples of capital breeders, tend to spend months building up energy
reserves on feeding grounds that may be thousands of kilometers away from birthing areas (e.g.
Oftedal et al., 1987; Boness and Bowen, 1996). The thick energy-rich blubber layer accumulated
from this feeding strategy becomes an investment to future offspring. The ability to mobilize
these lipid stores to produce milk that is comprised of as much as 40-60% fat (e.g. Iverson et al.,
1993) enables pup growth of as much as 7 kg per day (e.g. Iverson et al., 1993). This extremely
lipid-rich milk composition allows a pup to store large amounts of nutrients quickly, facilitating
an exceptionally short lactation period (4–45 d) where the pup is weaned and independent just
days to weeks after birth (e.g. Worthy and Lavigne, 1983; Mellish et al., 1999). Because of her
extensive blubber layer and this ability to rapidly transfer that energy to her pup, the mother is
able to fast for the entire duration of nursing. Likewise, the newly independent pup will fast and
depend on these stored energy reserves from milk consumption for several months as it learns to
forage effectively. As a result, this phocid lactation strategy has been referred to as a fasting
strategy (e.g. Shulz and Bowen, 2005).
3
In contrast, the walrus, the only extant species in the Odobenidae family, exhibits a much
longer lactation period with its aquatic nursing strategy (e.g. Shulz and Bowen, 2005). Like the
many phocids that live in colder sub-polar zones, walrus mothers accumulate large amounts of
blubber before giving birth on ice (e.g. Boness and Bowen, 1996); however they fast for only a
few days while nursing before heading out to sea to forage. Unlike phocids, walrus calves are
precocial and able to remain with their mothers on foraging trips at a very young age. As a unit
they are more mobile throughout the lactation period than other pinnipeds and are one of the few
species that will nurse while swimming. Walrus milk is relatively low in fat content (~30%)
compared with other sub-polar pinnipeds (e.g. Boness and Bowen, 1996). After several months
the calves learn from their mothers to supplement their diet with mollusks and other
invertebrates, and will consume this mixed diet of milk and solid food from about 6 months of
age until weaning which generally occurs after 1.5 to 3 years (e.g. Riedman, 1990). This
transition to nutritional independence is not as abrupt in walrus as in phocids.
Otariids combine aspects of the lactation strategies exhibited by phocids and walrus into
a foraging-cycle strategy (e.g. Shulz and Bowen, 2005), where the mother alternates nursing
periods with foraging trips to sea without her pup. With few exceptions, otariids inhabit more
temperate and tropical locales than walrus or phocids, and give birth on beaches or rocky
shorelines. Fur seal and sea lion mothers lack the energy reserves found in the thick blubber
layer of the true seals and walrus, and are thus considered income breeders which have to
regularly replenish their reserves during the lactation period through an alternating cycle of
nursing and foraging. After birth, mothers will generally spend the first week nursing their pups
4
before leaving to forage; with trips lasting from 1-2 d in California sea lions to as long as 12 d in
Juan Fernandez fur seals (e.g. Francis et al., 1998). Since, unlike phocids, otariids do not
accumulate significant energy reserves prior to birth; a reduced food supply in an area can result
in longer duration trips to sea (e.g. Georges and Guinet, 2000). Under such conditions pups will
endure extended periods without milk, and since pups are fasting for the duration of their
mother’s trip to sea, this can have significant implications for survival. Otariid milk is relatively
lower in fat content (~20-35%) relative to phocids and weaning generally occurs between four
months and three years (e.g. Gentry and Kooyman, 1986). Prior to weaning, pups begin to play
with fish and eventually become proficient at hunting by the time of weaning (e.g. Peterson and
Bartholomew, 1967; Odell, 1972). Unlike phocids, there is no fasting associated with the post
weaning period in otariid species.
The California sea lion (Zalophus californianus) is an otariid species that inhabits the
Pacific coastline of North America from the southern tip of Baja California, Mexico into British
Columbia, Canada with a total population estimated at 300,000 individuals (e.g. NMFS, 2011).
They are one of the most prolific pinnipeds in aquariums and zoological facilities worldwide
(e.g. Martin, 1984; Orr and Helm, 1989; Oftedal, 2000; IMATA, 2011). The species is highly
sexually dimorphic with adult males being much larger (200-455 kg) than females (50-110 kg)
and having a prominent thick neck and characteristic domed or crested head. The species is
polygynous, with males defending territories at breeding rookeries from May through August.
Sea lion males establish these waterside territories along the beaches of coastal islands and
mainland shorelines of the Pacific coast. Entering into the breeding season, a male’s neck
5
becomes more prominent as a thick layer of subcutaneous fat provides additional energy stores
as well as protection during breeding competition. Males will refrain from foraging for several
days to weeks (up to 45 d) to optimize their chances of breeding, and after the season provide
very limited paternal support to the pups. Females give birth on the beach and will spend the
initial 5-8 days with the pup nursing before leaving to forage for 2-3 day periods (e.g. Heath et
al., 1991). Adult sea lions feed primarily on various species of fish and squid close to shore but
have been known to travel as much as 450 km off-shore when resources are scarce (e.g. Weise
et al., 2006). Each time the female returns to her pup to nurse she will stay for 1-2 days and fast
during that period. California sea lion milk contains an average of 20-30% fat (e.g. Gentry and
Kooyman, 1986; Oftedal et al., 1987a) which is leaner than most other otariids. California sea
lion pup weaning occurs after approximately nine to ten months, though pups may begin playing
with and ingesting fish as early as six months of age (e.g. Odell, 1972). Like other otariids,
weaning generally occurs when mothers leave their offspring on a foraging trip and do not
return. When there are declines in prey availability, juvenile pinnipeds often suffer the
consequences as mothers must prioritize their own survival before that of their offspring.
Several factors have been hypothesized to drive the variable nursing intervals and
weaning times in pinnipeds including maternal body size, breeding substrate, prey availability,
maternal energy stores, milk content, milk production rate, latitudinal variations,
thermoregulation requirements, environmental perturbations, and neonate mass (e.g. Gentry and
Kooyman, 1986; Gittleman and Oftedal, 1987; Partridge and Harvey, 1988; Lea and Hindell,
1997; Costa, 1993; Boness and Bowen, 1996; Francis et al., 1998; Boyd, 1999; Lydersen and
6
Kovacs, 1999; Georges and Guinet 2000; Arnould and Hindell, 2002; Rutishauser et al. 2004;
Shulz and Bowen, 2005). Regardless of the driver, nursing intervals and the subsequent weaning
times have a tremendous effect on the resulting blubber layer of the mothers. Though their
blubber stores serve as an investment to the survival of their future offspring and can be used as
energy stores and metabolized, they are often needed as insulation against the elements.
Pinnipeds are susceptible to the higher heat transfer rate of water which can make
thermoregulation paramount in the marine environment; with pups particularly susceptible due to
their smaller size and reduced lipid reserves (e.g. Hoopes, 2007). Any environmental variability
that affects nursing intervals and weaning times can affect the survival and natality of the species
(e.g. Soto et al., 2004).
Ten species of pinnipeds are currently listed as “at risk” by the International Union for
Conservation of Nature (IUCN) with many facing challenges such as human-induced climate
change, fisheries interactions and over-exploitation(e.g. Kovacs, 2011). Though the California
sea lion population is currently considered stable and not one of the ten listed IUCN at-risk
pinniped species, they are affected by these same challenges and their response to them can help
us better understand the impacts of such environmental dynamics on pinniped populations.
During years of reduced prey availability, California sea lion males have ventured to northern
waters to find better resources, while females have tended to remain with their pups at the
breeding sites despite resources being limited (e.g. Weise et al., 2006). The pups are often the
most affected under such conditions as mothers are forced to forage farther and longer out at sea,
leading many to choose to abandon their pups as they place priority on their own survival.
7
Shifting prey availability is one possible explanation (e.g. Westberg, pers. comm.) currently
being examined as a cause for the 2013 unusual mortality event (UME) involving California sea
lion pups along the Pacific coast of the United States that has resulted in a three-fold increase in
pup strandings (e.g. HSWRI, 2014). Abandoned or stranded pups are often forced to adapt
quickly to survive. They must recognize a completely new food source and learn to capture and
consume it before their energy reserves become severely depleted. If too young to realize where
sustenance may be found, sea lion pups can become malnourished and die on beaches. This
instability in situ often necessitates the need for ex situ assistance. Wildlife rescue facilities have
been successful at rehabilitating young stranded pups which generally involves the weaning of
the pups onto their adult fish-based diet (e.g. Westberg, pers. comm.). A necessary responsibility
for rescue and rehabilitation facilities is not only the stabilization of the health of the pup, but
also the determination whether that pup is likely fit to survive on its own when returned to the
wild (e.g. Lander and Gulland, 2003).
Many of these wildlife rescue facilities are also zoological facilities and experience this
same weaning transition within their own populations of ex situ pinnipeds. The goal of most
zoological facilities is to provide the best possible care for their animals, and one way of doing
that is to recreate a natural environment for the animals. Zoological settings however, are limited
in terms of size and capabilities. With marine mammal exhibits, this often means the exclusion
of other marine life such as fish, squid and crustaceans, the natural prey of these animals. This is
a potential drawback during the weaning process for young pinniped as they are unable to
experiment with live prey as they would in the wild. In many zoological facilities, pinniped pups
8
are often separated from their mothers to facilitate weaning, and fed a diet of whole fish. For
seals, this sudden transition from a milk diet to fish diet is similar to what happens naturally
when their mothers leave; however, free-ranging sea lions are naturally weaned after fish is
already a major part of their diet (e.g. Odell, 1972; Trites et al., 2006).
For a variety of reasons, the timing of this weaning process has varied between
institutions with potential safety concerns for both zoological personnel and the individual
animal being factors under consideration. On rare occasions, circumstances have required a very
early transition to solid food as in a case where a California sea lion pup was successfully
transitioned at six weeks old (e.g. Kastelein et al., 2000) after its mother unexpectedly passed
away. This latter situation is similar to what occurs in many rescue facilities when young pups
are rescued. Though sea lion pups have been successfully weaned through this process for many
years, potential physiological impacts on the pups are unknown and it is critical to better
understand the impacts that early weaning may have on overall growth and development.
The digestive systems of many species commonly undergo programmed development
changes between birth and adulthood (e.g. Hill et. al., 2004). For instance, the ability to
efficiently process lactose, the primary carbohydrate in milk, is biologically programmed
through the body’s natural production of the enzyme lactase which only occurs during the
neonatal period in mammals (e.g. Hill et al., 2004). Similarly, the ability for young sea lions to
produce the necessary enzymes needed for efficient protein and lipid assimilation may also be
biologically programmed to occur at a later age than seals who wean at an earlier age. Costa
9
(1991) suggested that phocid pups reach a chemical and developmental maturity faster than
otariid pups.
In order to maintain growth, an animal needs to provide its body with many essential
nutrients including carbohydrates, proteins, lipids, and water (e.g. Hill et al., 2004). For
pinnipeds the primary source of all of these vital nutrients is through the milk or solid food that
they consume. Generally, carbohydrates are the easiest and first compounds used for energy
production. Within a short period of time though, carbohydrate storage is reduced and lipids
become the preferred energy form for energy consumption. If food or nutrient deprivation
continues, protein reserves within the lean body mass are tapped to maintain proper blood
glucose levels. Castellini and Rea (1992) describe three stages of fasting found in most
mammals. The first stage of fasting begins with the onset of food deprivation and is marked by a
reduction in metabolic rate as well as an increase in lipid oxidation. As circulating blood glucose
levels decrease, the body moves into the second stage with another increase in lipid oxidation to
not only supply energy for the main body but to support central nervous function through the
production of ketone bodies. Again, priority is placed on protein-sparing; however as glucose
levels continue to decline protein catabolism becomes necessary for glucose production and
proper central nervous system function. Starvation occurs when protein catabolism becomes
overwhelming, poisoning the body and often causing death from kidney failure or cardiac
wasting (e.g. Castellini and Rea, 1992). If protein catabolism occurs at a greater rate than lipid
oxidation, it is possible for an animal with even a significant lipid layer to starve. In healthy adult
pinnipeds, long duration fasting is accomplished through extended stage two fasting that rarely
10
leads them to the terminal starvation that results in stage three. However, if a young sea lion has
not had the opportunity to develop a healthy lipid layer, healthy growth and maintenance will be
sacrificed as both lipids and lean body mass are mobilized for energy production. This would be
especially true if the pup was unable to properly assimilate the food it consumed and ultimately
developed an energy deficit. Rosen et al. (2007) describes digestive capacity as the amount of
food an individual can process and how this can be limited by a possible lack of developmental
maturity in pups. If body condition degrades enough that the energy requirements necessary for
proper health are greater than what the body can produce through digestion, then catabolism of
internal energy stores becomes a requirement to make up that difference.
Determining whether an animal’s body is struggling to meet its energy requirements and
what resources are being used to meet those needs is very important in determining potential
methods of treatment. Changes in body composition can reveal whether lipid or protein reserves
are being utilized to meet those energy needs. One of the most reliable methods of indirectly
estimating body composition is through the determination of an animal’s total body water
(TBW) through hydrogen isotope dilution analysis. This method has been successfully
demonstrated in several pinniped species using deuterium oxide (D2O) (e.g. Bowen and Iverson,
1988; Arnould et al., 1996, Speakman et al. 2001; Muelbert et al., 2003), a naturally occurring
isotope of water as a bio-marker in the body. Through measurement of baseline levels naturally
occurring in the blood and the subsequent distribution of a measured amount of deuterium oxide
into the pup’s system, it is possible to measure a pup’s total body water content. Arnould et al.
(1996) determined that it is possible to accurately calculate the total body protein, lipid and ash
11
composition of an animal. Through the continued measurement and observation of these values it
is possible to determine changes in body composition more accurately than through standard
body morphometrics.
To further confirm estimated body composition changes it is also possible to monitor
changes in blood parameters that are known to vary with body composition. The blood urea
nitrogen level in the blood is one such parameter. Proteins, comprised of nitrogen-containing
amino acids, begin their digestion in the stomach as special enzymes called pepsins break the
proteins into their component amino acid parts. The absorption, or assimilation, of amino acids
occurs within the gastrointestinal tract. The amino acids are used for protein synthesis within the
body during growth, including the production of lean body mass in the muscular, structural,
connective, and organ tissues (e.g. Reynolds and Rommel, 1999). Most mammals however, are
unable to store excess amounts of amino acids and therefore will strip the nitrogen-containing
chains from the unused carbon-containing amino acid chains. A byproduct of this stripping in the
protein breakdown process is the nitrogen compound ammonia which the liver converts into the
less toxic form of urea. Therefore, increased levels of blood urea nitrogen levels can result from
increased levels of protein digestion, whether from external food consumption or from internal
lean mass catabolism.
Unlike proteins, lipids and fatty acids begin their digestion in the mid-gut region of the
small intestines with the help of pancreatic enzymes called lipases and bile salts produced by the
liver. After being assimilated into the body, fatty acids are important to the construction of
12
cellular membranes during tissue production, assist with brain and nervous system function, and
help regulate thyroid and adrenal activity (e.g. Reynolds and Rommel, 1999). A natural anti-
inflammatory, fatty acids aid with blood thinning, regulating blood pressure and the breakdown
of cholesterol. Excess amounts of fatty acids can be restructured as lipids inside the body and
used as energy-dense storage compounds that in marine mammals are in the form of blubber.
The synthesis of additional lipids can come from the carbon-containing amino acid chains
produced during excess protein amino acid processing and restructured as blubber. In marine
mammals in particular, blubber is utilized for energy storage, insulation, body streamlining,
buoyancy, and protection. Much like when carbohydrates are catabolized, lipid oxidization
results in increased levels of glucose in the blood and are easily monitored through blood glucose
testing common in standard laboratory testing procedures.
The thyroid hormones thyroxine and triiodothyronine are two other blood parameters that
may indicate that physiological changes are occurring within the body. These hormones play
many roles including regulating skeletal growth, synthesizing proteins, and stimulating
metabolism. When the body is energy depleted, the brain releases thyroid-stimulating hormone
(TSH) into the blood to encourage metabolism of carbohydrates, fats, and proteins. The thyroid
gland, which is receptive to this TSH produced by the brain, begins to produce its own hormones
thyroxine (T4) and triiodothyronine (T3). T4 represents the larger portion of thyroid hormone
production, has a longer half-life, and is found in the greatest concentrations in blood tests. It
helps to regulate the body’s metabolism and influence physical development. The production of
T4 also helps to stimulate further production of the more potent T3 hormone which aids to
13
increase an animal’s basal metabolic rate (BMR). As these hormones enter the blood-stream they
are often picked up by transporting proteins and become inactive. Measurements done in a
typical thyroid blood profile not only examine the levels of these hormones in the blood (total
T4/T3), but also the amount of these hormone that are available and biologically active (free
T4/T3). An increased level of these hormones can be an indication that the body has entered an
energy deficit and is in need of immediately energy production.
Any delay in energy production could lead to a change in body condition, and the
compromising of essential bodily functions. Though consequences may not ultimately be fatal,
their effects can be detrimental to optimal growth and development. An objective of the present
study is to examine whether age has an effect on how pups are able to transition to a solid fish
diet and effectively assimilate the energy needed for proper growth and development. In
addition, to determine if the measurement of various blood parameters including thyroxine and
triiodothyronine can be effective indicators of a pup’s nutritional health. To understand the
relative efficiencies of post-weaning development, the growth rates, blubber depth, overall body
composition, blood urea nitrogen, glucose and thyroid hormone levels were monitored in 3
groups of ex situ California sea lion pups that were artificially weaned at approximately five,
seven and nine months of age.
14
MATERIALS AND METHODS
Location and Subjects
Research was conducted with a group of California sea lion (Zalophus californianus)
pups born and raised in the Pacific Point Preserve exhibit at SeaWorld®
in Orlando, Florida,
USA. This exhibit maintained a pinniped population of over 80 California sea lions and harbor
seals (Phoca vitulina). As with their free-ranging counterparts, California sea lion births at
SeaWorld occur within an eight week period that lasts from late May through early July. A few
weeks after birth, pups are gathered and individually tagged with Rototags™
on their fore flippers
for identification purposes. Ten pups were born within the exhibit during the summer of 2006;
however the unexpected death of a sea lion mother reduced the potential study group to nine
after her orphaned pup required bottle feeding at just two months of age. The remaining pups
(seven males and two females) participated in the study between December 2006 and March
2007. All experimental protocols were approved by the UCF Institutional Animal Care and Use
Committee (protocol approval #06-44W) and SeaWorld Animal Husbandry Committee.
Conducting this study in an ex situ zoological environment allows for the control of a
number of variables and provides a unique opportunity to examine sea lion pups and changes of
assimilation efficiency when weaned at different ages. For instance, all sea lion pups were
housed in the same outdoor holding pool during their weaning process, which included a 3.1m x
3.1m x 1.8m filtered artificial sea water pool surrounded on all sides by a 1.2m wide dry haul out
space. Water temperature was able to be kept constant at 17°C for the duration of the study.
15
Animals were exposed to natural sunlight and ambient atmospheric conditions with daily
temperature readings recorded along with general weather conditions. Ex situ adult female sea
lion mothers had daily access to the proper nutritional diet, eliminating the need to forage and
increasing the amount of nursing time available to her offspring. This should maximize the
offspring’s ability to grow and develop, as these factors are both dependent on the adequate
delivery of nourishment by the mother (e.g. Arnould et al., 2001). These ex situ pups, however,
have little interaction with whole or live fish during the nursing period. This is due to a lack of
live fish in their environment, the intense competition by adults for the limited food fed from
park guests at the exhibit, as well as the careful deliberate feeding of adult sea lions by the
zookeepers. Therefore, the results of the present study should not be biased by a pup’s strong
familiarity with solid food. In addition, due to the controlled breeding practices necessary in
zoological facilities, one dominant intact mature male was allowed to breed that season.
Therefore, any genetic link to the physiological effects of weaning should be reduced due to
paternal homogenizing. Finally, whereas free-ranging pups would have several months to allow
their bodies to adjust to a changing diet while still nursing, the artificial weaning process inherent
in a zoological environment subjects pups to an immediate shift from a liquid milk diet one day
to being fed a solid fish diet the next. This sudden shift in food source may amplify any
difficulties that their bodies have in assimilating the food.
Experimental Design
Three groups of sea lions were utilized to examine the effects of age on their transition to
nutritional independence. The nine pups were grouped by their age at the time of controlled
16
weaning at five (Group 1), seven (Group 2) and nine months (Group 3). Experimental trials
began in early December 2006 when three five-month-old pups (nos. #71, #00 and #60) (mean
age of 158 ± 7.5 d) were separated from their mothers and moved into the holding enclosure
away from the rest of the general pinniped population.
After a 24 h separation from their mothers to allow for complete digestion of any
remaining milk consumed (e.g. Costa, 1987; Oftedal et al., 1987b; Bowen and Iverson, 1998)
and to allow blood parameters to reach a baseline level, individual sea lions underwent an initial
evaluation from the veterinary staff and no health abnormalities were noted. Body mass, girth,
and blubber depth were measured and blood samples were collected from the caudal gluteal vein
using a 2 inch 21-gauge needle and BD Vacutainer®
collection tubes. An initial 5 ml blood
sample was collected in lithium heparin collection tubes for determination of naturally occurring
baseline blood concentrations of deuterium oxide (D2O). An additional 7 ml sample was
collected in thrombin-containing collection tubes for serum analysis of blood urea nitrogen,
blood glucose, thyroxine and triiodothyronine. Pups were then administered a dose of D2O (0.5 g
kg-1
body mass) (e.g. Oftedal, et al., 1987b; Worthy et al. 1992; Muelbert, et al., 2003) given
orally through orogastric intubation. To allow the deuterium dosage to distribute evenly
throughout the pup’s body water, an equilibration period of 2.5 h (e.g. Worthy et al. 1992;
Muelbert, et al., 2003) was given. Another 5 ml blood sample (lithium heparin collection tube)
was then collected for analysis of post treatment D2O levels to determine total body water and
initial body composition. When possible, identical backup samples were collected for each
sample taken. In addition, ultrasound blubber depth measurements were taken to confirm body
17
composition changes and determine growth rate. Measurements were taken in triplicate using a
Scanoprobe II (Scanco Inc., NY, USA) at six locations on the body: dorsal axillary, lateral
axillary, dorsal umbilical, lateral umbilical, dorsal hips and lateral hips (Figure 1). To ensure site
consistency and ideal skin contact, a 3.8 cm2
patch of fur was shaved at all six locations. Blubber
depths were determined by measuring the distance from the skin-blubber interface to the
blubber-muscle layer interface. Utilizing these same locations, girth measurements were also
taken at the axillary, umbilical, and hip locations on the sea lion.
Figure 1: Ultrasound measurements were taken in triplicate at six locations on the body: dorsal
axillary, lateral axillary, dorsal umbilical, lateral umbilical, dorsal hips and lateral hips. Photo
credit: Brandon Davis
18
Pups were weighed daily by walking them onto a platform scale (± 0.1 kg, Pacific
Industrial Scale Company Ltd.) to determine body mass. Additional 7 ml blood samples in
thrombin-containing collection tubes were taken on the morning of every third day for blood
urea nitrogen, blood glucose, and thyroid hormone testing as well as a 5 ml sample in lithium
heparin-containing collection tubes for additional body composition calculations. Every sixth
day, an additional 5 ml blood sample assessment of background levels of D2O was taken, then
another dose of D2O was administered orally through orogastric intubation (0.5 g kg-1
current
body mass), followed 2.5 h later by another 5 ml equilibration blood sample. With every
administration of deuterium, girth measurements and ultrasound blubber depth measurements
were taken. Collection did not exceed 35 ml of blood on measurement days throughout the
process. The assessment period lasted until individuals were eating whole fish voluntarily. Daily
food intake and body mass data were collected for several weeks after the study prior to the pups
release onto exhibit. In addition, just prior to their return back into the general exhibit population,
a 5 ml pre-dose blood sample was collected in lithium heparin-containing collection tubes, a
final administration of deuterium oxide (0.5 g kg-1
current body mass) was given orally through
orogastric intubation again, and a 5 ml equilibration blood sample was collected after a 2.5 hour
period. This entire process was then replicated with three approximately seven-month-old pups
(Group 2) in January 2007 (nos. #11, #19, and #38) (mean age of 210 ± 9.2 d) and again with the
three remaining approximately nine-month-old pups (Group 3) in March 2007 (nos. #27, #65,
and #20) (mean age 252 ± 3.6 d).
19
At SeaWorld®
Orlando, the standard procedure to facilitate the transition to solid food is
to initially utilize small herring (Clupea harengus) as the first species of fish offered to young
weaning sea lion pups. These fish are large enough for zookeepers to hold as they feed the pups
while also being small enough for a pup to swallow easily. In addition, the herring size and high
caloric value reduce the number of feedings needed to provide the pup with adequate nutrition.
Eventually, as the pups get accustomed to eating fish on their own, the smaller and less energy-
dense capelin (Mallotus villosus) species is added to the diet for additional variety and nutrition.
The weaning process begins with only one or two fish being offered a day initially and
progresses to multiple fish offered during several sessions throughout a given day. Once the pups
are eating voluntarily they are offered as much food as they care to consume. All intake totals for
each type of food ingested were recorded for the period starting when the pups were taken off
exhibit until the time they returned to the exhibit several weeks after the conclusion of this food
transition period. Fish consumed by the pups were obtained individually quick frozen through a
zoo and aquarium seafood distributor (McRoberts Sales Co., Inc., Ruskin, FL, USA) and
samples from each shipment were laboratory tested for fat, water, protein and caloric content
(ABC Research Laboratories, Gainesville, FL, USA). Protein content was calculated by ABC
Research Laboratories from the value of NH3 gas evolved from a sample that had been digested
with sulfuric acid, diluted, made alkaline, and then steam distilled. Fat content was determined
through acid hydrolysis whereby samples were weighed and digested with HCl acid using steam
heat. This solution was then cooled, transferred into a Mojonnier tube, and extracted using a
mixture of ethers. The ethers were then collected in a tared beaker and evaporated. The
percentage of fat content was determined by dividing the mass of the fat extracted by the original
20
sample mass. Lastly, to determine moisture content, samples were dehydrated in convection
oven and weighed. The difference between pre and post drying weights was then converted to
moisture content.
During examinations there were several temporal considerations that were recorded to
determine their potential effect on outcomes. Time was recorded when the first pup of the group
was separated out, when a particular pup was immobilized, when attempts were made to collect a
blood sample, when a successful sample was achieved, and when the pup returned to the holding
pool. Pup order was also recorded. In addition, it was noted when blood samples were processed
at the SeaWorld veterinary laboratory and placed into the -62° C freezer.
Sample Analysis
Whole blood samples were drawn via pipette from the lithium heparin Vacutainer™
tubes into 1 ml Cryovial®
containers. Preparation of the serum samples from thrombin-
containing Vacutainer™ tubes included the additional step of serum separation established
through the use of a centrifuge set at 3200 rpm for ten min. After processing and preparation, all
samples were transferred into a -62⁰ C freezer for storage.
A 5ml whole blood sample was used for deuterium dilution analysis. Concentrations
were determined by the Boston University Stable Isotope Laboratory (Boston, MA, USA) using
a headspace equilibration technique (e.g. Hayes, 2004) with an IsoPrime isotope ratio mass
spectrometer.
21
Serum analyses of blood urea nitrogen and glucose were conducted to compare to
changes in body composition. Samples were analyzed by the SeaWorld (Orlando, FL, USA)
veterinary laboratory staff. Assays were performed on an Olympus Beckman-Coulter AU400e
analyzer utilizing an enzymatic modification of the Talke and Schubert method (1965) for
analysis of blood urea nitrogen and the Hexokinase G-6-PDH method (e.g. Bondar and Mead,
1974) for blood glucose analysis. For both methods, standardized colorimetric endpoint
measurements were used for analyte quantification.
Serum samples were also analyzed for thyroid hormone levels at the Michigan State
University Diagnostic Center for Population and Animal Health (DCPAH) (Lansing, MI, USA)
using total T4, free T4, and free T3 thyroid assay kits from DiaSorin Inc. (Stillwater, MN, USA)
and established procedures for in-house charcoal separation radioimmunoassay for total T3
values (e.g. Panciera et al., 1989).
Body Composition
Using the change in blood deuterium concentrations over time, each pup’s body
composition was estimated using predictive equations developed for the related otariid species,
the Antarctic fur seal (Arctocephalus gazella) (Arnould et al., 1996), which were determined
through whole-carcass desiccation. Total body water (TBW) was calculated:
( )
( )
( ) ( 1 )
22
Where W is the deuterium concentration of the dose administered, A is the amount of the dosage,
and δpost / δpre are the atomic concentrations of deuterium in the post- / pre-dosage blood
samples. To convert from moles to kilograms utilizing the molecular weight of distilled water
(18.02):
( )
( )
( 2 )
This calculated value for TBW has been found to have an overestimation of 4% (e.g. Bowen and
Iverson, 1998), and thus a correction is necessary:
( )
( )
( 3 )
Lean body mass (LBM) was calculated assuming a constant proportion of water throughout lean
tissue. The chemical composition analysis of Antarctic fur seals revealed LBM to be about 4%
higher in pups than adults, and therefore 74.7% of TBW (Arnould et al. 1996).
( )
( )
( 4 )
Total body protein (TBP) was calculated from LBM with an assumption that protein is constant
throughout lean body tissue. This was also done using the Arnould et al. (1996) estimation that
TBP comprises 21.4% of the lean body mass and thus the equation:
23
( ) ( ) ( 5 )
Conversely, total body lipid (TBL) calculations were made by subtracting LBM (kg) from the
total body mass (TBM) (kg) of the individual pup.
( ) ( ) ( ) ( 6 )
Statistical Analyses
Statistical computation was conducted with JMP®
and R statistical programming
software. Graphs were produced using SigmaPlot (Ver. 10.0, Systat Software Inc.). Normality
was checked using the Shapiro-Wilk test for goodness of fit. The small sample size t-test was
utilized to determine statistical significance between groups in all cases unless otherwise noted.
A significance interval of 0.05 was used to determine 95% confidence in t-test results. The
Pearson’s Coefficient of Correlation was utilized to determine strength of correlation between
variables with significance set at r ≥ ± 0.8.
24
RESULTS
Data were classified into three categories: baseline measurements taken within the first
24 hours post separation from the mothers, the transition period from the first day after weaning
to the date of their lowest total body mass (TBM), and the recovery period from the date of their
lowest TBM to 30 days later. In a few instances pups remained at their lowest TBM for a few
additional days before starting recovery. In these few instances, the first date they reached their
lowest TBM became the end date of the transition period calculation, while the last date of their
lowest TBM was considered the start of the recovery phase calculation. If a parameter value was
unavailable for that particular date, the next nearest value to that date was utilized.
Initial Parameters
The nine California sea lion pups that were part of the present study were born within a 4
week span from May 23 through June 18, 2006. Initial veterinary evaluations performed on each
pup prior to study revealed no abnormal health parameters. Pups consisted of seven males and
two females randomly assigned to three study groups with approximate ages at separation of 5
months (158 ± 7.5 d) (Group 1), 7 months (210 ± 9.2 d) (Group 2), and 9 months (252 ± 3.6 d)
(Group 3) old. Initial body masses of pups in the three groups were not significantly different
(39.7 ± 3.5 kg,) though this was largely driven by the presence of a smaller female in each of the
two older age groups. Group 1 pups had the largest initial girth measurements
25
Table 1: Initial, transition, and final recovery girth measurements (cm) at the axillary, umbilical
and hip locations along the sea lion trunk.
Animal I.D. Sex Location Initial Transition Recovery
Group 1
#71 M Axillary 87.0 75.0 -
Umbilical 85.0 72.0 -
Hips 65.0 50.0 -
#00 M Axillary 82.0 75.0 -
Umbilical 78.0 68.5 -
Hips 66.5 56.0 -
#60 M Axillary 87.0 83.0 -
Umbilical 83.0 72.0 -
Hips 70.0 53.0 -
Group2
#11 F Axillary 82.5 77.0 82.0
Umbilical 75.0 68.0 72.0
Hips 62.5 55.0 59.0
#19 M Axillary 88.0 84.0 -
Umbilical 81.5 74.0 -
Hips 64.5 59.0 -
#38 M Axillary 85.0 75.5 78.5
Umbilical 79.0 71.0 72.0
Hips 68.0 59.5 59.0
Group3
#27 M Axillary 84.5 79.5 -
Umbilical 78.0 71.0 -
Hips 63.0 60.0 -
#65 F Axillary 80.0 77.0 -
Umbilical 77.0 73.5 -
Hips 62.0 57.0 -
#20 M Axillary 83.0 83.0 81.0
Umbilical 74.5 72.5 76.0
Hips 60.0 61.0 61.0
26
across all three locations (axillary / umbilical / hips) (85.3 ± 2.9 cm / 82.0 ± 3.6 cm / 67.2 ± 2.6
cm), followed by Group 2 (85.2 ± 2.8 cm / 78.5 ± 3.3 cm / 65.0 ± 2.8 cm), and finally Group 3
(82.5 ± 2.3 cm / 76.5 ± 1.8 cm / 61.7 ± 1.5 cm) (Table 1).
Group 1 pups had an average initial overall blubber depth of 2.6 ± 0.9 cm across all six
locations (dorsal axillary, lateral axillary, dorsal umbilical, lateral umbilical, dorsal hips, and
lateral hips) (Figure 2). As shown in Figure 2, two pups (#71 (Group 1) and #65 (Group 3)) had
missing blubber depth values at locations due to logistical issues during measurement. These two
pups were omitted from the calculations of average blubber depth for those locations. Compared
to the Group 1 pups, Group 2 pups had significantly greater initial blubber depths with an overall
bodily average of 4.4 ± 0.6 cm (t test, p= 0.03) while Group 3 pups also had significantly greater
initial depths with an average of 4.4 ± 0.8 cm (t-test, p< 0.05). Upon closer examination of the
Group 2 and Group 3 pups, the dorsal umbilical and dorsal hip locations had noticeably
increased blubber depth compared to the surrounding measured locations. Group 2 pups had a
blubber depth of 5.6 ± 1.2 cm at these two locations, which was significantly different compared
to the mean depth of 3.8 ± 0.3 cm at the remaining four locations (p< 0.05). Likewise, Group 3
had similar results with a dorsal umbilical and dorsal hip blubber depth average of 5.3 ± 0.9 cm,
and a 4.0 ± 0.7 cm for the remaining locations, though this was not significant (p= 0.06) (Table
2).
27
Table 2: Initial, post-transition, and final recovery blubber depth measurements (cm) at the
axillary (dorsal and lateral), umbilical (dorsal and lateral) and hip (dorsal and lateral) locations
along the sea lion trunk.
Animal I.D. Location Initial Transition Recovery
Group 1
#71 Axillary-dorsal - 5.3 -
Axillary-lateral 2.3 5.0 -
Umbilical-dorsal 4.0 7.7 -
Umbilical-lateral 2.0 3.0 -
Hips-dorsal 5.0 3.3 -
Hips-lateral 4.7 4.0 -
#00 Axillary-dorsal 2.3 4.3 -
Axillary-lateral 2.0 4.7 -
Umbilical-dorsal 1.3 4.7 -
Umbilical-lateral 2.0 4.0 -
Hips-dorsal 2.0 4.7 -
Hips-lateral 1.7 4.3 -
#60 Axillary-dorsal 2.0 4.0 -
Axillary-lateral 2.7 3.7 -
Umbilical-dorsal 2.3 3.3 -
Umbilical-lateral 2.0 3.7 -
Hips-dorsal 2.0 2.7 -
Hips-lateral 2.0 2.3 -
Group 2
#11 Axillary-dorsal 5.0 3.3 3.7
Axillary-lateral 4.7 4.3 3.3
Umbilical-dorsal 6.3 5.0 3.7
Umbilical-lateral 3.7 3.7 2.3
Hips-dorsal 4.7 6.0 4.0
Hips-lateral 3.3 4.3 4.0
#19 Axillary-dorsal 3.3 3.7 -
Axillary-lateral 3.3 3.7 -
Umbilical-dorsal 4.0 5.0 -
Umbilical-lateral 3.0 3.3 -
Hips-dorsal 4.7 6.0 -
Hips-lateral 4.3 4.7 -
#38 Axillary-dorsal 2.3 5.3 3.7
Axillary-lateral 3.5 2.7 3.3
Umbilical-dorsal 6.0 5.7 3.7
Umbilical-lateral 4.7 3.0 4.0
Hips-dorsal 7.7 2.7 4.0
28
Hips-lateral 4.7 2.3 3.3
Group 3
#27 Axillary-dorsal 3.3 2.3 -
Axillary-lateral 3.0 3.3 -
Umbilical-dorsal 4.8 2.7 -
Umbilical-lateral 3.0 3.7 -
Hips-dorsal 4.3 4.3 -
Hips-lateral 4.0 2.7 -
#65 Axillary-dorsal 4.3 3.7 -
Axillary-lateral 2.3 3.3 -
Umbilical-dorsal 5.3 5.0 -
Umbilical-lateral 4.7 - -
Hips-dorsal 5.0 4.3 -
Hips-lateral 4.0 - -
#20 Axillary-dorsal 5.7 4.0 4.0
Axillary-lateral 3.7 4.7 3.3
Umbilical-dorsal 6.3 5.0 3.7
Umbilical-lateral 6.0 6.5 3.9
Hips-dorsal 6.3 5.3 5.0
Hips-lateral 3.7 4.7 4.0
29
Initial blood parameters of the pups (24 hours after weaning from their mothers) were
important in determining their baseline blood levels after several months of nursing. Blood
glucose values were normally distributed but not significantly different from each other (mean:
157.2 ± 8.3 mg dL-1
, range: 139-166). Group 1 pups began the transition to solid food with a
blood glucose value of 156.7 ± 6.5 mg dL-1
, while Group 2 and 3 pups had glucose values of
163.0 ± 3.6 mg dL-1
and 152.0 ± 11.3 mg dL-1
respectively. Blood urea nitrogen levels were also
normally distributed but not significant from each other (mean: 16.1 ± 3.1, range: 12.0-21.0).
Group 1 pups had initial blood urea nitrogen levels of 15.7 ± 4.0 mg dL-1
,while the Group 2 pups
had a 16.0 ± 2.6 mg dL-1
average and Group 3 pups a 16.7 ± 3.8 mg dL-1
average. Initial thyroid
thyroxine (T3) and triiodothyronine (T4) hormone levels (tT4 / fT4 / tT3 / fT3) were measured
for all three groups of pups and none were significant except for the free T4 values (Table 3).
The average measurements for free T4 in Group 1 pups (14.7 ± 2.1 pmol L-1
) was significantly
different from the free T4 in Group 3 pups (17.3 ± 0.6 ρmol L-1
, p= 0.02), but not significant
compared to Group 2 pups (18.3 ± 2.5 ρmol L-1
, p= 0.06) (Table 3).
Starting body composition estimates showed differences particularly in the lipid stores of
the older Group 3 pups. After a couple more months of nursing these pups had a significantly
increased level of 24.9 ± 4.7% total body lipid (TBL) compared to Group 2 pups (14.1 ± 2.0%,
p= 0.01) and Group 1 pups (12.5 ± 4.3%, p= 0.01). With the largest estimated value of TBL%,
the Group 3 pups were also the lowest in TBP% (15.8% ± 0.6) and TBW% (53.9% ± 2.1). The
Group 1 pups were significantly larger than Group 3 pups in TBP% (18.9 ± 0.6%, p< 0.01), and
TBW% (63.9 ± 3.1%, p< 0.01). In addition, the Group 2 pups which were closer in age were also
30
significantly larger than the Group 3 pups with an 18.4 ± 0.4% TBP average (p< 0.01) and 62.7 ±
1.5% TBW average (p< 0.01).
Table 3: Initial and post-transition thyroid hormone measurements for total thyroxine (tT4; nmol
L-1
), total triiodothyronine (tT3; nmol L-1
), free thyroxine (fT4; ρmol L-1
), and free
triiodothyronine (fT3; ρmol L-1
).
Animal I.D. tT4 tT3 fT4 fT3
Group 1
#71 Initial 56.0 1.2 17.0 1.6
Post 10.0 0.3 8.0 0.7
#00 Initial 30.0 0.9 14.0 1.0
Post - - - -
#60 Initial 35.0 0.7 13.0 0.8
Post 7.0 0.3 8.0 0.5
Group 2
#11 Initial 42.0 1.1 16.0 1.6
Post 14.0 0.6 8.0 0.7
#19 Initial 48.0 1.2 21.0 1.0
Post 10.0 0.6 14.0 0.6
#38 Initial 40.0 1.2 18.0 1.1
Post 17.0 0.6 13.0 0.7
Group 3
#27 Initial 36.0 0.9 17.0 1.0
Post 16.0 0.5 14.0 0.5
#65 Initial 35.0 0.8 17.0 1.1
Post 10.0 0.5 11.0 0.4
#20 Initial 41.0 1.4 18.0 1.7
Post 16.0 0.8 10.0 0.7
31
Transition Period
After being separated from their mothers, pups experienced an initial period of mass loss
as the full availability of their mother’s milk was replaced with a reduced diet of only a few fish.
Food amounts consumed were gradually increased at the discretion of the zoological animal care
staff with every effort being made to increase daily intake totals uniformly between groups.
Nutrient value assessment was conducted by ABC laboratories on the fish used by SeaWorld in
this study and energy calculations were estimated assuming 1 calorie is equivalent to 4.184
kilojoules. The herring used during the transition to a solid food diet for Group 1 pups and Group
2 pups was 16.5% protein, 14.0% fat, and 67.0% water with a caloric density of 1661 kJ kg-1
.
Herring used for the Group 3 pups differed in composition having 18.6% protein, 7.1% fat, and
72.0% water with a caloric density of 1192 kJ kg-1
. As capelin was eventually introduced to the
pup’s diet, all three groups consumed capelin composed of 13.5% protein, 3.1% fat and 80.9%
water with a caloric density of 713 kJ kg-1
.
This initial transition period for the individual sea lion pups as they adapted to a solid fish
diet encompassed two different turning points in their development. The day that they began to
voluntarily consume fish was a behavioral turning point that differed between groups. Group 3
pups began eating voluntarily significantly earlier (16.3 ± 0.6 d) than Group 1 pups (21.7 ±1.5 d,
p< 0.05) and Group 2 (21.0 ± 1.7 d, p< 0.05), while the latter two groups were not significantly
different from each other. More importantly, the day in which the pups stopped losing body mass
and began a recovery period of growth and development was a physiological turning point that
was also different between groups. Group 1 pups took significantly longer to begin gaining mass
32
(31.7 ± 1.2 d) than their older counterparts. Group 3 pups were the quickest group to reverse
trend and recover lost body mass (20.7 ± 4.0 d, p< 0.01) while Group 2 pups were similar to
Group 3 pups (24.3 ± 4.5 d, p< 0.01). All groups began recovery after they had commenced
voluntary consumption of fish. The difference between the date voluntary consumption
commenced and the date the body began recovery was significantly greater in the Group 1 pups
(10.0 ± 1.7d) than both Group 2 pups (3.3 ± 3.1 d, p= 0.02) and Group 3 pups (4.33 ± 3.8 d, p=
0.04).
There were no significant differences between the amounts of food given to the pups
during the transition period. All pups were given just one fish on the first day after separation
and their intake increased throughout the transition period. Herring was offered exclusively up
until just days before voluntary fish consumption commenced. Once pups began eating food
voluntarily, they were offered as much fish as they wanted. Total food intake average (mean:
1.83 ± 0.22 kg d-1
, range: 1.47 – 2.20) and average rate of intake increase (+0.12 ± 0.04 kg d-1
)
for the pups was consistent between groups. Group 1 pups had an overall average of 1.72 ± 0.08
kg d-1
consumed during the transition period with an average daily increase of 0.10 ± 0.01 kg d-1
.
Group 2 pups averaged 1.97 ± 0.20 kg d-1
of fish intake with a daily increase of 0.12 ± 0.04 kg d-
1
, while Group 3 pups averaged 1.78 ± 0.30 kg d-1
of fish intake with a daily increase of 0.15 ±
0.04 kg d-1
. By the last day of their respective transition periods, the pups were consuming an
average of 3.18 ± 0.20 kg d-1
, 2.78 ± 0.69 kg d-1
, and 3.04 ± 0.22 kg d-1
respectively. However
when taking into consideration the energy density of the herring and eventual capelin consumed,
there were significant differences between the groups. Group 2 pups had an overall average of
15,455 ± 1251 kJ d-1
consumed that was significantly greater than the Group 1 pups (11,326 ±
33
138 kJ d-1
, p< 0.01) and Group 3 pups (10,309 ± 1,736 kJ d-1
, p< 0.01). For average daily energy
increase it was the Group 3 pups that had an average of 878 ± 230 kJ d-1
that was significantly
greater than the Group 1 pups average increase of 556 ± 27 kJ d-1
(p= 0.04), but insignificant
from the Group 2 pups average of 866 ± 294 kJ d-1
. Despite these differences, all three groups
averaged around 15,062 kJ of intake at the time they reached their lowest body mass and began
recovery. This was computed by averaging each pup’s daily intake for the six days surrounding
its date of lowest total body mass (date of lowest TBM ± 3 d) and using this total to determine
the group average. Group 1 pups were consuming an average of 15,133 ± 1,079 kJ when they
began the recovery phase, Group 2 pups consumed 15,183 ± 2,568 kJ, and the Group 3 pups
consumed 14,945 ± 4,786 kJ.
Group 1 pups lost an average of -8.5 ± 1.6 kg during the initial transition equal to -21.5 ±
3.3% of TBM with an average loss of -0.27 ± 0.04 kg d-1
. Group 2 pups averaged -6.8 ± 1.4 kg
of TBM or -17.1 ± 3.2 % of initial mass, losing an average of -0.29 ± 0.10 kg d-1
. Lastly, Group
3 pups lost -5.9 ± 0.91 kg or -15.3 ± 3.4% of their initial TBM with an average loss of -0.30 ±
0.03 kg d-1
. With these values, there was no significant difference in rate of mass loss between
groups, however there was a significant difference in mean mass loss between Group 3 pups and
Group 1 pups (p= 0.04), and the differences in percentage of mass loss were significant between
Group 1 pups and Group 3 pups (p< 0.05), but not significant between Group 1 pups and Group
2 pups (p= 0.09).
Loss in body mass was also evident in girth and blubber depth changes. Changes in
axillary girth measurements had the smallest variability between groups and were not
34
significantly different from each other, but all of the umbilical and hip average girth
measurements were statistically different. Younger pups lost more girth than older pups (Table
1). The Group 1 pups umbilical (-11.2 ± 1.8 cm) and hip locations (-14.2 ± 3.3 cm) showed a
greater reduction in girth loss compared to both Group 2 pups (-7.50 ± 0.50 cm (p= 0.01) / -7.17
± 1.53 cm (p= 0.02)) and Group 3 pups (-4.17± 2.57 cm (p< 0.01) / -2.33 ± 3.06 cm (p< 0.01)).
Though less than Group 1 pups, the losses in girth at the umbilical and hip locations in Group 2
pups were significantly greater than that in the Group 3 pups (p< 0.05 / p= 0.04). During the
transition period, overall average blubber depth across all locations increased by 1.6 ± 0.9 cm in
Group 1 pups, while decreasing in the Group 2 pups (-0.3 ± 0.9 cm, p= 0.03) and Group 3 pups
(-0.4 ± 0.2 cm, p< 0.01). Though Group 1 began the transition period with significantly less
overall blubber depth, the overall group blubber depth averages were not significantly different
by the end of the transition period (4.0 ± 0.8 cm, p>0.05). All pups showed significant change in
lateral axillary blubber depth with Group 1 pups gaining the most blubber (+2.11 ± 0.96 cm) in
this region compared to smaller gains in Group 3 pups (+0.78 ± 0.38 cm) and losses in Group 2
pups (-0.28 ± 0.59 cm). Blubber losses of Group 2 pups were also significantly different from
gains showed by by Group 3 pups (p = 0.045). Younger Group 1 pups also differed significantly
at the dorsal axillary location (+2.00 cm ± 0.00) compared to Group 3 pups (-1.11 cm ± 0.51, p<
0.01), the dorsal umbilical location (+2.67 cm ± 1.45) compared to Group 2 (-0.22 cm ± 1.17, p=
0.03) and Group 3 pups (-1.28 cm ± 0.92), and the lateral umbilical location (+1.56 cm ± 0.51)
compared to both the Group 2 pups (-0.44 cm ± 1.07, p= 0.02) and Group 3 pups (+0.50 cm ±
0.24, p= 0.04).
35
Blood glucose changes varied greatly especially within Group 1 pups (-26.67 ± 11.50 mg
dL-1
) but also between Group 2 pups (-44.33 ± 5.86 mg dL-1
) and Group 3 pups (-36.67 ± 7.77
mg dL-1
) (Figure 2). Group 2 pups had significantly greater changes in blood glucose levels
compared to Group 1 pups (p= 0.03). Blood glucose levels did not show strong significant
correlation with body mass (Pearson’s Coefficient, r= 0.19), total body lipid mass (kg) (r= 0.24),
or total body protein mass (kg) (r= 0.06).
Blood urea nitrogen levels all increased on average, with the Group 3 pups experiencing
the smallest change from their initial measurement (+9.33 ± 3.21 mg dL-1
) (Figure 3). This was
significantly less than both Group 2 pups (+15.00 mg ± 2.00 mg dL-1
, p= 0.03) and Group 1 pups
(+19.00 ± 4.58 mg dL-1
, p= 0.02). Blood urea nitrogen levels did not show strong correlation
with body mass (r= -0.55), total body lipid (r= -0.32), or total body protein (r= 0.06).
All thyroid hormone levels for all pup groups decreased during the transition period
though they were not significantly different from each other (Figures 4-7). The overall average
for changes in tT4 during the transition period was +29.1 ± 8.6 nmol L-1
(range: 20-46), for tT3
was +0.5 ± 0.2 nmol L-1
(range: 0.3-0.9), for fT4 was +6.4 ± 2.0 nmol L-1
(range: 3.0-9.0), and
fT3 was 0.6 ± 0.3 nmol L-1
(range: 0.3-1.0). Group 1 pups had tT4 levels decrease -37.0 ± 12.7
nmol L-1
, tT3 decrease -0.7 ± 0.1 nmol L-1
, fT4 decrease -7.0 ± 2.8 ρmol L-1
, and fT3 decrease -
0.6 ± 0.4 ρmol L-1
. The Group 2 pups had similar averages with tT4 (-29.7 ± 7.6 nmol L-1
), tT3 (-
0.6 ± 0.1 nmol L-1
), fT4 (-6.7 ± 1.5 ρmol L-1
) and fT3 (-0.6 ± 0.3 ρmol L-1
) all decreasing.
Similarly, decreasing tT4 (-23.3 ± 2.9 nmol L-1
), tT3 (-0.4 ± 0.2 nmol L-1
), fT4 (-5.7 ± 2.5 ρmol
36
Figure 2: Changes in individual blood glucose values over time. Pups #71, #00, #60 weaned at 5
mo. (Group 1), pups #11, #19, #38 weaned at 7 mo. (Group 2), and pups #27, #65, #20 weaned
at 9 mo. (Group 3).
37
Figure 3: Changes in individual blood urea nitrogen values over time. Pups #71, #00, #60
weaned at 5 mo. (Group 1), pups #11, #19, #38 weaned at 7 mo. (Group 2), and pups #27, #65,
#20 weaned at 9 mo. (Group 3).
38
Figure 4: Changes in individual total thyroxine (tT4) hormone levels over time. Pups #71, #00,
#60 weaned at 5 mo. (Group 1), pups #11, #19, #38 weaned at 7 mo. (Group 2), and pups #27,
#65, #20 weaned at 9 mo. (Group 3).
39
Figure 5: Changes in individual total triiodothyronine (tT3) hormone levels over time. Pups #71,
#00, #60 weaned at 5 mo. (Group 1), pups #11, #19, #38 weaned at 7 mo. (Group 2), and pups
#27, #65, #20 weaned at 9 mo. (Group 3).
40
Figure 6: Changes in individual free thyroxine (fT4) hormone levels over time. Pups #71, #00,
#60 weaned at 5 mo. (Group 1), pups #11, #19, #38 weaned at 7 mo. (Group 2), and pups #27,
#65, #20 weaned at 9 mo. (Group 3).
41
Figure 7: Changes in individual free triiodothyronine (fT3) hormone levels over time. Pups #71,
#00, #60 weaned at 5 mo. (Group 1), pups #11, #19, #38 weaned at 7 mo. (Group 2), and pups
#27, #65, #20 weaned at 9 mo. (Group 3).
42
L-1
), and fT3 (-0.7 ± 0.3 ρmol L-1
) values were evident in Group 3 pups as well. Thyroid
hormone levels were weakly correlated with body mass. Values for tT4, fT4, and tT3 had weak
positive correlations (r= 0.52, r=0.36, and r= 0.47 respectively) with total body mass while fT3
was weakly negatively correlated (r= -0.01).
Analysis of changes in deuterium dilution values revealed that there were no significant
differences in TBL%, TBP% and TBW% body composition changes between groups. Overall
TBP (kg) and TBW (kg) did correlate in the pups with changes in TBM (r= 0.82 and r= 0.82
respectively). Body composition percentage changes in the pups revealed an average change of
+1.3 ± 0.9% in TBP% (range: -0.7–2.31), loss of -6.4 ± 3.6% in TBL% (range: -10.8-0.4), and
gain of +4.7 ± 3.1% in TBW% (range: -2.3-7.9). Group 1 pups lost TBL% (-8.2 ± 2.2%) while
gaining TBP% (+1.6 ± 0.7%) and TBW%.(+6.0 ± 1.6%). Group 2 pups also experienced a
decrease of TBL% (-4.5 ± 5.0%), while having a slight increase in TBP% (+0.7 ± 1.2%), and an
increase in TBW% (+2.4 ± 4.2%). Likewise, Group 3 pups had a loss in TBL% (-6.5 ± 3.3%),
with a gain in TBP% (+1.8 ± 0.2%) and TBW% (+6.0 ± 0.7%).
Recovery Period
Total body mass gained was not significantly different between groups during the
recovery period (+30 days) (mean: 6.9 ± 3.9 kg, range: 2.3-15.5). Group 1 gained +6.82 ± 1.98
kg, Group 2 pups gained +5.00 ± 1.21 kg, and Group 3 pups gained +9.02 ± 6.59 kg. Likewise,
the rate of mass gain during the recovery phase was insignificant (mean: +0.2 ± 0.1 kg d-1
, range
0.1-0.5) Individual group comparisons reveal an increase of +0.23 ± 0.07 kg d-1
for Group 1
pups, +0.17 ± 0.04 kg d-1
for Group 2 pups, and +0.30 ± 0.22 kg d-1
for Group 3 pups.
43
Percentage changes in body mass were also not significantly different (mean: 20.8 ± 11.1%,
range: 8.4-45.4). All groups increased with the Group 1 pups increasing +21.4 ± 6.3%, Group 2
pups increasing +15.2 ± 4.8%, and Group 3 increasing +25.9 ± 18.6%. However, one member of
the Group 3 pups (#65) experienced an uncharacteristic loss of appetite and reduction in mass
gained during this 30 day recovery period. Pup #65 later received a diagnosis of acute anemia
which may have contributed to her appetite and loss of body mass. If her body mass data from
the recovery period was excluded from statistical consideration due to this abnormal health
condition, the remaining members of Group 3 had an average body mass increase of +12.39 ±
4.35 kg, an average rate of mass gain of +0.41 ± 0.14 kg d-1
, and a percentage of body mass
change of 34.7 ± 15.0%. This would be a significantly greater amount of body mass increase
than the Group 2 pups (p= 0.03) but not significantly more than the Group 1 pups (p= 0.07) pups.
Similarly, without pup #65 the average rate of mass gain for this group was significantly greater
than Group 2 pups (p= 0.02) and not significantly greater than Group 1 pups (p= 0.06). The
percentage of body mass change for this group however was not significantly greater than the
Group 2 pups (p= 0.06) and was not statistically different from Group 1 pups either.
Determining the timing of a pup’s physiological shift toward recovering lost mass and
maintaining healthy growth was difficult to predict and consequently occurred at the end of our
sampling period in most of the sea lions. Therefore, most of the parameters except TBM were
not measured during this period. Three sea lion pups (#11 and #38 from Group 2, and #20 from
Group 3) had measurements taken for girth and blubber depth after transitioning into the
recovery period (Tables 1 and 2). For each pup the last set of measurements came fifteen days
44
after the date of lowest body mass and at the halfway point of the established thirty day recovery
period for statistical purposes. For the following set of girth and blubber depth results, a
comparison was made from the date of lowest TBM to the last measurement fifteen days later.
Pup #11 from Group 2 gained girth at all three locations (axillary / umbilical / hips) (+5.0 cm /
+4.0 cm / +4.0 cm) and lost blubber depth at all but the dorsal axillary location (dorsal axillary /
lateral axillary / dorsal umbilical / lateral umbilical / dorsal hips / lateral hips) (+0.3 cm / -1.0 cm
/ - 1.3 cm / -1.3 cm / -2.0 cm / -0.3 cm). Another pup from Group 2, pup #38, gained girth in the
axillary (+3.0 cm) and umbilical locations (+1.0 cm) while losing in the hip location (-0.5 cm).
Blubber depth values for pup #38 were mixed with some locations gaining and some losing
(dorsal axillary / lateral axillary / dorsal umbilical / lateral umbilical / dorsal hips / lateral hips) (-
1.7 cm / +0.7 cm / -2.0 cm / +1.0 cm / +1.3 cm / +1.0 cm). Pup #20 was the only pup in Group 3
to have measurements beyond the physiological turning point of lowest body mass. This pup lost
axillary girth (-2 cm) while gaining umbilical girth (+3.5 cm) and maintaining the same hip girth.
Blubber depth for pup #20 decreased in all areas except for the dorsal axillary location where it
maintained the same depth (dorsal axillary / lateral axillary / dorsal umbilical / lateral umbilical /
dorsal hips / lateral hips) (0.0 cm / -1.3 cm / -1.3 cm / -2.4 cm / -0.3 cm / -0.67 cm).
The blood parameters of glucose, urea nitrogen, and thyroid levels were also available for
these three pups. Pup #11 had a blood glucose level that fell (-20.0 mg dL-1
), a BUN value that
increased (+12.0 mg dL-1
), and thyroid levels that remained unchanged or increased (tT4 / tT3 /
fT4 / fT3) (+4.0 nmol L-1
/ 0.0 nmol L-1
/ +8.0 ρmol L-1
/ -0.2 ρmol L-1
). Pup #38 had an increase
in glucose level (+15.0 mg dL-1
), no change in BUN, and increasing or unchanged thyroid levels
45
(tT4 / tT3 / fT4 / fT3) (+3.0 nmol L-1
/ +0.1 nmol L-1
/ +3.0 ρmol L-1
/ 0.0 ρmol L-1
). Lastly, pup
#20 from Group 3 had both increasing blood glucose (+11.0 mg dL-1
) and BUN (+14.0 mg dL-1
)
values, and decreasing or unchanged thyroid levels (tT4 / tT3 / fT4 / fT3) (-4.0 nmol L-1
/ -0.1
nmol L-1
/ 0.0 ρmol L-1
/ 0.0 ρmol L-1
).
Other Variables
Although extreme changes in weather could affect the amount of energy needed to
maintain homeostasis and thus increase metabolism and potential growth, average daily weather
temperature was not significantly different between groups and did not correlate with changes in
body mass (Pearson’s Coefficient, r= 0.032).
All time intervals measured showed insignificant results. Time elapsed from blood
collection to the time a prepared sample was placed into the freezer was the longest time interval
recorded and potentially the most variable. However, there were no significant differences
between groups with the average time being 90 ± 3 min between blood collection and the
processed sample being placed within the freezer. Mannisto et al. (2007) determined that there
was no significant effect on thyroid hormones levels when samples were kept at room
temperature (22º C) for up to 4 days (Mannisto et al., 2007).
As the study group consisted of two female pups and seven male pups, any sex specific
differences were examined as the pups progressed through the study. Male pups started the
transition to solid food with a significantly greater total body mass (41.0 ± 2.2 kg) than the
46
females (34.8 ± 2.3 kg, p<0.01), which was due to a greater total body protein (TBP) mass (7.5 ±
0.3 kg) than the females (5.9 ± 1.2 kg, p< 0.01) and a greater total body water (TBW) mass (25.3
± 1.0 kg) than the females (20.3 ± 4.1 kg, p< 0.01). After the transition phase and at their lowest
total body mass, the male pups had maintained their significant differences in these areas of body
composition with greater total TBP (kg) (6.7 ± 0.4 kg), TBP% (19.8 ± 1.3%), TBW (kg) (23.0 ±
1.4 kg), and TBW% (67.5 ± 4.4%) than the females TBP (kg) (5.4 ± 0.8 kg, p< 0.01), TBP%
(17.6 ± 0.5%, p= 0.03), TBW (kg) (18.3 ± 2.8 kg, p< 0.01), and TBW% (60.1 ± 1.7%, p= 0.03).
All other parameters including growth rates, between males and females, did not differ
significantly throughout the present study.
47
DISCUSSION
Weaning age of ex situ California sea lion pups was a factor in initial total body lipid
percentages, change in body mass, blubber depth, girth, blood urea nitrogen, and blood glucose
as they progressed through the process of transitioning to eating solid food in this study. The
amount of research on pinnipeds has grown considerably over recent decades covering a broad
range of topics. Numerous studies have examined health in adult pinnipeds with studies focusing
on body condition parameters such as changes in lipid and protein content determined through
hydrogen isotope dilution (Rutishauser et al., 2004; Kumagai, 2006), morphometric parameters
such as blubber depth and girth (Worthy et al., 1992; Mellish et al., 2007), as well as blood
parameters such as thyroid hormones (Ortiz et al., 2001; Ortiz et al., 2003; Debier et al., 2005),
blood urea nitrogen and blood glucose (Roletto, 1993). Additionally, research has been
conducted on pinnipeds during natural seasonal fluctuations in body condition (Kastelein et al.,
2000), changing environmental conditions like El Niño (Trillmich et al., 1985; Heath et al.,
1991; Trillmich et al., 1991), and health crises such as unusual mortality events affecting a
population (Yochem et al., 2009). Research has also been conducted on the anthropogenic effects
that cause prey-shift in pinnipeds due to resource competition (Rosen and Trites, 2002; Trites
and Donnelly, 2003) though the focus has been on the more robust adult populations. Many
recent studies conducted on pinniped pups have focused on the nursing period or post-weaning
fast in phocid species (Iverson et al., 1993, Mellish et al., 1999, Muelbert et al., 2003; Shulz and
Bowen, 2005). Previous research on otariid pups has focused on maternal investment and pup
development during the nursing period before weaning (Oftedal et al., 1987b, Trites et al., 2006.
Few studies have compared California sea lion pup health pre- and post-weaning (Kastelein et
48
al., 2000). The present study was designed to build on the methods and findings of these
previous research projects while examining an important period in the life history of ex situ
California sea lions. It is the first to physiologically explore the “prey-shift” that occurs when
these otariid pups in a zoological setting make the abrupt transition to an unfamiliar solid food
diet. The results of the present study could further improve zoological population management,
as well as provide results that could be useful for effective rehabilitation of sick and injured free-
ranging sea lion pups and improve their chances of survival upon return to their natural
environment. In addition, it provides insight into the physiological reaction sea lion pups can
have to a sudden accelerated implementation of the natural process of weaning - which may
prove beneficial when studying in situ populations that must adjust to similar circumstances.
Statistical analysis revealed several variables with significant results, a few correlations
between variables, and some interesting trends in the overall data. From a broad perspective,
initial body mass was expected to be larger in these ex situ pups versus their free-ranging
counterparts as they had greater opportunity to nurse as the mothers did not need to leave their
pups in order to forage. Ex situ pup groups in the present study were either significantly greater
or equal in size and TBL% to their same-age in situ counterparts (Table 1). In situ California sea
lions on San Nicolas Island (SNI) (119º 30’ W, 33º 15”N) and Aňo Nuevo Island (ANI) (122º
20’W, 37º6’N) were examined over the course of several months from 1988 to 1991 using
tritium dilution to estimate total body lipid values (Worthy and Costa, unpubl. data). Overall
axillary blubber depth measurements of the in situ pups by Worthy and Costa (unpubl.) were
calculated as the average of both the dorsal and lateral axillary ultrasound measurements. A
49
direct comparisons was made with the average overall axillary blubber depth values computed in
the same manner from the ex situ pups in this study. The five month old ex situ pups in this study
had significantly greater body mass (p< 0.01), axillary girth (p< 0.01), and axillary blubber depth
(p< 0.01) compared to the 5 month old in situ pups. Total body lipid percentage was the only
value that was not significantly different between the ex situ and in situ pups. The comparison
between Group 3 pups was similar with significantly greater axillary blubber depth (p< 0.01) and
TBL% (p= 0.01) in the ex situ pups, but showed no evidence that they were different in body
mass or axillary girth.
Within the present study, initial blubber depths in Group 2 and Group 3 pups were
significantly thicker in the dorsal umbilical and dorsal hip region, which could indicate that the
dorsal umbilical and dorsal hip areas of the pup may be located within an area receiving greater
initial growth in blubber deposition between the ages of 5 and 7. Blubber density is generally
not uniform across the body (Hoopes, 2007). Oftedal et al. (1987b) found that younger 1-2
month old nursing California sea lion pups utilized their energy consumption primarily for
growth and development as opposed to blubber deposition, however Thompson et al. (1987)
found that blubber deposition became a higher priority for pups closer to weaning. This may be
due to their primarily terrestrial nature as very young non-precocial pups remain on the beach
waiting for their mothers to return from foraging trips. However, as they get older they begin to
venture into the water’s edge to explore; exposing them to the much colder marine environment.
Thompson et al. (1987) states that increased heat loss due to submersion underwater causes the
50
Table 4: The initial measurements of body mass (kg), axillary girth (cm), axillary blubber depth
(cm), and total body lipid percentage for this project’s ex situ sea lion pups (5mo and 9mo)
compared to same-aged in situ pup data from San Nicolas Island (SNI) and Aňo Nuevo Island
(ANI) (1988–1991) (Worthy and Costa, unpubl. data).
Age Bracket Body Mass
(kg)
Axillary Girth
(cm)
Axillary Blubber
Depth (cm)
Total Body
Lipid (%)
5mo ex situ (n=3) 39.7 ± 1.2 85.3 ± 2.9 2.3 ± 0.1 12.5 ± 4.3
5mo in situ (n=19) 26.6 ± 5.2 70.6 ± 5.3 1.5 ± 0.2 15.1 ± 2.4
9mo ex situ (n=3) 39.3 ± 5.7 82.5 ± 2.3 3.7 ± 0.9 24.9 ± 4.7
9mo in situ (n=16) 38.7 ± 8.0 79.0 ± 7.8 1.5 ± 0.2 17.1 ± 4.9
51
Figure 8: Body mass data of estimated 5, 9, 10, and 13 month old in situ California sea lion
(Zalophus californianus) pups from San Nicolas Island and Aňo Nuevo Island (1988-1991)
(Worthy and Costa, unpublished data).
52
poorly insulated pups to divert energy away from growth and toward blubber production. The
time frame between the Group 1 and Group 2 age brackets in this study coincide with the natural
six month old time frame that free-ranging sea lion pups begin to experiment catching prey on
their own (Peterson and Bartholomew, 1967; Odell, 1972). This is particularly poignant when
you examine the change in body mass, percentage of mass loss, girth, and blubber depth that
occurred in the Group 1 pups as they progressed through the transition period. Starting with
similar body mass to the other two age brackets and the highest TBP% and TBW% (thus lowest
TBL%), Group 1 pups proceeded to lose significantly more body mass, resulting in a
significantly higher percentage of mass loss and significantly greater loss of girth in the
umbilical and hip locations – all while gaining blubber depth across all locations. Group 1 pups
managed to gain blubber depth despite losing a greater amount of total body mass. This suggests
that either protein or visceral lipid deposits were being utilized up to this point by Group 1 pups
to maintain physiological homeostasis. Though small amounts of protein catabolism are required
for gluconeogenesis, the degradation of too much protein could eventually prove fatal as internal
organs are compromised (e.g. Castellini and Rea, 1992).
All initial values of blood glucose, blood urea nitrogen, total triiodothyronine, and free
triiodothyronine measured in the study groups were normal but not significantly different from
each other. In addition, both total and free thyroxine values were normal but not significantly
different in Group 1 pups, while only free thyroxine levels in Group 2 pups were normal and not
significant. This could be an indication that despite the age difference all groups began this
transition to solid food in relatively the same metabolic state. All pups experienced a gradual
53
decrease in blood glucose in the first week after separation from their mothers with the majority
having their final glucose measurement lower than their initial starting value. Blood glucose
values found within the overall study group (mean: 143.3 mg dL-1
, range: 111-218) largely fell
well within the normal range seen in free-ranging California sea lions (43-205 mg dL-1
) (e.g.
Roletto et al. 1993) and within normal ranges observed in ex situ sea lions at SeaWorld (70-200
mg dL-1
). Pup #19 (Group 2) was an exception with one value measuring outside the range at
218 mg dL-1
, though this was within the normal glucose ranges seen in the phocid harp seals (88-
218 mg dL-1
) and hooded seals (135-283 mg dL-1
) (e.g. Boily et al., 2006). The blood sample that
measured a blood glucose of 218 mg dL-1
was hemolyzed, which could have caused the
abnormal increase in glucose measured as the contents of red blood cells are inadvertently
released into the serum. Two other pups (#60 and #65) had spikes in blood glucose during the
transition period (Figure 2) with samples that were not hemolyzed. Another factor that can
increase blood glucose is bleeding or ulceration in the gastrointestinal tract. This is a possibility
in the present study as the deuterium was administered through gastric intubation. Blood glucose
levels also fluctuate throughout a given day by elevating rapidly for a few hours after meals,
however they usually are at their lowest after a fast. Given that the pups in the present study were
subjected to an overnight fast before blood samples were taken, the results would likely be an
overall indication that the lipid body stores were being utilized to meet energy demands. With
lipid stores already at a minimum in developing sea lion pups, a continuation of this process
could cause a problem described by Rosen et al. (2007) as a spiral effect where catabolism of the
lipid layer reduces insulation, causing an increase in heat loss, which in turn causes an increasing
need for more lipid catabolism.
54
The blood urea nitrogen levels measured in the present study (mean: 25.2 mg dL-1
, range:
10-43) fell within the lowest part of the wide 15-159 mg dL-1
range seen with in situ sea lions by
Rolleto et al (1993) and largely within the normal range seen in the zoological populations at
SeaWorld (14-38 m dL-1
). With the exception of pups # 38 and # 65 (Group 2 and 3 respectively)
all pups started or dipped below this normal range. BUN increased gradually over the course of
the study with the final measurements being at or near the highest values recorded. Elevated
BUN levels have been utilized in past studies as an indicator of starvation in pups as internal lean
body mass was being compromised (e.g. Rea et al., 1998; Trumble and Castellini, 2002), though
this has been inconsistent as Worthy (1982) observed no difference in BUN levels in harp seal
pups as they transitioned from fasting to feeding. In the present study however, most of the
values were within normal range. Although there was a steady upward trend in BUN seen
throughout the study period, this may be an effect of the higher-protein fish diet being steadily
introduced to the pups, and revealing a shift from a lower normal nursing BUN level to a slightly
higher normal adult-diet BUN level.
Total thyroxine levels (tT4) in the pups (mean: 21.1 nmol L-1
, range: 5.0-50.0) were
comparable to the normal range of tT4 levels in other pinnipeds such as in the post weaning free-
ranging elephant seal pups in Ortiz et al. (2003) (17-55 nmol L-1
) as well as the free-ranging
juvenile California sea lion pups in Debier et al. (2005) (9.0-44.5 nmol L-1
). All pups saw a
decrease in total thyroxine levels throughout the study. Likewise, total triiodothyronine (tT3)
values in the pups (range: 0.3-1.4, mean 0.7 nmol L-1
) were within the normal ranges of tT4
found by Ortiz et al. (2001) (0.4-1.2 nmol L-1
) in free-ranging elephant seal pups and found by
55
Debier et al. (2005) (0.28-0.84 nmol L-1
) in juvenile free-ranging California sea lion pups. The
thyroxine levels in this study were not significant and did not strongly correlate with body mass
as observed by Ortiz et al. (2003) in free-ranging elephant seals, and by Kumagai (2004) in free-
ranging Steller sea lions. Thyroid hormone levels generally increase in the blood during periods
of increased metabolism which is why neonates have been found to have increased serum
concentration levels to facilitate increased growth and development (e.g. Ronald and Dougan,
1982). Conversely, a decrease in thyroid hormones can also be an indication of a fasting body
state in order to conserve energy (e.g. Ortiz et al. 2003). In all, thyroid hormone levels appeared
to decline throughout the study period with the tT4 and tT3 levels falling more uniformly,
possibly due to mass loss and the need to conserve body condition.
Despite the efforts of zoological personnel to maintain similar food intake levels (1.83 ±
0.22 kg d-1
) between the groups and uniformly increase intake totals (+0.12 ± 0.04 kg d-1
), results
show that the age groups physiologically responded differently. A difference in caloric intake
resulted in the Group 2 pups receiving significantly more calories than the other two groups.
However, this caloric difference did not result in significantly different growth and body
composition for the Group 2 pups compared to the other two groups. Group 2 pups shared
similar values to that of Group 1 pups such as a significantly greater initial TBP% and TBW%,
as well as greater loss in girth at the umbilical and hip locations than Group 3 pups. In addition,
the Group 2 pups began eating food voluntarily at about the same time as the Group 1 pups.
However, Group 2 pups shared characteristic with Group 3 pups as well. Blubber depths for the
56
Group 2 pups decreased across all six locations as in the Group 3 pups, and Group 2 started
recovery in similar time to the Group 3 pups.
Total body mass was the only measurement regularly taken with all pups after the
sampling period and before their return to the general population. The Group 3 pups in particular
had significant results during this period. At the start of the study Group 3 pups began with
significantly more total body lipid content (kg and %), began voluntarily eating solid food
significantly sooner, and maintained more lipid mass throughout the transition period. During the
recovery phase, the mass gain and rate of mass increase was highest in the Group 3 pups though
it was not significant due to the much lower values for pup #65. Pup #65 had undergone
treatment for acute anemia by the SeaWorld veterinary team during the recovery portion of this
study after the pup had already begun consuming fish voluntarily. Pup #65 exhibited the clinical
signs of a reduced appetite and stagnant growth in body mass and condition. This may be
attributed to the reduction in stomach acid secretion that limits nutrient absorption during anemia
(e.g. Smith, 2010). Although Kumagai (2004) mentions that glucose levels often spike during
anemic conditions, this was not observed during this period with pup #65. Excluding her non-
normal values from consideration, Group 3 pups had a significantly greater mass gain and rate of
mass increase during the recovery phase that lasted 30 days beyond the date of lowest total body
mass.
DAVIS_BRANDON_T_201407_FINAL

More Related Content

Viewers also liked

Beps le azioni 5 6
Beps le azioni 5 6Beps le azioni 5 6
Beps le azioni 5 6Paolo Soro
 
Dunphy Associates Innovation Training Brochure 2017
Dunphy Associates Innovation Training Brochure 2017Dunphy Associates Innovation Training Brochure 2017
Dunphy Associates Innovation Training Brochure 2017Dunphy Associates
 
Motricidad Fina
Motricidad Fina Motricidad Fina
Motricidad Fina Jhön FËr
 
Gesundheitspost_03: Soziale Unterstützung (für Führungskräfte)
Gesundheitspost_03: Soziale Unterstützung (für Führungskräfte)Gesundheitspost_03: Soziale Unterstützung (für Führungskräfte)
Gesundheitspost_03: Soziale Unterstützung (für Führungskräfte)AnkaMaty
 
Currículo de educaciòn inicial ecuador
Currículo de educaciòn inicial ecuadorCurrículo de educaciòn inicial ecuador
Currículo de educaciòn inicial ecuadorlissethpincay
 

Viewers also liked (10)

Beps le azioni 5 6
Beps le azioni 5 6Beps le azioni 5 6
Beps le azioni 5 6
 
Jornada
JornadaJornada
Jornada
 
Dunphy Associates Innovation Training Brochure 2017
Dunphy Associates Innovation Training Brochure 2017Dunphy Associates Innovation Training Brochure 2017
Dunphy Associates Innovation Training Brochure 2017
 
Diapositiva glosario
Diapositiva glosarioDiapositiva glosario
Diapositiva glosario
 
Motricidad Fina
Motricidad Fina Motricidad Fina
Motricidad Fina
 
Gesundheitspost_03: Soziale Unterstützung (für Führungskräfte)
Gesundheitspost_03: Soziale Unterstützung (für Führungskräfte)Gesundheitspost_03: Soziale Unterstützung (für Führungskräfte)
Gesundheitspost_03: Soziale Unterstützung (für Führungskräfte)
 
Meccanica
MeccanicaMeccanica
Meccanica
 
Currículo de educaciòn inicial ecuador
Currículo de educaciòn inicial ecuadorCurrículo de educaciòn inicial ecuador
Currículo de educaciòn inicial ecuador
 
Presentación1 estimulacion temprana
Presentación1 estimulacion tempranaPresentación1 estimulacion temprana
Presentación1 estimulacion temprana
 
новорічні свята днз 4
новорічні свята днз 4новорічні свята днз 4
новорічні свята днз 4
 

Similar to DAVIS_BRANDON_T_201407_FINAL

2013 List_Weight Cycling
2013 List_Weight Cycling2013 List_Weight Cycling
2013 List_Weight CyclingEdward List
 
Integration of salivary biomarkers into developmental... granger, kivlighan, ...
Integration of salivary biomarkers into developmental... granger, kivlighan, ...Integration of salivary biomarkers into developmental... granger, kivlighan, ...
Integration of salivary biomarkers into developmental... granger, kivlighan, ...01238682460
 
A Descriptive Study On The Effects Of Making Nutrition Conscious Among Adopte...
A Descriptive Study On The Effects Of Making Nutrition Conscious Among Adopte...A Descriptive Study On The Effects Of Making Nutrition Conscious Among Adopte...
A Descriptive Study On The Effects Of Making Nutrition Conscious Among Adopte...Jack Frost
 
MeredithEyre.MastersThesis.OSU (1)
MeredithEyre.MastersThesis.OSU (1)MeredithEyre.MastersThesis.OSU (1)
MeredithEyre.MastersThesis.OSU (1)Meredith Eyre
 
Dr. Clay Lents - Nutritional Strategies for Managing Growth and Body Composit...
Dr. Clay Lents - Nutritional Strategies for Managing Growth and Body Composit...Dr. Clay Lents - Nutritional Strategies for Managing Growth and Body Composit...
Dr. Clay Lents - Nutritional Strategies for Managing Growth and Body Composit...John Blue
 
Cyrano De Bergerac Essay
Cyrano De Bergerac EssayCyrano De Bergerac Essay
Cyrano De Bergerac EssayKimberly Willis
 
All posters 2015-2016 Period 5
All posters 2015-2016 Period 5All posters 2015-2016 Period 5
All posters 2015-2016 Period 5ResearchMethodsUCM
 
Enteral nutrition in preterm neonates
Enteral nutrition in preterm neonatesEnteral nutrition in preterm neonates
Enteral nutrition in preterm neonatesVarsha Shah
 
Health benefits of plant based diet
Health benefits of plant based dietHealth benefits of plant based diet
Health benefits of plant based dietKindle Books
 
Complementary Feeding Practices To Children During
Complementary Feeding Practices To Children DuringComplementary Feeding Practices To Children During
Complementary Feeding Practices To Children DuringBiblioteca Virtual
 
Eat Less Live Longer
Eat Less Live LongerEat Less Live Longer
Eat Less Live Longerkosaytak
 
Breastfeeding Initiation Among Incarcerated Pregnant Women
Breastfeeding Initiation Among Incarcerated Pregnant WomenBreastfeeding Initiation Among Incarcerated Pregnant Women
Breastfeeding Initiation Among Incarcerated Pregnant WomenNatalie Libster
 
Pediatric_Swallowing_and_Feeding_Assessment_and_Management,_Third.pdf
Pediatric_Swallowing_and_Feeding_Assessment_and_Management,_Third.pdfPediatric_Swallowing_and_Feeding_Assessment_and_Management,_Third.pdf
Pediatric_Swallowing_and_Feeding_Assessment_and_Management,_Third.pdfAIIMCET
 
Fraser Tough PhD thesis_FINAL
Fraser Tough PhD thesis_FINALFraser Tough PhD thesis_FINAL
Fraser Tough PhD thesis_FINALFraser Tough
 

Similar to DAVIS_BRANDON_T_201407_FINAL (20)

Obesity 1
Obesity 1Obesity 1
Obesity 1
 
etd
etdetd
etd
 
Chick Experiment
Chick ExperimentChick Experiment
Chick Experiment
 
2013 List_Weight Cycling
2013 List_Weight Cycling2013 List_Weight Cycling
2013 List_Weight Cycling
 
rutgers-lib-31085_PDF-1
rutgers-lib-31085_PDF-1rutgers-lib-31085_PDF-1
rutgers-lib-31085_PDF-1
 
Integration of salivary biomarkers into developmental... granger, kivlighan, ...
Integration of salivary biomarkers into developmental... granger, kivlighan, ...Integration of salivary biomarkers into developmental... granger, kivlighan, ...
Integration of salivary biomarkers into developmental... granger, kivlighan, ...
 
A Descriptive Study On The Effects Of Making Nutrition Conscious Among Adopte...
A Descriptive Study On The Effects Of Making Nutrition Conscious Among Adopte...A Descriptive Study On The Effects Of Making Nutrition Conscious Among Adopte...
A Descriptive Study On The Effects Of Making Nutrition Conscious Among Adopte...
 
NFR 2.compressed
NFR 2.compressedNFR 2.compressed
NFR 2.compressed
 
MeredithEyre.MastersThesis.OSU (1)
MeredithEyre.MastersThesis.OSU (1)MeredithEyre.MastersThesis.OSU (1)
MeredithEyre.MastersThesis.OSU (1)
 
Dr. Clay Lents - Nutritional Strategies for Managing Growth and Body Composit...
Dr. Clay Lents - Nutritional Strategies for Managing Growth and Body Composit...Dr. Clay Lents - Nutritional Strategies for Managing Growth and Body Composit...
Dr. Clay Lents - Nutritional Strategies for Managing Growth and Body Composit...
 
Oral more
Oral moreOral more
Oral more
 
Cyrano De Bergerac Essay
Cyrano De Bergerac EssayCyrano De Bergerac Essay
Cyrano De Bergerac Essay
 
All posters 2015-2016 Period 5
All posters 2015-2016 Period 5All posters 2015-2016 Period 5
All posters 2015-2016 Period 5
 
Enteral nutrition in preterm neonates
Enteral nutrition in preterm neonatesEnteral nutrition in preterm neonates
Enteral nutrition in preterm neonates
 
Health benefits of plant based diet
Health benefits of plant based dietHealth benefits of plant based diet
Health benefits of plant based diet
 
Complementary Feeding Practices To Children During
Complementary Feeding Practices To Children DuringComplementary Feeding Practices To Children During
Complementary Feeding Practices To Children During
 
Eat Less Live Longer
Eat Less Live LongerEat Less Live Longer
Eat Less Live Longer
 
Breastfeeding Initiation Among Incarcerated Pregnant Women
Breastfeeding Initiation Among Incarcerated Pregnant WomenBreastfeeding Initiation Among Incarcerated Pregnant Women
Breastfeeding Initiation Among Incarcerated Pregnant Women
 
Pediatric_Swallowing_and_Feeding_Assessment_and_Management,_Third.pdf
Pediatric_Swallowing_and_Feeding_Assessment_and_Management,_Third.pdfPediatric_Swallowing_and_Feeding_Assessment_and_Management,_Third.pdf
Pediatric_Swallowing_and_Feeding_Assessment_and_Management,_Third.pdf
 
Fraser Tough PhD thesis_FINAL
Fraser Tough PhD thesis_FINALFraser Tough PhD thesis_FINAL
Fraser Tough PhD thesis_FINAL
 

DAVIS_BRANDON_T_201407_FINAL

  • 1. EFFECTS OF WEANING AGE ON BODY COMPOSITION AND GROWTH OF EX SITU CALIFORNIA SEA LION (Zalophus californianus) PUPS by BRANDON TYLER DAVIS B.S. Davidson College, 1997 A thesis submitted in partial fulfillment of the requirements for the degree of Master of Science in the Department of Biology in the College of Sciences at the University of Central Florida Orlando, Florida Summer Term 2014 Major Professor: Graham A. J. Worthy
  • 3. iii ABSTRACT Pinnipeds exhibit a wide range of lactation strategies that vary from just a few days to nearly three years in duration. Phocids have a relatively short, intense nursing period culminating in weaning after just a few days or weeks, while dependent otariids generally take several months of consuming a combined milk and solid food diet before being completely from the dam. The transition to nutritional independence can be particularly challenging for newly weaned pups, which must adjust to behavioral, physiological and nutritional changes as a milk diet is replaced with solid food. An interruption in energy resources during this formative stage could result in a prioritization away from growth, maintenance, or activity resulting in suboptimal development. Three groups of ex situ California sea lion (Zalophus californianus) pups were examined during the initial period of independence after they were weaned at approximately five (Group 1), seven (Group 2), and nine months of age (Group 3). Absolute growth rates of pups were calculated and changes in body composition were estimated using blubber depth measurements and deuterium oxide dilution to determine if weaning age had an effect on subsequent pup development and growth. Blood urea nitrogen and blood glucose levels were observed for their response to changes in body condition, while thyroid hormone levels in the blood were examined as a possible nutritional stress indicator during the pup’s transition to solid food. For contextual perspective, the initial measurements of the five month old and nine month old ex situ pups in this project were compared to same age in situ pups measured on San Nicolas Island, CA and Año Nuevo Island, CA. The five month old ex situ pups (Group 1) in the present study were significantly larger with greater body mass (39.6 ± 1.6 kg, p< 0.01), axillary
  • 4. iv girth (85.3 ± 2.9 cm, p< 0.01), and axillary blubber depth (2.3 ± 0.1 cm, p< 0.01) compared to 5 month old in situ pups (26.6 ± 5.2 kg / 70.6 ± 5.34 cm / 1.5 ± 0.2 cm). Although nine month old ex situ pups (Group 3) in the present study did not differ significantly from the same age in situ pups in body mass, ex situ pups had significantly greater axillary blubber depth (3.7 ± 0.9 cm, p< 0.01) and total body lipid percentage (24.9 ± 4.7%, p= 0.01) than in situ pups (1.5 ± 0.2 cm / 17.1 ± 4.9%). Examining differences between age groups in the present study, Group 1 pups initially had significantly smaller overall average blubber depth (2.6 ± 0.9 cm) compared to Group 2 pups (4.4 ± 0.6 cm, p= 0.02) and Group 3 pups (4.4 ± 0.8 cm, p= 0.03). As Group 1 pups progressed through the transition period to solid food consumption, they experienced a significantly greater amount of mean mass loss (-8.5 ± 1.6 kg) compared to Group 3 pups (-6.1 ± 1.1 kg, p= 0.04), and greater percentage of mass loss (-21.5 ± 3.3%) compared to the Group 3 pups (-15.6 ± 3.6%, p= 0.04). The loss of mass was evident as the Group 1 pups lost more girth in the umbilical (- 11.2 ± 1.8 cm) and hip (-14.2 ± 3.3 cm) locations than both Group 2 umbilical (-7.5 ± 0.5 cm, p= 0.01) and hip (-7.2 ± 1.5 cm, p= 0.01) locations as well as Group 3 umbilical (-4.2 ± 2.6 cm, p< 0.01) and hip (-2.3 ± 3.1 cm, p< 0.01) locations. Group 1 pups also took significantly longer (31.7 ± 1.2 d) to reverse mass loss and begin the recovery phase of growth and development compared to Group 2 (24.3 ± 4.5 d, p= 0.03) and Group 3 pups (20.7 ± 4.0, p< 0.01). However, despite losing the greatest amount of mass, pups in Group 1 experienced a significantly greater change in overall blubber depth (+1.6 ± 0.9 cm) compared to Group 2 (-0.3 ±0.9 cm, p= 0.03) and Group 3 pups (-0.4 ± 0.2 cm, p<. 0.01).
  • 5. v Group 3 began the transition to solid food with a significantly higher percentage of total body lipid (24.9 ± 4.7%) compared to the younger Group 1 (12.5 ± 4.3%, p=0.01) and Group 2 pups (14.1 ± 2.0%, p=0.01), and began voluntary consumption of the novel solid fish diet in a significantly shorter amount of time (16.3 ± 0.6 d) than the younger Group 1 (21.7 ± 1.5 d, p< 0.01) and Group 2 pups (21.0 ± 1.7 d, p< 0.01). During the recovery period Group 3 pups also had the greatest absolute mass increase (n= 2, +12.4 ± 4.3 kg) and rate of mass increase (+0.4 ± 0.1 kg d-1 ), significantly greater than Group 2 pups (+5.0 ± 1.2 kg, p= 0.03 / +0.2 ± 0.0 kg d-1 , p= 0.02 ). Blood glucose and urea nitrogen levels largely fell within previously observed normal ranges and did not correlate with shifts in body mass (r= 0.19, r= -0.55), total body protein (r= 0.06 , r= -0.38), or total body lipid percentages (r= 0.24, r= -0.32). Thyroid hormone analysis revealed a weak correlation between total T4 levels and body mass fluctuation (r= 0.52). Although all pups in the present study survived the transition to solid food, there were apparent differences in how the different age groups responded physiologically. The youngest Group 1 pups began the switch to solid food with the lowest overall blubber depth and experienced the greatest change in body mass and composition, while older Group 3 pups entered the transition with more energy reserves and were able to utilize those reserves more efficiently to minimize loss and promote faster growth. From the present study there is a suggestion that California sea lion pups benefit physiologically from the extended nursing period and older weaning age that is natural for otariids. Several factors such as staffing, logistics, and safety may affect the timing of pup weaning within ex situ population management of sea lion pups. However, if the driving factor is the ease at which the transition can be made and the overall health of the animal, the results of the present study revealed a potential benefit to weaning at approximately nine months of age. Likewise, these results could prove beneficial
  • 6. vi during the observation of in situ sea lion pups and their response to external pressures that affect weaning age.
  • 7. vii I would like to dedicate this paper to my mother, who always reminded me to stay focused; to my wife and family, who really sacrificed the most so that I could entertain this curiosity, and of course to my study subjects, the sea lion pups, who probably wondered why this goofy guy was looking at them so intently. and In remembrance of Stephanie E. James.
  • 8. viii ACKNOWLEDGMENTS As this project has taken several years to finally come to completion, it would not have been possible if not for the generous support of numerous individuals. First, I would like to thank Dr. Graham Worthy for giving me the opportunity to collaborate with him. His patience with me was incredible as I was faced with many challenges over the years. A special thanks goes to the rest of my advisory committee including Dr. C. Ross Hinkle for joining the team midstream and providing some much needed moral support and guidance. I would like to also acknowledge the encouragement I received from committee-member Dr. Elizabeth Chittick-Nolan and Reid Miller to investigate further and possibly advance our knowledge of sea lion weaning. If it wasn’t for them, I don’t think I would have entertained the thought of going back to school while working. Sometimes it just takes a little push to help someone to pursue a dream. A huge thanks to Mr. Vu “Tom” Nguyen whose statistical assistance ultimately made it all possible when it looked like this thesis was never going to get finished. I would like to send my thanks to Bill Hughes, Todd Coffman, and the Zoological staffs at SeaWorld Orlando for allowing me to accompany their husbandry of the sea lion pups and for accommodating my requests for samples. Without their support, this project would not have been possible. A big thank you also goes to Cathy Perry and the SeaWorld veterinary staff for being so helpful and accommodating as I interrupted their daily routine using their equipment and supplies for blood sample preparation. I also appreciate the in-kind support and experienced gained from Michael Jacobasz and the nutrition lab at the Smithsonian National Zoo which helped me to better understand the deuterium oxide dilution process. The generosity and hospitality of the Bryce Family was also amazing as they accepted me into their home when I needed a place to stay while in Washington DC. Thank you so much for your kindness! I am also very thankful for the funding and support
  • 9. ix received from the International Marine Animal Trainers Association (IMATA) through their Conservation Research Grant. IMATA’s interest in this paper helped to validate my feelings of its potential importance to the zoological and wildlife rehabilitative communities. But most of all, I want to thank my loving and supportive family - especially my wife, who I had to lean on quite a bit and who never asked for anything in return. I love and appreciate you so very much and hope that someday I may be able to return the favor.
  • 10. x TABLE OF CONTENTS LIST OF FIGURES .................................................................................................................. xi LIST OF TABLES................................................................................................................... xii LIST OF ACRONYMS AND ABBREVIATIONS ................................................................. xiii INTRODUCTION ......................................................................................................................1 MATERIALS AND METHODS...............................................................................................14 Location and Subjects ...........................................................................................................14 Experimental Design .............................................................................................................15 Sample Analysis....................................................................................................................20 Body Composition ................................................................................................................21 Statistical Analyses ...............................................................................................................23 RESULTS.................................................................................................................................24 Initial Parameters ..................................................................................................................24 Transition Period...................................................................................................................31 Recovery Period....................................................................................................................42 Other Variables .....................................................................................................................45 DISCUSSION...........................................................................................................................47 CONCLUSION.........................................................................................................................57 LIST OF REFERENCES ..........................................................................................................59
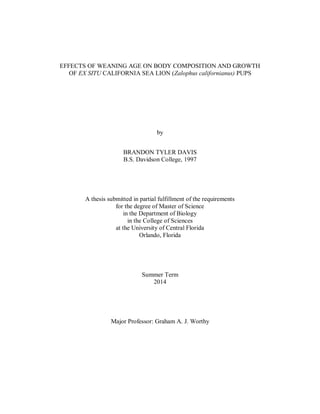
  • 11. xi LIST OF FIGURES Figure 1: Ultrasound measurements were taken in triplicate at six locations on the body: dorsal axillary, lateral axillary, dorsal umbilical, lateral umbilical, dorsal hips and lateral hips. Photo credit: Brandon Davis ..........................................................................................17 Figure 2: Changes in individual blood glucose values over time. Pups #71, #00, #60 weaned at 5 mo. (Group 1), pups #11, #19, #38 weaned at 7 mo. (Group 2), and pups #27, #65, #20 weaned at 9 mo. (Group 3).............................................................................................36 Figure 3: Changes in individual blood urea nitrogen values over time. Pups #71, #00, #60 weaned at 5 mo. (Group 1), pups #11, #19, #38 weaned at 7 mo. (Group 2), and pups #27, #65, #20 weaned at 9 mo. (Group 3). .....................................................................37 Figure 4: Changes in individual total thyroxine (tT4) hormone levels over time. Pups #71, #00, #60 weaned at 5 mo. (Group 1), pups #11, #19, #38 weaned at 7 mo. (Group 2), and pups #27, #65, #20 weaned at 9 mo. (Group 3). .............................................................38 Figure 5: Changes in individual total triiodothyronine (tT3) hormone levels over time. Pups #71, #00, #60 weaned at 5 mo. (Group 1), pups #11, #19, #38 weaned at 7 mo. (Group 2), and pups #27, #65, #20 weaned at 9 mo. (Group 3). .............................................................39 Figure 6: Changes in individual free thyroxine (fT4) hormone levels over time. Pups #71, #00, #60 weaned at 5 mo. (Group 1), pups #11, #19, #38 weaned at 7 mo. (Group 2), and pups #27, #65, #20 weaned at 9 mo. (Group 3). .............................................................40 Figure 7: Changes in individual free triiodothyronine (fT3) hormone levels over time. Pups #71, #00, #60 weaned at 5 mo. (Group 1), pups #11, #19, #38 weaned at 7 mo. (Group 2), and pups #27, #65, #20 weaned at 9 mo. (Group 3). .............................................................41 Figure 8: Body mass data of estimated 5, 9, 10, and 13 month old in situ California sea lion (Zalophus californianus) pups from San Nicolas Island and Aňo Nuevo Island (1988- 1991) (Worthy and Costa, unpublished data). ................................................................51
  • 12. xii LIST OF TABLES Table 1: Initial, transition, and final recovery girth measurements (cm) at the axillary, umbilical and hip locations along the sea lion trunk.......................................................................25 Table 2: Initial, post-transition, and final recovery blubber depth measurements (cm) at the axillary (dorsal and lateral), umbilical (dorsal and lateral) and hip (dorsal and lateral) locations along the sea lion trunk...................................................................................27 Table 3: Initial and post-transition thyroid hormone measurements for total thyroxine (tT4; nmol L-1 ), total triiodothyronine (tT3; nmol L-1 ), free thyroxine (fT4; ρmol L-1 ), and free triiodothyronine (fT3; ρmol L-1 ).....................................................................................30 Table 4: The initial measurements of body mass (kg), axillary girth (cm), axillary blubber depth (cm), and total body lipid percentage for this project’s ex situ sea lion pups (5mo and 9mo) compared to same-aged in situ pup data from San Nicolas Island (SNI) and Aňo Nuevo Island (ANI) (1988–1991) (Worthy and Costa, unpubl. data)..............................50
  • 13. xiii LIST OF ACRONYMS AND ABBREVIATIONS BMR Basal Metabolic Rate BUN Blood Urea Nitrogen CSL California sea lion fT3 Free Triiodothyronine fT4 Free Thyroxine kg Kilogram kJ Kilojoule LBM Lean Body Mass MSRML Mass Specific Rate of Mass Loss NOAA National Oceanic and Atmospheric Administration SSC Species Survival Commission tT3 Total Triiodothyronine tT4 Total Thyroxine TBL Total Body Lipid TBM Total Body Mass TBP Total Body Protein TBW Total Body Water TSH Thyroid Stimulating Hormone UME Unusual Mortality Event
  • 14. 1 INTRODUCTION Weaning is a uniquely mammalian event that involves the transition of young from their natal diet to the diet they will consume as adults. Though natural, this transition to nutritional independence can be particularly challenging for newly weaned mammals, which must adjust to behavioral, physiological and nutritional changes as the milk diet is replaced with solid food (e.g. Reiter, et al. 1978; Galef, Jr., 1981; Martin, 1984). The nutrient-rich easily-assimilated milk that has thus far been vital to their proper development and overall health gives way to a food source that requires considerably more effort to acquire and digest - at a time when rapid growth is occurring and any interruption in nutrition could be detrimental. For the young, food intake is important as any reduction in energy requires a prioritization between growth, maintenance and activity (e.g. Hill et al., 2004; Hoopes 2007). For the mother, milk production represents her largest energetic investment to her offspring as she quickly shifts her energy reserves to feed her young and improve its chances of survival (e.g. Arnould and Hindell, 2002). As each day passes, her offspring’s growing demand for milk further depletes her energy resources. The faster the female can finish lactation and successfully wean her offspring, the less of an energy deficit she will incur, and the sooner she will be prepared for her next offspring. For this reason, various lactation strategies have evolved among mammals, as the energy requirements of the mother are balanced with the energy requirements of her offspring. Pinnipeds, a monophyletic group in the Order Carnivora that includes the Families Phocidae (true seals), Otariidae (sea lions and fur seals), and Odobenidae (walrus), are semi- aquatic fin-footed animals that give birth on land or ice but forage at sea. They exhibit a wide
  • 15. 2 range of lactation strategies with weaning occurring after as few as 4 days in the hooded seal (Phocidae: Cystophora cristata) to as long as 3 years in the Galapagos fur seal (Otariidae: Arctocephalus galapagoensis) (e.g. Oftedal et al., 1987a; Shulz and Bowen, 2005). Despite this range of lactation strategies, which include a variety of nursing intervals and weaning ages, members of each of the three pinniped families share certain characteristics. Phocids, or true seals, are generally found in the colder waters of the sub-polar to temperate regions with many species giving birth on the ever-changing landscape of landfast or pack ice. Female phocids, considered classic examples of capital breeders, tend to spend months building up energy reserves on feeding grounds that may be thousands of kilometers away from birthing areas (e.g. Oftedal et al., 1987; Boness and Bowen, 1996). The thick energy-rich blubber layer accumulated from this feeding strategy becomes an investment to future offspring. The ability to mobilize these lipid stores to produce milk that is comprised of as much as 40-60% fat (e.g. Iverson et al., 1993) enables pup growth of as much as 7 kg per day (e.g. Iverson et al., 1993). This extremely lipid-rich milk composition allows a pup to store large amounts of nutrients quickly, facilitating an exceptionally short lactation period (4–45 d) where the pup is weaned and independent just days to weeks after birth (e.g. Worthy and Lavigne, 1983; Mellish et al., 1999). Because of her extensive blubber layer and this ability to rapidly transfer that energy to her pup, the mother is able to fast for the entire duration of nursing. Likewise, the newly independent pup will fast and depend on these stored energy reserves from milk consumption for several months as it learns to forage effectively. As a result, this phocid lactation strategy has been referred to as a fasting strategy (e.g. Shulz and Bowen, 2005).
  • 16. 3 In contrast, the walrus, the only extant species in the Odobenidae family, exhibits a much longer lactation period with its aquatic nursing strategy (e.g. Shulz and Bowen, 2005). Like the many phocids that live in colder sub-polar zones, walrus mothers accumulate large amounts of blubber before giving birth on ice (e.g. Boness and Bowen, 1996); however they fast for only a few days while nursing before heading out to sea to forage. Unlike phocids, walrus calves are precocial and able to remain with their mothers on foraging trips at a very young age. As a unit they are more mobile throughout the lactation period than other pinnipeds and are one of the few species that will nurse while swimming. Walrus milk is relatively low in fat content (~30%) compared with other sub-polar pinnipeds (e.g. Boness and Bowen, 1996). After several months the calves learn from their mothers to supplement their diet with mollusks and other invertebrates, and will consume this mixed diet of milk and solid food from about 6 months of age until weaning which generally occurs after 1.5 to 3 years (e.g. Riedman, 1990). This transition to nutritional independence is not as abrupt in walrus as in phocids. Otariids combine aspects of the lactation strategies exhibited by phocids and walrus into a foraging-cycle strategy (e.g. Shulz and Bowen, 2005), where the mother alternates nursing periods with foraging trips to sea without her pup. With few exceptions, otariids inhabit more temperate and tropical locales than walrus or phocids, and give birth on beaches or rocky shorelines. Fur seal and sea lion mothers lack the energy reserves found in the thick blubber layer of the true seals and walrus, and are thus considered income breeders which have to regularly replenish their reserves during the lactation period through an alternating cycle of nursing and foraging. After birth, mothers will generally spend the first week nursing their pups
  • 17. 4 before leaving to forage; with trips lasting from 1-2 d in California sea lions to as long as 12 d in Juan Fernandez fur seals (e.g. Francis et al., 1998). Since, unlike phocids, otariids do not accumulate significant energy reserves prior to birth; a reduced food supply in an area can result in longer duration trips to sea (e.g. Georges and Guinet, 2000). Under such conditions pups will endure extended periods without milk, and since pups are fasting for the duration of their mother’s trip to sea, this can have significant implications for survival. Otariid milk is relatively lower in fat content (~20-35%) relative to phocids and weaning generally occurs between four months and three years (e.g. Gentry and Kooyman, 1986). Prior to weaning, pups begin to play with fish and eventually become proficient at hunting by the time of weaning (e.g. Peterson and Bartholomew, 1967; Odell, 1972). Unlike phocids, there is no fasting associated with the post weaning period in otariid species. The California sea lion (Zalophus californianus) is an otariid species that inhabits the Pacific coastline of North America from the southern tip of Baja California, Mexico into British Columbia, Canada with a total population estimated at 300,000 individuals (e.g. NMFS, 2011). They are one of the most prolific pinnipeds in aquariums and zoological facilities worldwide (e.g. Martin, 1984; Orr and Helm, 1989; Oftedal, 2000; IMATA, 2011). The species is highly sexually dimorphic with adult males being much larger (200-455 kg) than females (50-110 kg) and having a prominent thick neck and characteristic domed or crested head. The species is polygynous, with males defending territories at breeding rookeries from May through August. Sea lion males establish these waterside territories along the beaches of coastal islands and mainland shorelines of the Pacific coast. Entering into the breeding season, a male’s neck
  • 18. 5 becomes more prominent as a thick layer of subcutaneous fat provides additional energy stores as well as protection during breeding competition. Males will refrain from foraging for several days to weeks (up to 45 d) to optimize their chances of breeding, and after the season provide very limited paternal support to the pups. Females give birth on the beach and will spend the initial 5-8 days with the pup nursing before leaving to forage for 2-3 day periods (e.g. Heath et al., 1991). Adult sea lions feed primarily on various species of fish and squid close to shore but have been known to travel as much as 450 km off-shore when resources are scarce (e.g. Weise et al., 2006). Each time the female returns to her pup to nurse she will stay for 1-2 days and fast during that period. California sea lion milk contains an average of 20-30% fat (e.g. Gentry and Kooyman, 1986; Oftedal et al., 1987a) which is leaner than most other otariids. California sea lion pup weaning occurs after approximately nine to ten months, though pups may begin playing with and ingesting fish as early as six months of age (e.g. Odell, 1972). Like other otariids, weaning generally occurs when mothers leave their offspring on a foraging trip and do not return. When there are declines in prey availability, juvenile pinnipeds often suffer the consequences as mothers must prioritize their own survival before that of their offspring. Several factors have been hypothesized to drive the variable nursing intervals and weaning times in pinnipeds including maternal body size, breeding substrate, prey availability, maternal energy stores, milk content, milk production rate, latitudinal variations, thermoregulation requirements, environmental perturbations, and neonate mass (e.g. Gentry and Kooyman, 1986; Gittleman and Oftedal, 1987; Partridge and Harvey, 1988; Lea and Hindell, 1997; Costa, 1993; Boness and Bowen, 1996; Francis et al., 1998; Boyd, 1999; Lydersen and
  • 19. 6 Kovacs, 1999; Georges and Guinet 2000; Arnould and Hindell, 2002; Rutishauser et al. 2004; Shulz and Bowen, 2005). Regardless of the driver, nursing intervals and the subsequent weaning times have a tremendous effect on the resulting blubber layer of the mothers. Though their blubber stores serve as an investment to the survival of their future offspring and can be used as energy stores and metabolized, they are often needed as insulation against the elements. Pinnipeds are susceptible to the higher heat transfer rate of water which can make thermoregulation paramount in the marine environment; with pups particularly susceptible due to their smaller size and reduced lipid reserves (e.g. Hoopes, 2007). Any environmental variability that affects nursing intervals and weaning times can affect the survival and natality of the species (e.g. Soto et al., 2004). Ten species of pinnipeds are currently listed as “at risk” by the International Union for Conservation of Nature (IUCN) with many facing challenges such as human-induced climate change, fisheries interactions and over-exploitation(e.g. Kovacs, 2011). Though the California sea lion population is currently considered stable and not one of the ten listed IUCN at-risk pinniped species, they are affected by these same challenges and their response to them can help us better understand the impacts of such environmental dynamics on pinniped populations. During years of reduced prey availability, California sea lion males have ventured to northern waters to find better resources, while females have tended to remain with their pups at the breeding sites despite resources being limited (e.g. Weise et al., 2006). The pups are often the most affected under such conditions as mothers are forced to forage farther and longer out at sea, leading many to choose to abandon their pups as they place priority on their own survival.
  • 20. 7 Shifting prey availability is one possible explanation (e.g. Westberg, pers. comm.) currently being examined as a cause for the 2013 unusual mortality event (UME) involving California sea lion pups along the Pacific coast of the United States that has resulted in a three-fold increase in pup strandings (e.g. HSWRI, 2014). Abandoned or stranded pups are often forced to adapt quickly to survive. They must recognize a completely new food source and learn to capture and consume it before their energy reserves become severely depleted. If too young to realize where sustenance may be found, sea lion pups can become malnourished and die on beaches. This instability in situ often necessitates the need for ex situ assistance. Wildlife rescue facilities have been successful at rehabilitating young stranded pups which generally involves the weaning of the pups onto their adult fish-based diet (e.g. Westberg, pers. comm.). A necessary responsibility for rescue and rehabilitation facilities is not only the stabilization of the health of the pup, but also the determination whether that pup is likely fit to survive on its own when returned to the wild (e.g. Lander and Gulland, 2003). Many of these wildlife rescue facilities are also zoological facilities and experience this same weaning transition within their own populations of ex situ pinnipeds. The goal of most zoological facilities is to provide the best possible care for their animals, and one way of doing that is to recreate a natural environment for the animals. Zoological settings however, are limited in terms of size and capabilities. With marine mammal exhibits, this often means the exclusion of other marine life such as fish, squid and crustaceans, the natural prey of these animals. This is a potential drawback during the weaning process for young pinniped as they are unable to experiment with live prey as they would in the wild. In many zoological facilities, pinniped pups
  • 21. 8 are often separated from their mothers to facilitate weaning, and fed a diet of whole fish. For seals, this sudden transition from a milk diet to fish diet is similar to what happens naturally when their mothers leave; however, free-ranging sea lions are naturally weaned after fish is already a major part of their diet (e.g. Odell, 1972; Trites et al., 2006). For a variety of reasons, the timing of this weaning process has varied between institutions with potential safety concerns for both zoological personnel and the individual animal being factors under consideration. On rare occasions, circumstances have required a very early transition to solid food as in a case where a California sea lion pup was successfully transitioned at six weeks old (e.g. Kastelein et al., 2000) after its mother unexpectedly passed away. This latter situation is similar to what occurs in many rescue facilities when young pups are rescued. Though sea lion pups have been successfully weaned through this process for many years, potential physiological impacts on the pups are unknown and it is critical to better understand the impacts that early weaning may have on overall growth and development. The digestive systems of many species commonly undergo programmed development changes between birth and adulthood (e.g. Hill et. al., 2004). For instance, the ability to efficiently process lactose, the primary carbohydrate in milk, is biologically programmed through the body’s natural production of the enzyme lactase which only occurs during the neonatal period in mammals (e.g. Hill et al., 2004). Similarly, the ability for young sea lions to produce the necessary enzymes needed for efficient protein and lipid assimilation may also be biologically programmed to occur at a later age than seals who wean at an earlier age. Costa
  • 22. 9 (1991) suggested that phocid pups reach a chemical and developmental maturity faster than otariid pups. In order to maintain growth, an animal needs to provide its body with many essential nutrients including carbohydrates, proteins, lipids, and water (e.g. Hill et al., 2004). For pinnipeds the primary source of all of these vital nutrients is through the milk or solid food that they consume. Generally, carbohydrates are the easiest and first compounds used for energy production. Within a short period of time though, carbohydrate storage is reduced and lipids become the preferred energy form for energy consumption. If food or nutrient deprivation continues, protein reserves within the lean body mass are tapped to maintain proper blood glucose levels. Castellini and Rea (1992) describe three stages of fasting found in most mammals. The first stage of fasting begins with the onset of food deprivation and is marked by a reduction in metabolic rate as well as an increase in lipid oxidation. As circulating blood glucose levels decrease, the body moves into the second stage with another increase in lipid oxidation to not only supply energy for the main body but to support central nervous function through the production of ketone bodies. Again, priority is placed on protein-sparing; however as glucose levels continue to decline protein catabolism becomes necessary for glucose production and proper central nervous system function. Starvation occurs when protein catabolism becomes overwhelming, poisoning the body and often causing death from kidney failure or cardiac wasting (e.g. Castellini and Rea, 1992). If protein catabolism occurs at a greater rate than lipid oxidation, it is possible for an animal with even a significant lipid layer to starve. In healthy adult pinnipeds, long duration fasting is accomplished through extended stage two fasting that rarely
  • 23. 10 leads them to the terminal starvation that results in stage three. However, if a young sea lion has not had the opportunity to develop a healthy lipid layer, healthy growth and maintenance will be sacrificed as both lipids and lean body mass are mobilized for energy production. This would be especially true if the pup was unable to properly assimilate the food it consumed and ultimately developed an energy deficit. Rosen et al. (2007) describes digestive capacity as the amount of food an individual can process and how this can be limited by a possible lack of developmental maturity in pups. If body condition degrades enough that the energy requirements necessary for proper health are greater than what the body can produce through digestion, then catabolism of internal energy stores becomes a requirement to make up that difference. Determining whether an animal’s body is struggling to meet its energy requirements and what resources are being used to meet those needs is very important in determining potential methods of treatment. Changes in body composition can reveal whether lipid or protein reserves are being utilized to meet those energy needs. One of the most reliable methods of indirectly estimating body composition is through the determination of an animal’s total body water (TBW) through hydrogen isotope dilution analysis. This method has been successfully demonstrated in several pinniped species using deuterium oxide (D2O) (e.g. Bowen and Iverson, 1988; Arnould et al., 1996, Speakman et al. 2001; Muelbert et al., 2003), a naturally occurring isotope of water as a bio-marker in the body. Through measurement of baseline levels naturally occurring in the blood and the subsequent distribution of a measured amount of deuterium oxide into the pup’s system, it is possible to measure a pup’s total body water content. Arnould et al. (1996) determined that it is possible to accurately calculate the total body protein, lipid and ash
  • 24. 11 composition of an animal. Through the continued measurement and observation of these values it is possible to determine changes in body composition more accurately than through standard body morphometrics. To further confirm estimated body composition changes it is also possible to monitor changes in blood parameters that are known to vary with body composition. The blood urea nitrogen level in the blood is one such parameter. Proteins, comprised of nitrogen-containing amino acids, begin their digestion in the stomach as special enzymes called pepsins break the proteins into their component amino acid parts. The absorption, or assimilation, of amino acids occurs within the gastrointestinal tract. The amino acids are used for protein synthesis within the body during growth, including the production of lean body mass in the muscular, structural, connective, and organ tissues (e.g. Reynolds and Rommel, 1999). Most mammals however, are unable to store excess amounts of amino acids and therefore will strip the nitrogen-containing chains from the unused carbon-containing amino acid chains. A byproduct of this stripping in the protein breakdown process is the nitrogen compound ammonia which the liver converts into the less toxic form of urea. Therefore, increased levels of blood urea nitrogen levels can result from increased levels of protein digestion, whether from external food consumption or from internal lean mass catabolism. Unlike proteins, lipids and fatty acids begin their digestion in the mid-gut region of the small intestines with the help of pancreatic enzymes called lipases and bile salts produced by the liver. After being assimilated into the body, fatty acids are important to the construction of
  • 25. 12 cellular membranes during tissue production, assist with brain and nervous system function, and help regulate thyroid and adrenal activity (e.g. Reynolds and Rommel, 1999). A natural anti- inflammatory, fatty acids aid with blood thinning, regulating blood pressure and the breakdown of cholesterol. Excess amounts of fatty acids can be restructured as lipids inside the body and used as energy-dense storage compounds that in marine mammals are in the form of blubber. The synthesis of additional lipids can come from the carbon-containing amino acid chains produced during excess protein amino acid processing and restructured as blubber. In marine mammals in particular, blubber is utilized for energy storage, insulation, body streamlining, buoyancy, and protection. Much like when carbohydrates are catabolized, lipid oxidization results in increased levels of glucose in the blood and are easily monitored through blood glucose testing common in standard laboratory testing procedures. The thyroid hormones thyroxine and triiodothyronine are two other blood parameters that may indicate that physiological changes are occurring within the body. These hormones play many roles including regulating skeletal growth, synthesizing proteins, and stimulating metabolism. When the body is energy depleted, the brain releases thyroid-stimulating hormone (TSH) into the blood to encourage metabolism of carbohydrates, fats, and proteins. The thyroid gland, which is receptive to this TSH produced by the brain, begins to produce its own hormones thyroxine (T4) and triiodothyronine (T3). T4 represents the larger portion of thyroid hormone production, has a longer half-life, and is found in the greatest concentrations in blood tests. It helps to regulate the body’s metabolism and influence physical development. The production of T4 also helps to stimulate further production of the more potent T3 hormone which aids to
  • 26. 13 increase an animal’s basal metabolic rate (BMR). As these hormones enter the blood-stream they are often picked up by transporting proteins and become inactive. Measurements done in a typical thyroid blood profile not only examine the levels of these hormones in the blood (total T4/T3), but also the amount of these hormone that are available and biologically active (free T4/T3). An increased level of these hormones can be an indication that the body has entered an energy deficit and is in need of immediately energy production. Any delay in energy production could lead to a change in body condition, and the compromising of essential bodily functions. Though consequences may not ultimately be fatal, their effects can be detrimental to optimal growth and development. An objective of the present study is to examine whether age has an effect on how pups are able to transition to a solid fish diet and effectively assimilate the energy needed for proper growth and development. In addition, to determine if the measurement of various blood parameters including thyroxine and triiodothyronine can be effective indicators of a pup’s nutritional health. To understand the relative efficiencies of post-weaning development, the growth rates, blubber depth, overall body composition, blood urea nitrogen, glucose and thyroid hormone levels were monitored in 3 groups of ex situ California sea lion pups that were artificially weaned at approximately five, seven and nine months of age.
  • 27. 14 MATERIALS AND METHODS Location and Subjects Research was conducted with a group of California sea lion (Zalophus californianus) pups born and raised in the Pacific Point Preserve exhibit at SeaWorld® in Orlando, Florida, USA. This exhibit maintained a pinniped population of over 80 California sea lions and harbor seals (Phoca vitulina). As with their free-ranging counterparts, California sea lion births at SeaWorld occur within an eight week period that lasts from late May through early July. A few weeks after birth, pups are gathered and individually tagged with Rototags™ on their fore flippers for identification purposes. Ten pups were born within the exhibit during the summer of 2006; however the unexpected death of a sea lion mother reduced the potential study group to nine after her orphaned pup required bottle feeding at just two months of age. The remaining pups (seven males and two females) participated in the study between December 2006 and March 2007. All experimental protocols were approved by the UCF Institutional Animal Care and Use Committee (protocol approval #06-44W) and SeaWorld Animal Husbandry Committee. Conducting this study in an ex situ zoological environment allows for the control of a number of variables and provides a unique opportunity to examine sea lion pups and changes of assimilation efficiency when weaned at different ages. For instance, all sea lion pups were housed in the same outdoor holding pool during their weaning process, which included a 3.1m x 3.1m x 1.8m filtered artificial sea water pool surrounded on all sides by a 1.2m wide dry haul out space. Water temperature was able to be kept constant at 17°C for the duration of the study.
  • 28. 15 Animals were exposed to natural sunlight and ambient atmospheric conditions with daily temperature readings recorded along with general weather conditions. Ex situ adult female sea lion mothers had daily access to the proper nutritional diet, eliminating the need to forage and increasing the amount of nursing time available to her offspring. This should maximize the offspring’s ability to grow and develop, as these factors are both dependent on the adequate delivery of nourishment by the mother (e.g. Arnould et al., 2001). These ex situ pups, however, have little interaction with whole or live fish during the nursing period. This is due to a lack of live fish in their environment, the intense competition by adults for the limited food fed from park guests at the exhibit, as well as the careful deliberate feeding of adult sea lions by the zookeepers. Therefore, the results of the present study should not be biased by a pup’s strong familiarity with solid food. In addition, due to the controlled breeding practices necessary in zoological facilities, one dominant intact mature male was allowed to breed that season. Therefore, any genetic link to the physiological effects of weaning should be reduced due to paternal homogenizing. Finally, whereas free-ranging pups would have several months to allow their bodies to adjust to a changing diet while still nursing, the artificial weaning process inherent in a zoological environment subjects pups to an immediate shift from a liquid milk diet one day to being fed a solid fish diet the next. This sudden shift in food source may amplify any difficulties that their bodies have in assimilating the food. Experimental Design Three groups of sea lions were utilized to examine the effects of age on their transition to nutritional independence. The nine pups were grouped by their age at the time of controlled
  • 29. 16 weaning at five (Group 1), seven (Group 2) and nine months (Group 3). Experimental trials began in early December 2006 when three five-month-old pups (nos. #71, #00 and #60) (mean age of 158 ± 7.5 d) were separated from their mothers and moved into the holding enclosure away from the rest of the general pinniped population. After a 24 h separation from their mothers to allow for complete digestion of any remaining milk consumed (e.g. Costa, 1987; Oftedal et al., 1987b; Bowen and Iverson, 1998) and to allow blood parameters to reach a baseline level, individual sea lions underwent an initial evaluation from the veterinary staff and no health abnormalities were noted. Body mass, girth, and blubber depth were measured and blood samples were collected from the caudal gluteal vein using a 2 inch 21-gauge needle and BD Vacutainer® collection tubes. An initial 5 ml blood sample was collected in lithium heparin collection tubes for determination of naturally occurring baseline blood concentrations of deuterium oxide (D2O). An additional 7 ml sample was collected in thrombin-containing collection tubes for serum analysis of blood urea nitrogen, blood glucose, thyroxine and triiodothyronine. Pups were then administered a dose of D2O (0.5 g kg-1 body mass) (e.g. Oftedal, et al., 1987b; Worthy et al. 1992; Muelbert, et al., 2003) given orally through orogastric intubation. To allow the deuterium dosage to distribute evenly throughout the pup’s body water, an equilibration period of 2.5 h (e.g. Worthy et al. 1992; Muelbert, et al., 2003) was given. Another 5 ml blood sample (lithium heparin collection tube) was then collected for analysis of post treatment D2O levels to determine total body water and initial body composition. When possible, identical backup samples were collected for each sample taken. In addition, ultrasound blubber depth measurements were taken to confirm body
  • 30. 17 composition changes and determine growth rate. Measurements were taken in triplicate using a Scanoprobe II (Scanco Inc., NY, USA) at six locations on the body: dorsal axillary, lateral axillary, dorsal umbilical, lateral umbilical, dorsal hips and lateral hips (Figure 1). To ensure site consistency and ideal skin contact, a 3.8 cm2 patch of fur was shaved at all six locations. Blubber depths were determined by measuring the distance from the skin-blubber interface to the blubber-muscle layer interface. Utilizing these same locations, girth measurements were also taken at the axillary, umbilical, and hip locations on the sea lion. Figure 1: Ultrasound measurements were taken in triplicate at six locations on the body: dorsal axillary, lateral axillary, dorsal umbilical, lateral umbilical, dorsal hips and lateral hips. Photo credit: Brandon Davis
  • 31. 18 Pups were weighed daily by walking them onto a platform scale (± 0.1 kg, Pacific Industrial Scale Company Ltd.) to determine body mass. Additional 7 ml blood samples in thrombin-containing collection tubes were taken on the morning of every third day for blood urea nitrogen, blood glucose, and thyroid hormone testing as well as a 5 ml sample in lithium heparin-containing collection tubes for additional body composition calculations. Every sixth day, an additional 5 ml blood sample assessment of background levels of D2O was taken, then another dose of D2O was administered orally through orogastric intubation (0.5 g kg-1 current body mass), followed 2.5 h later by another 5 ml equilibration blood sample. With every administration of deuterium, girth measurements and ultrasound blubber depth measurements were taken. Collection did not exceed 35 ml of blood on measurement days throughout the process. The assessment period lasted until individuals were eating whole fish voluntarily. Daily food intake and body mass data were collected for several weeks after the study prior to the pups release onto exhibit. In addition, just prior to their return back into the general exhibit population, a 5 ml pre-dose blood sample was collected in lithium heparin-containing collection tubes, a final administration of deuterium oxide (0.5 g kg-1 current body mass) was given orally through orogastric intubation again, and a 5 ml equilibration blood sample was collected after a 2.5 hour period. This entire process was then replicated with three approximately seven-month-old pups (Group 2) in January 2007 (nos. #11, #19, and #38) (mean age of 210 ± 9.2 d) and again with the three remaining approximately nine-month-old pups (Group 3) in March 2007 (nos. #27, #65, and #20) (mean age 252 ± 3.6 d).
  • 32. 19 At SeaWorld® Orlando, the standard procedure to facilitate the transition to solid food is to initially utilize small herring (Clupea harengus) as the first species of fish offered to young weaning sea lion pups. These fish are large enough for zookeepers to hold as they feed the pups while also being small enough for a pup to swallow easily. In addition, the herring size and high caloric value reduce the number of feedings needed to provide the pup with adequate nutrition. Eventually, as the pups get accustomed to eating fish on their own, the smaller and less energy- dense capelin (Mallotus villosus) species is added to the diet for additional variety and nutrition. The weaning process begins with only one or two fish being offered a day initially and progresses to multiple fish offered during several sessions throughout a given day. Once the pups are eating voluntarily they are offered as much food as they care to consume. All intake totals for each type of food ingested were recorded for the period starting when the pups were taken off exhibit until the time they returned to the exhibit several weeks after the conclusion of this food transition period. Fish consumed by the pups were obtained individually quick frozen through a zoo and aquarium seafood distributor (McRoberts Sales Co., Inc., Ruskin, FL, USA) and samples from each shipment were laboratory tested for fat, water, protein and caloric content (ABC Research Laboratories, Gainesville, FL, USA). Protein content was calculated by ABC Research Laboratories from the value of NH3 gas evolved from a sample that had been digested with sulfuric acid, diluted, made alkaline, and then steam distilled. Fat content was determined through acid hydrolysis whereby samples were weighed and digested with HCl acid using steam heat. This solution was then cooled, transferred into a Mojonnier tube, and extracted using a mixture of ethers. The ethers were then collected in a tared beaker and evaporated. The percentage of fat content was determined by dividing the mass of the fat extracted by the original
  • 33. 20 sample mass. Lastly, to determine moisture content, samples were dehydrated in convection oven and weighed. The difference between pre and post drying weights was then converted to moisture content. During examinations there were several temporal considerations that were recorded to determine their potential effect on outcomes. Time was recorded when the first pup of the group was separated out, when a particular pup was immobilized, when attempts were made to collect a blood sample, when a successful sample was achieved, and when the pup returned to the holding pool. Pup order was also recorded. In addition, it was noted when blood samples were processed at the SeaWorld veterinary laboratory and placed into the -62° C freezer. Sample Analysis Whole blood samples were drawn via pipette from the lithium heparin Vacutainer™ tubes into 1 ml Cryovial® containers. Preparation of the serum samples from thrombin- containing Vacutainer™ tubes included the additional step of serum separation established through the use of a centrifuge set at 3200 rpm for ten min. After processing and preparation, all samples were transferred into a -62⁰ C freezer for storage. A 5ml whole blood sample was used for deuterium dilution analysis. Concentrations were determined by the Boston University Stable Isotope Laboratory (Boston, MA, USA) using a headspace equilibration technique (e.g. Hayes, 2004) with an IsoPrime isotope ratio mass spectrometer.
  • 34. 21 Serum analyses of blood urea nitrogen and glucose were conducted to compare to changes in body composition. Samples were analyzed by the SeaWorld (Orlando, FL, USA) veterinary laboratory staff. Assays were performed on an Olympus Beckman-Coulter AU400e analyzer utilizing an enzymatic modification of the Talke and Schubert method (1965) for analysis of blood urea nitrogen and the Hexokinase G-6-PDH method (e.g. Bondar and Mead, 1974) for blood glucose analysis. For both methods, standardized colorimetric endpoint measurements were used for analyte quantification. Serum samples were also analyzed for thyroid hormone levels at the Michigan State University Diagnostic Center for Population and Animal Health (DCPAH) (Lansing, MI, USA) using total T4, free T4, and free T3 thyroid assay kits from DiaSorin Inc. (Stillwater, MN, USA) and established procedures for in-house charcoal separation radioimmunoassay for total T3 values (e.g. Panciera et al., 1989). Body Composition Using the change in blood deuterium concentrations over time, each pup’s body composition was estimated using predictive equations developed for the related otariid species, the Antarctic fur seal (Arctocephalus gazella) (Arnould et al., 1996), which were determined through whole-carcass desiccation. Total body water (TBW) was calculated: ( ) ( ) ( ) ( 1 )
  • 35. 22 Where W is the deuterium concentration of the dose administered, A is the amount of the dosage, and δpost / δpre are the atomic concentrations of deuterium in the post- / pre-dosage blood samples. To convert from moles to kilograms utilizing the molecular weight of distilled water (18.02): ( ) ( ) ( 2 ) This calculated value for TBW has been found to have an overestimation of 4% (e.g. Bowen and Iverson, 1998), and thus a correction is necessary: ( ) ( ) ( 3 ) Lean body mass (LBM) was calculated assuming a constant proportion of water throughout lean tissue. The chemical composition analysis of Antarctic fur seals revealed LBM to be about 4% higher in pups than adults, and therefore 74.7% of TBW (Arnould et al. 1996). ( ) ( ) ( 4 ) Total body protein (TBP) was calculated from LBM with an assumption that protein is constant throughout lean body tissue. This was also done using the Arnould et al. (1996) estimation that TBP comprises 21.4% of the lean body mass and thus the equation:
  • 36. 23 ( ) ( ) ( 5 ) Conversely, total body lipid (TBL) calculations were made by subtracting LBM (kg) from the total body mass (TBM) (kg) of the individual pup. ( ) ( ) ( ) ( 6 ) Statistical Analyses Statistical computation was conducted with JMP® and R statistical programming software. Graphs were produced using SigmaPlot (Ver. 10.0, Systat Software Inc.). Normality was checked using the Shapiro-Wilk test for goodness of fit. The small sample size t-test was utilized to determine statistical significance between groups in all cases unless otherwise noted. A significance interval of 0.05 was used to determine 95% confidence in t-test results. The Pearson’s Coefficient of Correlation was utilized to determine strength of correlation between variables with significance set at r ≥ ± 0.8.
  • 37. 24 RESULTS Data were classified into three categories: baseline measurements taken within the first 24 hours post separation from the mothers, the transition period from the first day after weaning to the date of their lowest total body mass (TBM), and the recovery period from the date of their lowest TBM to 30 days later. In a few instances pups remained at their lowest TBM for a few additional days before starting recovery. In these few instances, the first date they reached their lowest TBM became the end date of the transition period calculation, while the last date of their lowest TBM was considered the start of the recovery phase calculation. If a parameter value was unavailable for that particular date, the next nearest value to that date was utilized. Initial Parameters The nine California sea lion pups that were part of the present study were born within a 4 week span from May 23 through June 18, 2006. Initial veterinary evaluations performed on each pup prior to study revealed no abnormal health parameters. Pups consisted of seven males and two females randomly assigned to three study groups with approximate ages at separation of 5 months (158 ± 7.5 d) (Group 1), 7 months (210 ± 9.2 d) (Group 2), and 9 months (252 ± 3.6 d) (Group 3) old. Initial body masses of pups in the three groups were not significantly different (39.7 ± 3.5 kg,) though this was largely driven by the presence of a smaller female in each of the two older age groups. Group 1 pups had the largest initial girth measurements
  • 38. 25 Table 1: Initial, transition, and final recovery girth measurements (cm) at the axillary, umbilical and hip locations along the sea lion trunk. Animal I.D. Sex Location Initial Transition Recovery Group 1 #71 M Axillary 87.0 75.0 - Umbilical 85.0 72.0 - Hips 65.0 50.0 - #00 M Axillary 82.0 75.0 - Umbilical 78.0 68.5 - Hips 66.5 56.0 - #60 M Axillary 87.0 83.0 - Umbilical 83.0 72.0 - Hips 70.0 53.0 - Group2 #11 F Axillary 82.5 77.0 82.0 Umbilical 75.0 68.0 72.0 Hips 62.5 55.0 59.0 #19 M Axillary 88.0 84.0 - Umbilical 81.5 74.0 - Hips 64.5 59.0 - #38 M Axillary 85.0 75.5 78.5 Umbilical 79.0 71.0 72.0 Hips 68.0 59.5 59.0 Group3 #27 M Axillary 84.5 79.5 - Umbilical 78.0 71.0 - Hips 63.0 60.0 - #65 F Axillary 80.0 77.0 - Umbilical 77.0 73.5 - Hips 62.0 57.0 - #20 M Axillary 83.0 83.0 81.0 Umbilical 74.5 72.5 76.0 Hips 60.0 61.0 61.0
  • 39. 26 across all three locations (axillary / umbilical / hips) (85.3 ± 2.9 cm / 82.0 ± 3.6 cm / 67.2 ± 2.6 cm), followed by Group 2 (85.2 ± 2.8 cm / 78.5 ± 3.3 cm / 65.0 ± 2.8 cm), and finally Group 3 (82.5 ± 2.3 cm / 76.5 ± 1.8 cm / 61.7 ± 1.5 cm) (Table 1). Group 1 pups had an average initial overall blubber depth of 2.6 ± 0.9 cm across all six locations (dorsal axillary, lateral axillary, dorsal umbilical, lateral umbilical, dorsal hips, and lateral hips) (Figure 2). As shown in Figure 2, two pups (#71 (Group 1) and #65 (Group 3)) had missing blubber depth values at locations due to logistical issues during measurement. These two pups were omitted from the calculations of average blubber depth for those locations. Compared to the Group 1 pups, Group 2 pups had significantly greater initial blubber depths with an overall bodily average of 4.4 ± 0.6 cm (t test, p= 0.03) while Group 3 pups also had significantly greater initial depths with an average of 4.4 ± 0.8 cm (t-test, p< 0.05). Upon closer examination of the Group 2 and Group 3 pups, the dorsal umbilical and dorsal hip locations had noticeably increased blubber depth compared to the surrounding measured locations. Group 2 pups had a blubber depth of 5.6 ± 1.2 cm at these two locations, which was significantly different compared to the mean depth of 3.8 ± 0.3 cm at the remaining four locations (p< 0.05). Likewise, Group 3 had similar results with a dorsal umbilical and dorsal hip blubber depth average of 5.3 ± 0.9 cm, and a 4.0 ± 0.7 cm for the remaining locations, though this was not significant (p= 0.06) (Table 2).
  • 40. 27 Table 2: Initial, post-transition, and final recovery blubber depth measurements (cm) at the axillary (dorsal and lateral), umbilical (dorsal and lateral) and hip (dorsal and lateral) locations along the sea lion trunk. Animal I.D. Location Initial Transition Recovery Group 1 #71 Axillary-dorsal - 5.3 - Axillary-lateral 2.3 5.0 - Umbilical-dorsal 4.0 7.7 - Umbilical-lateral 2.0 3.0 - Hips-dorsal 5.0 3.3 - Hips-lateral 4.7 4.0 - #00 Axillary-dorsal 2.3 4.3 - Axillary-lateral 2.0 4.7 - Umbilical-dorsal 1.3 4.7 - Umbilical-lateral 2.0 4.0 - Hips-dorsal 2.0 4.7 - Hips-lateral 1.7 4.3 - #60 Axillary-dorsal 2.0 4.0 - Axillary-lateral 2.7 3.7 - Umbilical-dorsal 2.3 3.3 - Umbilical-lateral 2.0 3.7 - Hips-dorsal 2.0 2.7 - Hips-lateral 2.0 2.3 - Group 2 #11 Axillary-dorsal 5.0 3.3 3.7 Axillary-lateral 4.7 4.3 3.3 Umbilical-dorsal 6.3 5.0 3.7 Umbilical-lateral 3.7 3.7 2.3 Hips-dorsal 4.7 6.0 4.0 Hips-lateral 3.3 4.3 4.0 #19 Axillary-dorsal 3.3 3.7 - Axillary-lateral 3.3 3.7 - Umbilical-dorsal 4.0 5.0 - Umbilical-lateral 3.0 3.3 - Hips-dorsal 4.7 6.0 - Hips-lateral 4.3 4.7 - #38 Axillary-dorsal 2.3 5.3 3.7 Axillary-lateral 3.5 2.7 3.3 Umbilical-dorsal 6.0 5.7 3.7 Umbilical-lateral 4.7 3.0 4.0 Hips-dorsal 7.7 2.7 4.0
  • 41. 28 Hips-lateral 4.7 2.3 3.3 Group 3 #27 Axillary-dorsal 3.3 2.3 - Axillary-lateral 3.0 3.3 - Umbilical-dorsal 4.8 2.7 - Umbilical-lateral 3.0 3.7 - Hips-dorsal 4.3 4.3 - Hips-lateral 4.0 2.7 - #65 Axillary-dorsal 4.3 3.7 - Axillary-lateral 2.3 3.3 - Umbilical-dorsal 5.3 5.0 - Umbilical-lateral 4.7 - - Hips-dorsal 5.0 4.3 - Hips-lateral 4.0 - - #20 Axillary-dorsal 5.7 4.0 4.0 Axillary-lateral 3.7 4.7 3.3 Umbilical-dorsal 6.3 5.0 3.7 Umbilical-lateral 6.0 6.5 3.9 Hips-dorsal 6.3 5.3 5.0 Hips-lateral 3.7 4.7 4.0
  • 42. 29 Initial blood parameters of the pups (24 hours after weaning from their mothers) were important in determining their baseline blood levels after several months of nursing. Blood glucose values were normally distributed but not significantly different from each other (mean: 157.2 ± 8.3 mg dL-1 , range: 139-166). Group 1 pups began the transition to solid food with a blood glucose value of 156.7 ± 6.5 mg dL-1 , while Group 2 and 3 pups had glucose values of 163.0 ± 3.6 mg dL-1 and 152.0 ± 11.3 mg dL-1 respectively. Blood urea nitrogen levels were also normally distributed but not significant from each other (mean: 16.1 ± 3.1, range: 12.0-21.0). Group 1 pups had initial blood urea nitrogen levels of 15.7 ± 4.0 mg dL-1 ,while the Group 2 pups had a 16.0 ± 2.6 mg dL-1 average and Group 3 pups a 16.7 ± 3.8 mg dL-1 average. Initial thyroid thyroxine (T3) and triiodothyronine (T4) hormone levels (tT4 / fT4 / tT3 / fT3) were measured for all three groups of pups and none were significant except for the free T4 values (Table 3). The average measurements for free T4 in Group 1 pups (14.7 ± 2.1 pmol L-1 ) was significantly different from the free T4 in Group 3 pups (17.3 ± 0.6 ρmol L-1 , p= 0.02), but not significant compared to Group 2 pups (18.3 ± 2.5 ρmol L-1 , p= 0.06) (Table 3). Starting body composition estimates showed differences particularly in the lipid stores of the older Group 3 pups. After a couple more months of nursing these pups had a significantly increased level of 24.9 ± 4.7% total body lipid (TBL) compared to Group 2 pups (14.1 ± 2.0%, p= 0.01) and Group 1 pups (12.5 ± 4.3%, p= 0.01). With the largest estimated value of TBL%, the Group 3 pups were also the lowest in TBP% (15.8% ± 0.6) and TBW% (53.9% ± 2.1). The Group 1 pups were significantly larger than Group 3 pups in TBP% (18.9 ± 0.6%, p< 0.01), and TBW% (63.9 ± 3.1%, p< 0.01). In addition, the Group 2 pups which were closer in age were also
  • 43. 30 significantly larger than the Group 3 pups with an 18.4 ± 0.4% TBP average (p< 0.01) and 62.7 ± 1.5% TBW average (p< 0.01). Table 3: Initial and post-transition thyroid hormone measurements for total thyroxine (tT4; nmol L-1 ), total triiodothyronine (tT3; nmol L-1 ), free thyroxine (fT4; ρmol L-1 ), and free triiodothyronine (fT3; ρmol L-1 ). Animal I.D. tT4 tT3 fT4 fT3 Group 1 #71 Initial 56.0 1.2 17.0 1.6 Post 10.0 0.3 8.0 0.7 #00 Initial 30.0 0.9 14.0 1.0 Post - - - - #60 Initial 35.0 0.7 13.0 0.8 Post 7.0 0.3 8.0 0.5 Group 2 #11 Initial 42.0 1.1 16.0 1.6 Post 14.0 0.6 8.0 0.7 #19 Initial 48.0 1.2 21.0 1.0 Post 10.0 0.6 14.0 0.6 #38 Initial 40.0 1.2 18.0 1.1 Post 17.0 0.6 13.0 0.7 Group 3 #27 Initial 36.0 0.9 17.0 1.0 Post 16.0 0.5 14.0 0.5 #65 Initial 35.0 0.8 17.0 1.1 Post 10.0 0.5 11.0 0.4 #20 Initial 41.0 1.4 18.0 1.7 Post 16.0 0.8 10.0 0.7
  • 44. 31 Transition Period After being separated from their mothers, pups experienced an initial period of mass loss as the full availability of their mother’s milk was replaced with a reduced diet of only a few fish. Food amounts consumed were gradually increased at the discretion of the zoological animal care staff with every effort being made to increase daily intake totals uniformly between groups. Nutrient value assessment was conducted by ABC laboratories on the fish used by SeaWorld in this study and energy calculations were estimated assuming 1 calorie is equivalent to 4.184 kilojoules. The herring used during the transition to a solid food diet for Group 1 pups and Group 2 pups was 16.5% protein, 14.0% fat, and 67.0% water with a caloric density of 1661 kJ kg-1 . Herring used for the Group 3 pups differed in composition having 18.6% protein, 7.1% fat, and 72.0% water with a caloric density of 1192 kJ kg-1 . As capelin was eventually introduced to the pup’s diet, all three groups consumed capelin composed of 13.5% protein, 3.1% fat and 80.9% water with a caloric density of 713 kJ kg-1 . This initial transition period for the individual sea lion pups as they adapted to a solid fish diet encompassed two different turning points in their development. The day that they began to voluntarily consume fish was a behavioral turning point that differed between groups. Group 3 pups began eating voluntarily significantly earlier (16.3 ± 0.6 d) than Group 1 pups (21.7 ±1.5 d, p< 0.05) and Group 2 (21.0 ± 1.7 d, p< 0.05), while the latter two groups were not significantly different from each other. More importantly, the day in which the pups stopped losing body mass and began a recovery period of growth and development was a physiological turning point that was also different between groups. Group 1 pups took significantly longer to begin gaining mass
  • 45. 32 (31.7 ± 1.2 d) than their older counterparts. Group 3 pups were the quickest group to reverse trend and recover lost body mass (20.7 ± 4.0 d, p< 0.01) while Group 2 pups were similar to Group 3 pups (24.3 ± 4.5 d, p< 0.01). All groups began recovery after they had commenced voluntary consumption of fish. The difference between the date voluntary consumption commenced and the date the body began recovery was significantly greater in the Group 1 pups (10.0 ± 1.7d) than both Group 2 pups (3.3 ± 3.1 d, p= 0.02) and Group 3 pups (4.33 ± 3.8 d, p= 0.04). There were no significant differences between the amounts of food given to the pups during the transition period. All pups were given just one fish on the first day after separation and their intake increased throughout the transition period. Herring was offered exclusively up until just days before voluntary fish consumption commenced. Once pups began eating food voluntarily, they were offered as much fish as they wanted. Total food intake average (mean: 1.83 ± 0.22 kg d-1 , range: 1.47 – 2.20) and average rate of intake increase (+0.12 ± 0.04 kg d-1 ) for the pups was consistent between groups. Group 1 pups had an overall average of 1.72 ± 0.08 kg d-1 consumed during the transition period with an average daily increase of 0.10 ± 0.01 kg d-1 . Group 2 pups averaged 1.97 ± 0.20 kg d-1 of fish intake with a daily increase of 0.12 ± 0.04 kg d- 1 , while Group 3 pups averaged 1.78 ± 0.30 kg d-1 of fish intake with a daily increase of 0.15 ± 0.04 kg d-1 . By the last day of their respective transition periods, the pups were consuming an average of 3.18 ± 0.20 kg d-1 , 2.78 ± 0.69 kg d-1 , and 3.04 ± 0.22 kg d-1 respectively. However when taking into consideration the energy density of the herring and eventual capelin consumed, there were significant differences between the groups. Group 2 pups had an overall average of 15,455 ± 1251 kJ d-1 consumed that was significantly greater than the Group 1 pups (11,326 ±
  • 46. 33 138 kJ d-1 , p< 0.01) and Group 3 pups (10,309 ± 1,736 kJ d-1 , p< 0.01). For average daily energy increase it was the Group 3 pups that had an average of 878 ± 230 kJ d-1 that was significantly greater than the Group 1 pups average increase of 556 ± 27 kJ d-1 (p= 0.04), but insignificant from the Group 2 pups average of 866 ± 294 kJ d-1 . Despite these differences, all three groups averaged around 15,062 kJ of intake at the time they reached their lowest body mass and began recovery. This was computed by averaging each pup’s daily intake for the six days surrounding its date of lowest total body mass (date of lowest TBM ± 3 d) and using this total to determine the group average. Group 1 pups were consuming an average of 15,133 ± 1,079 kJ when they began the recovery phase, Group 2 pups consumed 15,183 ± 2,568 kJ, and the Group 3 pups consumed 14,945 ± 4,786 kJ. Group 1 pups lost an average of -8.5 ± 1.6 kg during the initial transition equal to -21.5 ± 3.3% of TBM with an average loss of -0.27 ± 0.04 kg d-1 . Group 2 pups averaged -6.8 ± 1.4 kg of TBM or -17.1 ± 3.2 % of initial mass, losing an average of -0.29 ± 0.10 kg d-1 . Lastly, Group 3 pups lost -5.9 ± 0.91 kg or -15.3 ± 3.4% of their initial TBM with an average loss of -0.30 ± 0.03 kg d-1 . With these values, there was no significant difference in rate of mass loss between groups, however there was a significant difference in mean mass loss between Group 3 pups and Group 1 pups (p= 0.04), and the differences in percentage of mass loss were significant between Group 1 pups and Group 3 pups (p< 0.05), but not significant between Group 1 pups and Group 2 pups (p= 0.09). Loss in body mass was also evident in girth and blubber depth changes. Changes in axillary girth measurements had the smallest variability between groups and were not
  • 47. 34 significantly different from each other, but all of the umbilical and hip average girth measurements were statistically different. Younger pups lost more girth than older pups (Table 1). The Group 1 pups umbilical (-11.2 ± 1.8 cm) and hip locations (-14.2 ± 3.3 cm) showed a greater reduction in girth loss compared to both Group 2 pups (-7.50 ± 0.50 cm (p= 0.01) / -7.17 ± 1.53 cm (p= 0.02)) and Group 3 pups (-4.17± 2.57 cm (p< 0.01) / -2.33 ± 3.06 cm (p< 0.01)). Though less than Group 1 pups, the losses in girth at the umbilical and hip locations in Group 2 pups were significantly greater than that in the Group 3 pups (p< 0.05 / p= 0.04). During the transition period, overall average blubber depth across all locations increased by 1.6 ± 0.9 cm in Group 1 pups, while decreasing in the Group 2 pups (-0.3 ± 0.9 cm, p= 0.03) and Group 3 pups (-0.4 ± 0.2 cm, p< 0.01). Though Group 1 began the transition period with significantly less overall blubber depth, the overall group blubber depth averages were not significantly different by the end of the transition period (4.0 ± 0.8 cm, p>0.05). All pups showed significant change in lateral axillary blubber depth with Group 1 pups gaining the most blubber (+2.11 ± 0.96 cm) in this region compared to smaller gains in Group 3 pups (+0.78 ± 0.38 cm) and losses in Group 2 pups (-0.28 ± 0.59 cm). Blubber losses of Group 2 pups were also significantly different from gains showed by by Group 3 pups (p = 0.045). Younger Group 1 pups also differed significantly at the dorsal axillary location (+2.00 cm ± 0.00) compared to Group 3 pups (-1.11 cm ± 0.51, p< 0.01), the dorsal umbilical location (+2.67 cm ± 1.45) compared to Group 2 (-0.22 cm ± 1.17, p= 0.03) and Group 3 pups (-1.28 cm ± 0.92), and the lateral umbilical location (+1.56 cm ± 0.51) compared to both the Group 2 pups (-0.44 cm ± 1.07, p= 0.02) and Group 3 pups (+0.50 cm ± 0.24, p= 0.04).
  • 48. 35 Blood glucose changes varied greatly especially within Group 1 pups (-26.67 ± 11.50 mg dL-1 ) but also between Group 2 pups (-44.33 ± 5.86 mg dL-1 ) and Group 3 pups (-36.67 ± 7.77 mg dL-1 ) (Figure 2). Group 2 pups had significantly greater changes in blood glucose levels compared to Group 1 pups (p= 0.03). Blood glucose levels did not show strong significant correlation with body mass (Pearson’s Coefficient, r= 0.19), total body lipid mass (kg) (r= 0.24), or total body protein mass (kg) (r= 0.06). Blood urea nitrogen levels all increased on average, with the Group 3 pups experiencing the smallest change from their initial measurement (+9.33 ± 3.21 mg dL-1 ) (Figure 3). This was significantly less than both Group 2 pups (+15.00 mg ± 2.00 mg dL-1 , p= 0.03) and Group 1 pups (+19.00 ± 4.58 mg dL-1 , p= 0.02). Blood urea nitrogen levels did not show strong correlation with body mass (r= -0.55), total body lipid (r= -0.32), or total body protein (r= 0.06). All thyroid hormone levels for all pup groups decreased during the transition period though they were not significantly different from each other (Figures 4-7). The overall average for changes in tT4 during the transition period was +29.1 ± 8.6 nmol L-1 (range: 20-46), for tT3 was +0.5 ± 0.2 nmol L-1 (range: 0.3-0.9), for fT4 was +6.4 ± 2.0 nmol L-1 (range: 3.0-9.0), and fT3 was 0.6 ± 0.3 nmol L-1 (range: 0.3-1.0). Group 1 pups had tT4 levels decrease -37.0 ± 12.7 nmol L-1 , tT3 decrease -0.7 ± 0.1 nmol L-1 , fT4 decrease -7.0 ± 2.8 ρmol L-1 , and fT3 decrease - 0.6 ± 0.4 ρmol L-1 . The Group 2 pups had similar averages with tT4 (-29.7 ± 7.6 nmol L-1 ), tT3 (- 0.6 ± 0.1 nmol L-1 ), fT4 (-6.7 ± 1.5 ρmol L-1 ) and fT3 (-0.6 ± 0.3 ρmol L-1 ) all decreasing. Similarly, decreasing tT4 (-23.3 ± 2.9 nmol L-1 ), tT3 (-0.4 ± 0.2 nmol L-1 ), fT4 (-5.7 ± 2.5 ρmol
  • 49. 36 Figure 2: Changes in individual blood glucose values over time. Pups #71, #00, #60 weaned at 5 mo. (Group 1), pups #11, #19, #38 weaned at 7 mo. (Group 2), and pups #27, #65, #20 weaned at 9 mo. (Group 3).
  • 50. 37 Figure 3: Changes in individual blood urea nitrogen values over time. Pups #71, #00, #60 weaned at 5 mo. (Group 1), pups #11, #19, #38 weaned at 7 mo. (Group 2), and pups #27, #65, #20 weaned at 9 mo. (Group 3).
  • 51. 38 Figure 4: Changes in individual total thyroxine (tT4) hormone levels over time. Pups #71, #00, #60 weaned at 5 mo. (Group 1), pups #11, #19, #38 weaned at 7 mo. (Group 2), and pups #27, #65, #20 weaned at 9 mo. (Group 3).
  • 52. 39 Figure 5: Changes in individual total triiodothyronine (tT3) hormone levels over time. Pups #71, #00, #60 weaned at 5 mo. (Group 1), pups #11, #19, #38 weaned at 7 mo. (Group 2), and pups #27, #65, #20 weaned at 9 mo. (Group 3).
  • 53. 40 Figure 6: Changes in individual free thyroxine (fT4) hormone levels over time. Pups #71, #00, #60 weaned at 5 mo. (Group 1), pups #11, #19, #38 weaned at 7 mo. (Group 2), and pups #27, #65, #20 weaned at 9 mo. (Group 3).
  • 54. 41 Figure 7: Changes in individual free triiodothyronine (fT3) hormone levels over time. Pups #71, #00, #60 weaned at 5 mo. (Group 1), pups #11, #19, #38 weaned at 7 mo. (Group 2), and pups #27, #65, #20 weaned at 9 mo. (Group 3).
  • 55. 42 L-1 ), and fT3 (-0.7 ± 0.3 ρmol L-1 ) values were evident in Group 3 pups as well. Thyroid hormone levels were weakly correlated with body mass. Values for tT4, fT4, and tT3 had weak positive correlations (r= 0.52, r=0.36, and r= 0.47 respectively) with total body mass while fT3 was weakly negatively correlated (r= -0.01). Analysis of changes in deuterium dilution values revealed that there were no significant differences in TBL%, TBP% and TBW% body composition changes between groups. Overall TBP (kg) and TBW (kg) did correlate in the pups with changes in TBM (r= 0.82 and r= 0.82 respectively). Body composition percentage changes in the pups revealed an average change of +1.3 ± 0.9% in TBP% (range: -0.7–2.31), loss of -6.4 ± 3.6% in TBL% (range: -10.8-0.4), and gain of +4.7 ± 3.1% in TBW% (range: -2.3-7.9). Group 1 pups lost TBL% (-8.2 ± 2.2%) while gaining TBP% (+1.6 ± 0.7%) and TBW%.(+6.0 ± 1.6%). Group 2 pups also experienced a decrease of TBL% (-4.5 ± 5.0%), while having a slight increase in TBP% (+0.7 ± 1.2%), and an increase in TBW% (+2.4 ± 4.2%). Likewise, Group 3 pups had a loss in TBL% (-6.5 ± 3.3%), with a gain in TBP% (+1.8 ± 0.2%) and TBW% (+6.0 ± 0.7%). Recovery Period Total body mass gained was not significantly different between groups during the recovery period (+30 days) (mean: 6.9 ± 3.9 kg, range: 2.3-15.5). Group 1 gained +6.82 ± 1.98 kg, Group 2 pups gained +5.00 ± 1.21 kg, and Group 3 pups gained +9.02 ± 6.59 kg. Likewise, the rate of mass gain during the recovery phase was insignificant (mean: +0.2 ± 0.1 kg d-1 , range 0.1-0.5) Individual group comparisons reveal an increase of +0.23 ± 0.07 kg d-1 for Group 1 pups, +0.17 ± 0.04 kg d-1 for Group 2 pups, and +0.30 ± 0.22 kg d-1 for Group 3 pups.
  • 56. 43 Percentage changes in body mass were also not significantly different (mean: 20.8 ± 11.1%, range: 8.4-45.4). All groups increased with the Group 1 pups increasing +21.4 ± 6.3%, Group 2 pups increasing +15.2 ± 4.8%, and Group 3 increasing +25.9 ± 18.6%. However, one member of the Group 3 pups (#65) experienced an uncharacteristic loss of appetite and reduction in mass gained during this 30 day recovery period. Pup #65 later received a diagnosis of acute anemia which may have contributed to her appetite and loss of body mass. If her body mass data from the recovery period was excluded from statistical consideration due to this abnormal health condition, the remaining members of Group 3 had an average body mass increase of +12.39 ± 4.35 kg, an average rate of mass gain of +0.41 ± 0.14 kg d-1 , and a percentage of body mass change of 34.7 ± 15.0%. This would be a significantly greater amount of body mass increase than the Group 2 pups (p= 0.03) but not significantly more than the Group 1 pups (p= 0.07) pups. Similarly, without pup #65 the average rate of mass gain for this group was significantly greater than Group 2 pups (p= 0.02) and not significantly greater than Group 1 pups (p= 0.06). The percentage of body mass change for this group however was not significantly greater than the Group 2 pups (p= 0.06) and was not statistically different from Group 1 pups either. Determining the timing of a pup’s physiological shift toward recovering lost mass and maintaining healthy growth was difficult to predict and consequently occurred at the end of our sampling period in most of the sea lions. Therefore, most of the parameters except TBM were not measured during this period. Three sea lion pups (#11 and #38 from Group 2, and #20 from Group 3) had measurements taken for girth and blubber depth after transitioning into the recovery period (Tables 1 and 2). For each pup the last set of measurements came fifteen days
  • 57. 44 after the date of lowest body mass and at the halfway point of the established thirty day recovery period for statistical purposes. For the following set of girth and blubber depth results, a comparison was made from the date of lowest TBM to the last measurement fifteen days later. Pup #11 from Group 2 gained girth at all three locations (axillary / umbilical / hips) (+5.0 cm / +4.0 cm / +4.0 cm) and lost blubber depth at all but the dorsal axillary location (dorsal axillary / lateral axillary / dorsal umbilical / lateral umbilical / dorsal hips / lateral hips) (+0.3 cm / -1.0 cm / - 1.3 cm / -1.3 cm / -2.0 cm / -0.3 cm). Another pup from Group 2, pup #38, gained girth in the axillary (+3.0 cm) and umbilical locations (+1.0 cm) while losing in the hip location (-0.5 cm). Blubber depth values for pup #38 were mixed with some locations gaining and some losing (dorsal axillary / lateral axillary / dorsal umbilical / lateral umbilical / dorsal hips / lateral hips) (- 1.7 cm / +0.7 cm / -2.0 cm / +1.0 cm / +1.3 cm / +1.0 cm). Pup #20 was the only pup in Group 3 to have measurements beyond the physiological turning point of lowest body mass. This pup lost axillary girth (-2 cm) while gaining umbilical girth (+3.5 cm) and maintaining the same hip girth. Blubber depth for pup #20 decreased in all areas except for the dorsal axillary location where it maintained the same depth (dorsal axillary / lateral axillary / dorsal umbilical / lateral umbilical / dorsal hips / lateral hips) (0.0 cm / -1.3 cm / -1.3 cm / -2.4 cm / -0.3 cm / -0.67 cm). The blood parameters of glucose, urea nitrogen, and thyroid levels were also available for these three pups. Pup #11 had a blood glucose level that fell (-20.0 mg dL-1 ), a BUN value that increased (+12.0 mg dL-1 ), and thyroid levels that remained unchanged or increased (tT4 / tT3 / fT4 / fT3) (+4.0 nmol L-1 / 0.0 nmol L-1 / +8.0 ρmol L-1 / -0.2 ρmol L-1 ). Pup #38 had an increase in glucose level (+15.0 mg dL-1 ), no change in BUN, and increasing or unchanged thyroid levels
  • 58. 45 (tT4 / tT3 / fT4 / fT3) (+3.0 nmol L-1 / +0.1 nmol L-1 / +3.0 ρmol L-1 / 0.0 ρmol L-1 ). Lastly, pup #20 from Group 3 had both increasing blood glucose (+11.0 mg dL-1 ) and BUN (+14.0 mg dL-1 ) values, and decreasing or unchanged thyroid levels (tT4 / tT3 / fT4 / fT3) (-4.0 nmol L-1 / -0.1 nmol L-1 / 0.0 ρmol L-1 / 0.0 ρmol L-1 ). Other Variables Although extreme changes in weather could affect the amount of energy needed to maintain homeostasis and thus increase metabolism and potential growth, average daily weather temperature was not significantly different between groups and did not correlate with changes in body mass (Pearson’s Coefficient, r= 0.032). All time intervals measured showed insignificant results. Time elapsed from blood collection to the time a prepared sample was placed into the freezer was the longest time interval recorded and potentially the most variable. However, there were no significant differences between groups with the average time being 90 ± 3 min between blood collection and the processed sample being placed within the freezer. Mannisto et al. (2007) determined that there was no significant effect on thyroid hormones levels when samples were kept at room temperature (22º C) for up to 4 days (Mannisto et al., 2007). As the study group consisted of two female pups and seven male pups, any sex specific differences were examined as the pups progressed through the study. Male pups started the transition to solid food with a significantly greater total body mass (41.0 ± 2.2 kg) than the
  • 59. 46 females (34.8 ± 2.3 kg, p<0.01), which was due to a greater total body protein (TBP) mass (7.5 ± 0.3 kg) than the females (5.9 ± 1.2 kg, p< 0.01) and a greater total body water (TBW) mass (25.3 ± 1.0 kg) than the females (20.3 ± 4.1 kg, p< 0.01). After the transition phase and at their lowest total body mass, the male pups had maintained their significant differences in these areas of body composition with greater total TBP (kg) (6.7 ± 0.4 kg), TBP% (19.8 ± 1.3%), TBW (kg) (23.0 ± 1.4 kg), and TBW% (67.5 ± 4.4%) than the females TBP (kg) (5.4 ± 0.8 kg, p< 0.01), TBP% (17.6 ± 0.5%, p= 0.03), TBW (kg) (18.3 ± 2.8 kg, p< 0.01), and TBW% (60.1 ± 1.7%, p= 0.03). All other parameters including growth rates, between males and females, did not differ significantly throughout the present study.
  • 60. 47 DISCUSSION Weaning age of ex situ California sea lion pups was a factor in initial total body lipid percentages, change in body mass, blubber depth, girth, blood urea nitrogen, and blood glucose as they progressed through the process of transitioning to eating solid food in this study. The amount of research on pinnipeds has grown considerably over recent decades covering a broad range of topics. Numerous studies have examined health in adult pinnipeds with studies focusing on body condition parameters such as changes in lipid and protein content determined through hydrogen isotope dilution (Rutishauser et al., 2004; Kumagai, 2006), morphometric parameters such as blubber depth and girth (Worthy et al., 1992; Mellish et al., 2007), as well as blood parameters such as thyroid hormones (Ortiz et al., 2001; Ortiz et al., 2003; Debier et al., 2005), blood urea nitrogen and blood glucose (Roletto, 1993). Additionally, research has been conducted on pinnipeds during natural seasonal fluctuations in body condition (Kastelein et al., 2000), changing environmental conditions like El Niño (Trillmich et al., 1985; Heath et al., 1991; Trillmich et al., 1991), and health crises such as unusual mortality events affecting a population (Yochem et al., 2009). Research has also been conducted on the anthropogenic effects that cause prey-shift in pinnipeds due to resource competition (Rosen and Trites, 2002; Trites and Donnelly, 2003) though the focus has been on the more robust adult populations. Many recent studies conducted on pinniped pups have focused on the nursing period or post-weaning fast in phocid species (Iverson et al., 1993, Mellish et al., 1999, Muelbert et al., 2003; Shulz and Bowen, 2005). Previous research on otariid pups has focused on maternal investment and pup development during the nursing period before weaning (Oftedal et al., 1987b, Trites et al., 2006. Few studies have compared California sea lion pup health pre- and post-weaning (Kastelein et
  • 61. 48 al., 2000). The present study was designed to build on the methods and findings of these previous research projects while examining an important period in the life history of ex situ California sea lions. It is the first to physiologically explore the “prey-shift” that occurs when these otariid pups in a zoological setting make the abrupt transition to an unfamiliar solid food diet. The results of the present study could further improve zoological population management, as well as provide results that could be useful for effective rehabilitation of sick and injured free- ranging sea lion pups and improve their chances of survival upon return to their natural environment. In addition, it provides insight into the physiological reaction sea lion pups can have to a sudden accelerated implementation of the natural process of weaning - which may prove beneficial when studying in situ populations that must adjust to similar circumstances. Statistical analysis revealed several variables with significant results, a few correlations between variables, and some interesting trends in the overall data. From a broad perspective, initial body mass was expected to be larger in these ex situ pups versus their free-ranging counterparts as they had greater opportunity to nurse as the mothers did not need to leave their pups in order to forage. Ex situ pup groups in the present study were either significantly greater or equal in size and TBL% to their same-age in situ counterparts (Table 1). In situ California sea lions on San Nicolas Island (SNI) (119º 30’ W, 33º 15”N) and Aňo Nuevo Island (ANI) (122º 20’W, 37º6’N) were examined over the course of several months from 1988 to 1991 using tritium dilution to estimate total body lipid values (Worthy and Costa, unpubl. data). Overall axillary blubber depth measurements of the in situ pups by Worthy and Costa (unpubl.) were calculated as the average of both the dorsal and lateral axillary ultrasound measurements. A
  • 62. 49 direct comparisons was made with the average overall axillary blubber depth values computed in the same manner from the ex situ pups in this study. The five month old ex situ pups in this study had significantly greater body mass (p< 0.01), axillary girth (p< 0.01), and axillary blubber depth (p< 0.01) compared to the 5 month old in situ pups. Total body lipid percentage was the only value that was not significantly different between the ex situ and in situ pups. The comparison between Group 3 pups was similar with significantly greater axillary blubber depth (p< 0.01) and TBL% (p= 0.01) in the ex situ pups, but showed no evidence that they were different in body mass or axillary girth. Within the present study, initial blubber depths in Group 2 and Group 3 pups were significantly thicker in the dorsal umbilical and dorsal hip region, which could indicate that the dorsal umbilical and dorsal hip areas of the pup may be located within an area receiving greater initial growth in blubber deposition between the ages of 5 and 7. Blubber density is generally not uniform across the body (Hoopes, 2007). Oftedal et al. (1987b) found that younger 1-2 month old nursing California sea lion pups utilized their energy consumption primarily for growth and development as opposed to blubber deposition, however Thompson et al. (1987) found that blubber deposition became a higher priority for pups closer to weaning. This may be due to their primarily terrestrial nature as very young non-precocial pups remain on the beach waiting for their mothers to return from foraging trips. However, as they get older they begin to venture into the water’s edge to explore; exposing them to the much colder marine environment. Thompson et al. (1987) states that increased heat loss due to submersion underwater causes the
  • 63. 50 Table 4: The initial measurements of body mass (kg), axillary girth (cm), axillary blubber depth (cm), and total body lipid percentage for this project’s ex situ sea lion pups (5mo and 9mo) compared to same-aged in situ pup data from San Nicolas Island (SNI) and Aňo Nuevo Island (ANI) (1988–1991) (Worthy and Costa, unpubl. data). Age Bracket Body Mass (kg) Axillary Girth (cm) Axillary Blubber Depth (cm) Total Body Lipid (%) 5mo ex situ (n=3) 39.7 ± 1.2 85.3 ± 2.9 2.3 ± 0.1 12.5 ± 4.3 5mo in situ (n=19) 26.6 ± 5.2 70.6 ± 5.3 1.5 ± 0.2 15.1 ± 2.4 9mo ex situ (n=3) 39.3 ± 5.7 82.5 ± 2.3 3.7 ± 0.9 24.9 ± 4.7 9mo in situ (n=16) 38.7 ± 8.0 79.0 ± 7.8 1.5 ± 0.2 17.1 ± 4.9
  • 64. 51 Figure 8: Body mass data of estimated 5, 9, 10, and 13 month old in situ California sea lion (Zalophus californianus) pups from San Nicolas Island and Aňo Nuevo Island (1988-1991) (Worthy and Costa, unpublished data).
  • 65. 52 poorly insulated pups to divert energy away from growth and toward blubber production. The time frame between the Group 1 and Group 2 age brackets in this study coincide with the natural six month old time frame that free-ranging sea lion pups begin to experiment catching prey on their own (Peterson and Bartholomew, 1967; Odell, 1972). This is particularly poignant when you examine the change in body mass, percentage of mass loss, girth, and blubber depth that occurred in the Group 1 pups as they progressed through the transition period. Starting with similar body mass to the other two age brackets and the highest TBP% and TBW% (thus lowest TBL%), Group 1 pups proceeded to lose significantly more body mass, resulting in a significantly higher percentage of mass loss and significantly greater loss of girth in the umbilical and hip locations – all while gaining blubber depth across all locations. Group 1 pups managed to gain blubber depth despite losing a greater amount of total body mass. This suggests that either protein or visceral lipid deposits were being utilized up to this point by Group 1 pups to maintain physiological homeostasis. Though small amounts of protein catabolism are required for gluconeogenesis, the degradation of too much protein could eventually prove fatal as internal organs are compromised (e.g. Castellini and Rea, 1992). All initial values of blood glucose, blood urea nitrogen, total triiodothyronine, and free triiodothyronine measured in the study groups were normal but not significantly different from each other. In addition, both total and free thyroxine values were normal but not significantly different in Group 1 pups, while only free thyroxine levels in Group 2 pups were normal and not significant. This could be an indication that despite the age difference all groups began this transition to solid food in relatively the same metabolic state. All pups experienced a gradual
  • 66. 53 decrease in blood glucose in the first week after separation from their mothers with the majority having their final glucose measurement lower than their initial starting value. Blood glucose values found within the overall study group (mean: 143.3 mg dL-1 , range: 111-218) largely fell well within the normal range seen in free-ranging California sea lions (43-205 mg dL-1 ) (e.g. Roletto et al. 1993) and within normal ranges observed in ex situ sea lions at SeaWorld (70-200 mg dL-1 ). Pup #19 (Group 2) was an exception with one value measuring outside the range at 218 mg dL-1 , though this was within the normal glucose ranges seen in the phocid harp seals (88- 218 mg dL-1 ) and hooded seals (135-283 mg dL-1 ) (e.g. Boily et al., 2006). The blood sample that measured a blood glucose of 218 mg dL-1 was hemolyzed, which could have caused the abnormal increase in glucose measured as the contents of red blood cells are inadvertently released into the serum. Two other pups (#60 and #65) had spikes in blood glucose during the transition period (Figure 2) with samples that were not hemolyzed. Another factor that can increase blood glucose is bleeding or ulceration in the gastrointestinal tract. This is a possibility in the present study as the deuterium was administered through gastric intubation. Blood glucose levels also fluctuate throughout a given day by elevating rapidly for a few hours after meals, however they usually are at their lowest after a fast. Given that the pups in the present study were subjected to an overnight fast before blood samples were taken, the results would likely be an overall indication that the lipid body stores were being utilized to meet energy demands. With lipid stores already at a minimum in developing sea lion pups, a continuation of this process could cause a problem described by Rosen et al. (2007) as a spiral effect where catabolism of the lipid layer reduces insulation, causing an increase in heat loss, which in turn causes an increasing need for more lipid catabolism.
  • 67. 54 The blood urea nitrogen levels measured in the present study (mean: 25.2 mg dL-1 , range: 10-43) fell within the lowest part of the wide 15-159 mg dL-1 range seen with in situ sea lions by Rolleto et al (1993) and largely within the normal range seen in the zoological populations at SeaWorld (14-38 m dL-1 ). With the exception of pups # 38 and # 65 (Group 2 and 3 respectively) all pups started or dipped below this normal range. BUN increased gradually over the course of the study with the final measurements being at or near the highest values recorded. Elevated BUN levels have been utilized in past studies as an indicator of starvation in pups as internal lean body mass was being compromised (e.g. Rea et al., 1998; Trumble and Castellini, 2002), though this has been inconsistent as Worthy (1982) observed no difference in BUN levels in harp seal pups as they transitioned from fasting to feeding. In the present study however, most of the values were within normal range. Although there was a steady upward trend in BUN seen throughout the study period, this may be an effect of the higher-protein fish diet being steadily introduced to the pups, and revealing a shift from a lower normal nursing BUN level to a slightly higher normal adult-diet BUN level. Total thyroxine levels (tT4) in the pups (mean: 21.1 nmol L-1 , range: 5.0-50.0) were comparable to the normal range of tT4 levels in other pinnipeds such as in the post weaning free- ranging elephant seal pups in Ortiz et al. (2003) (17-55 nmol L-1 ) as well as the free-ranging juvenile California sea lion pups in Debier et al. (2005) (9.0-44.5 nmol L-1 ). All pups saw a decrease in total thyroxine levels throughout the study. Likewise, total triiodothyronine (tT3) values in the pups (range: 0.3-1.4, mean 0.7 nmol L-1 ) were within the normal ranges of tT4 found by Ortiz et al. (2001) (0.4-1.2 nmol L-1 ) in free-ranging elephant seal pups and found by
  • 68. 55 Debier et al. (2005) (0.28-0.84 nmol L-1 ) in juvenile free-ranging California sea lion pups. The thyroxine levels in this study were not significant and did not strongly correlate with body mass as observed by Ortiz et al. (2003) in free-ranging elephant seals, and by Kumagai (2004) in free- ranging Steller sea lions. Thyroid hormone levels generally increase in the blood during periods of increased metabolism which is why neonates have been found to have increased serum concentration levels to facilitate increased growth and development (e.g. Ronald and Dougan, 1982). Conversely, a decrease in thyroid hormones can also be an indication of a fasting body state in order to conserve energy (e.g. Ortiz et al. 2003). In all, thyroid hormone levels appeared to decline throughout the study period with the tT4 and tT3 levels falling more uniformly, possibly due to mass loss and the need to conserve body condition. Despite the efforts of zoological personnel to maintain similar food intake levels (1.83 ± 0.22 kg d-1 ) between the groups and uniformly increase intake totals (+0.12 ± 0.04 kg d-1 ), results show that the age groups physiologically responded differently. A difference in caloric intake resulted in the Group 2 pups receiving significantly more calories than the other two groups. However, this caloric difference did not result in significantly different growth and body composition for the Group 2 pups compared to the other two groups. Group 2 pups shared similar values to that of Group 1 pups such as a significantly greater initial TBP% and TBW%, as well as greater loss in girth at the umbilical and hip locations than Group 3 pups. In addition, the Group 2 pups began eating food voluntarily at about the same time as the Group 1 pups. However, Group 2 pups shared characteristic with Group 3 pups as well. Blubber depths for the
  • 69. 56 Group 2 pups decreased across all six locations as in the Group 3 pups, and Group 2 started recovery in similar time to the Group 3 pups. Total body mass was the only measurement regularly taken with all pups after the sampling period and before their return to the general population. The Group 3 pups in particular had significant results during this period. At the start of the study Group 3 pups began with significantly more total body lipid content (kg and %), began voluntarily eating solid food significantly sooner, and maintained more lipid mass throughout the transition period. During the recovery phase, the mass gain and rate of mass increase was highest in the Group 3 pups though it was not significant due to the much lower values for pup #65. Pup #65 had undergone treatment for acute anemia by the SeaWorld veterinary team during the recovery portion of this study after the pup had already begun consuming fish voluntarily. Pup #65 exhibited the clinical signs of a reduced appetite and stagnant growth in body mass and condition. This may be attributed to the reduction in stomach acid secretion that limits nutrient absorption during anemia (e.g. Smith, 2010). Although Kumagai (2004) mentions that glucose levels often spike during anemic conditions, this was not observed during this period with pup #65. Excluding her non- normal values from consideration, Group 3 pups had a significantly greater mass gain and rate of mass increase during the recovery phase that lasted 30 days beyond the date of lowest total body mass.