Perception-based model for analyzing the impact of enterprise blockchain adoption on SCM in the Indian service industry
1. 1.1. Introduction
Blockchain has recently received a great deal of public attention and is believed to have the
potential to disrupt various areas of application. Blockchain is defined as “a decentralized,
encrypted electronic distributed ledger which acts as an immutable, incorruptible linear event
database of information/ transactions shared between networked members” (Risius & Spohrer,
2017). The blockchain applications utilized by public/private/government organizations are
permissioned blockchains. Such blockchains are also commonly known as enterprise
blockchains (EBCs). This essay aims to highlight the current perception of EBC in the Indian
service industry from a supply chain management (SCM) perspective to provide direction to
the current stage of EBC development. This essay also aims to find the origin of the value
perceptions of EBC (hype-based or benefits-based) in the Indian service industry. This essay
highlights the SCM dimensions that are perceived to be improved by EBC adoption and
identifies the SCM dimensions to which EBC adoption can contribute to incremental profits.
A research model is proposed, which, in its current or extended form, can be utilized by
researchers to examine industry perceptions of EBC at different stages of EBC development.
We also test the moderating effects of five organizational factors on the hypothesized
relationships.
Technological advancement and adoption began to enter the service industry in the post
industrial revolution era (Collier, 1983). Since the evolution of the internet, organizations have
been adopting novel information technologies and information systems to provide competitive
customer service and to enhance firm value (Chuang & Lin, 2015; Law et al., 2014). Such
technologies, adopted to deliver services, are referred to in the literature as e-services, and they
are defined as “the use of new information technologies via the internet to enable, improve,
15enhance, transform, or invent a business process or system to complete tasks, solve problems,
conduct transactions, or create value for current or potential customers” (Benaroch & Appari,
2011). An example of an e-service in the service industry is e-health, which means the “use of
information and communication technologies (ICT) for health” (Chang et al., 2017; Eysenbach,
2001). A service industry that has seen a significant rise in ICT adoption is the tourism industry
(Ariffin & Hashmi, 2018). The research shows that 70% of the world’s GDP is generated by
the service industry (Lanz & Maurer, 2015).
There is a great necessity for novel technologies in the service industry (Leite & Vieira, 2015;
Morlock & Meier, 2015; Weigel, 2000). Today, the service industry is equipped with a range
of information and communication technologies such as Enterprise resource planning (ERP),
Global Positioning System (GPS), Radio frequency identification (RFID) sensor and barcode
technologies. These technologies are not integrated and hence do not facilitate the visibility of
data across service supply chains (Tan et al., 2018). The current digital economy relies on
trustworthy third-party service providers to ensure its smooth day-to-day functioning. A third
party could be the bank that informs us money has been delivered to an account, it could be the
email service provider that lets us know our email has been delivered, it could be the logistics
provider that tells us our parcel has been delivered, or it could be the doctor who provides our
medical prescriptions. We rely on these organizations with centralized databases for the
preservation and security of our digital assets. However, centralized databases are prone to
hacking and manipulation (Crosby et al., 2016).
Lower trust levels and tedious sequential information exchanges among supply chain actors
result in increases in trade risks and reductionsin service quality (Tan et al., 2018). The service
industry must address its infrastructure for providing services. The service industry must also
manage its product supply chains. Intermediaries in a supply chain generate significant
transaction costs. These centralized intermediaries have control of their data at various stages
16of the supply chain, which contributes to information asymmetry among supply chain actors
and generates transaction costs (Lützenburg, 2017). The centralized intermediaries also
contribute to the lack of visibility in the service supply chain. Due to rapid growth in the service
industry, organizations are significantly focused on improving operational efficiency and
2. effectiveness (Furterer, 2016; LaGanga, 2011).
This essay aims to present insights that can provide guidance for EBC development.
Technology development requires significant investment; hence, investors’ primary concern is
the demand side of the technology. A few of the factors that affect technology demand and the
direction of technology development (such as EBC) are as follows: the current technological
knowledge of industry practitioners (Erzurumlu & Erzurumlu, 2013; Raguseo, 2018), the
current technology market (Erzurumlu & Erzurumlu, 2013; Mansfield, 1968; Miller & Hope,
2000) and practitioners’ value expectations in technology adoption (Mansfield, 1968;
Stoneman & Kwon, 1996). These three factors can be evaluated by measuring industry
practitioners’ perceptions. As there is significant hype around the usefulness of EBC in the
service sector, we must examine whether the perceived usefulness of EBC is based on
knowledge of its benefits or hype. We aim to provide answers to the following research
questions to shed light on service industry managers’ perceptions of EBC:
RQ1: What is the perception of EBC benefits among service industry managers?
RQ2: Is EBC perceived to be useful by service industry managers in service SCM, and is this
perception based on knowledge of its benefits?
RQ3: Do service industry managers perceive EBC to be profitable based on EBC usefulness in
service SCM? What are the service SCM dimensions for which service industry managers find
EBC to be useful and for which they find EBC adoption to contribute to organization
profitability?
17RQ4: Are the above relationships affected by several organizational factors at various levels
such as supply chain IT integration, organization size, supply chain integration, job level, and
geographical dispersion?
1.2. Literature Review
Several relevant studies on EBC are found in the extant literature. The current investment in
EBC in government organizations and industry provides credibility to the belief that EBC has
the potential to cause disruptive transformation across various industry sectors (White, 2017).
The global industry now seeks to identify the key use cases in their business models where
EBC could add value (Hughes et al., 2019; Ying et al., 2018; Zamani & Giaglis, 2018).
(Tönnissen & Teuteberg, 2019) explore ten use cases to analyze the impact of EBC on industry
logistics and supply chains. Based on the St. Gallen business model concept, they propose
research questions and address concepts of disintermediation, partial intermediation and
reintermediation (Gassmann et al., 2014). The study by (Kamble et al., 2019) identifies 13
enablers of EBC adoption in the agriculture supply chain. Their findings identify traceability,
immutability, and auditability as the most significant enablers of EBC adoption in the
agriculture supply chain. (Thakur et al., 2019) highlight the current issues faced in the land
management process in India and highlight the resolution of those issues, which can be
achieved through EBC adoption. The study by (Behnke & Janssen, 2019) identifies 18
boundary conditions in four categories aimed at achieving better traceability levels for the food
supply chain. They define “boundary condition” as “the social-technical constraints in order to
realize a global food traceability system”. Recent studies propose the integration of digital
technologies such as EBC, IoT (internet of things), RFID (radio-frequency identification),
machine learning, cloud computing, artificial intelligence, data mining and monitoring systems
to form digital business ecosystems for Industry 4.0 (Cavalcante et al., 2019; Chen et al., 2019;
Senyo et al., 2019)
18(Queiroz & Wamba, 2019) highlighted the role of several factors in the intention to adopt EBC
in Indian and US industries. The factors included supply chain stakeholders’ trust, social
influence, performance expectancy, facilitating conditions, and EBC transparency. (Hughes et
al., 2019) conduct a thematic categorization of the EBC literature into themes such as
commercial considerations and realities, integrity and trust, cost and performance, business
model and business processes implications, security, assessment of benefits and market
disruption potential, and hurdles to adoption. (Pan et al., 2019) highlighted the importance of
3. industry cooperation and the assimilation of core EBC technology resources, which will
facilitate the realization of EBC benefits to achieve their true potential and lead to an
improvement in enterprise operation capabilities. (Kshetri, 2018) provides a framework of
supply chain performance dimensions that may be affected by EBC adoption such as cost,
dependability, speed, sustainability, risk reduction, and flexibility. (Aloini et al., 2019) identify
EBC as a solution for resolving several issues in the logistics industry by avoiding institutional
intermediaries and bringing transparency in port logistics transactions, leading to a reduction
in export throughput time.
EBC promises several benefits in the wide field of service applications. EBC adoption can play
an important role in connecting rural areas with global financial, labor, and trade markets and
can lead to a significant reduction in transaction costs (Schuetz & Venkatesh, 2019). EBC can
enable the protection of participants’ sensitive information through the use of public and private
keys. Institution-based intermediaries are vulnerable to centralized data manipulation, high
transaction costs, and a lack of efficiency (Ying et al., 2018). EBC can help in the recording of
participants’ credit and inventory histories, which could facilitate the faster release of
funds/loans from financial institutions (Schuetz & Venkatesh, 2019). The agility of EBC
transactions is another key benefit. Banking industry managers and policymakers are
investigating EBC ecosystems, which would help them to make well-informed decisions
19regarding the allocation of resources and the development of new services related to EBC
(Chae, 2019). EBC enables a democratization-based trust instead of trust in a central institution
(Ying et al., 2018). EBC promises provenance for supply chains in a robust and trustworthy
manner (Saberi et al., 2018). Several countries have been looking forward to EBC adoption to
improve their service industry such as Canada, which aims at establishing a digital identity
ecosystem based on EBC (Wolfond, 2017). Hughes et al. (2019) refers to EBC benefits such
as disintermediation, non-repudiation, automation, streamlined process, processing speed, cost
reduction, and trust. They propose a variable, the “perception of benefits from EBC,” as part
of their research propositions. A similar independent variable, “perceived EBC benefits,” is
operationalized as part of our research model.
EBC could transform government services such as issuing of passports, collecting taxes,
maintaining trustworthy government records, and recording land registries (Hyvärinen et al.,
2017). Peer-to-peer (P2P) energy trading is another promising EBC application in the energy
sector (Andoni et al., 2019). Diestelmeier (2019) identifies the policy implications of the first
EBC use cases in the electricity sector on EU electricity law, thereby shedding light on how
prosumers can garner a place in the electricity market. Fake certification in the education sector
could be curtailed by having an identification number for each certificate on EBC (Casino et
al., 2019). Holburton School in San Francisco adopted EBC to issue and store degree
certificates to prevent the practice of fake certification (Clark, 2016). Immutable data records
of direct benefit transfers by the government to citizens in the areas of health, social security,
and other benefits would provide improved security for both citizens and the government
(Ølnes et al., 2017). Rental agreements can be recorded on EBC, which could make the job of
the courts easier in resolving disputes (Veuger, 2018). EBC can record patient’s data such as
the histories of the medical professionals, medical procedures, and medical instruments/drugs
with whom and with which patients came in contact (Ekblaw, 2017; Forde, 2016). Twitter
20analytics reveal EBC along with virtual reality to be among the top technologies that may
disrupt the healthcare domain. The insights also reveal that EBC in integration with IoT and
telemedicine will play a major role in the future in the treatment of several diseases such as flu,
influenza, diabetes, respiratory diseases, heart diseases and HIV/AIDS (Grover et al., 2018).
Further, recording data on EBC in the logistics sector would reduce the staff required to track
shipments, paperwork, and warehouse shipments (Abeyratne & Monfared, 2016).
The previous studies have explored e-service implementation (Michalski, 2003) and ways in
which e-service is affected by technology-integration mechanisms and cooperation capabilities
(Tsou & Chen, 2012). A few empirical studies have explored the driving forces relating to e
4. service innovation (Cassiman & Veugelers, 2006; Lokshin et al., 2008). There are few survey
based empirical studies related to blockchain in supply chains in the extant literature (Kamble
et al., 2018; Queiroz & Wamba, 2019). A large pool of adoption models is used to understand
the adoption behavior of customers in the extant literature. However, the extant literature does
include a good number of studies that adopt a technology acceptance model (TAM) and
innovation diffusion theory (IDT) (Ajzen, 1991; Davis, 1989; Davis et al., 1989; Huang et al.,
2012; Cabanillas et al., 2017; Lin, 2011; Mamonov & Benbunan-Fich, 2017; Moore &
Benbasat, 1991; Mortenson & Vidgen, 2016; Rogers, 1995; Venkatesh et al., 2003, 2012;
Wamba et al., 2017; Wu et al., 2011). Survey-based studies of EBC are found to be scarce
(Ying et al., 2018), and the perception of EBC and its usefulness in the service industry appears
not to have been investigated.
1.3. Theoretical background
TAM is widely accepted in the MIS literature with regard to technology adoption, which was
proposed by (Davis, 1985). TAM considers the relationship among variables such as perceived
usefulness (PU), perceived ease of use (PEOU) and intent to use (INT). Using TAM, Davis
21posited that the adoption of technology is driven by perceived usefulness (PU) and attitude
towards use (ATT). According to IDT (Rogers, 2010), the “relative advantage” of innovation
over existing technologies is one of the few major factors that drive innovation adoption. The
application of IDT is widely accepted across various areas such as sociology, education, and
information technology. TAM and IDT are found to have similar constructs and, hence, they
complement each other in the examination of the adoption of IS/IT. In this essay, we extend
the “perceived usefulness” construct from TAM to various dimensions of SCM in the service
industry. This essay extends the concepts of these two theories to propose a research model
aimed at examining EBC perception in the service industry. There are studies in the academic
literature based on the extension and integration of these two theories (Chang & Tung, 2008;
Gillenson & Sherrell, 2002; Hardgrave et al., 2003; Sigala et al., 2000; Wu & Wang, 2005).
In this essay, we extend the TAM concept of perceived usefulness to the area of service supply
chain management (SCM) and seek to measure the perceived usefulness of EBC for six supply
chain dimensions. We also extend the IDT concept of relative advantage to define the construct
“perceived EBC benefits.” The academic EBC research is still in its nascent stage, with a
particular lack of empirical literature. This essay aims to analyze the relationship among EBC
benefits, the perceived usefulness of EBC for supply chain practices (broadly encompassing
the scope of service SCM) and perceived incremental profitability due to EBC. The findings
of this essay will assist practitioners and EBC marketers in their understanding of the
perception of EBC usefulness in the service industry and the factors that affect this perception.
1.4. Hypothesis Development
1.4.1. Hypothesis on main factors: Perceived EBC benefits, perceived incremental
profitability, and perceived usefulness of EBC in service SCM
22Perceived usefulness is defined as the extent of people’s belief in technology’s ability to
improve their job performance in a given context (Davis, 1989). In the context of this study,
perceived usefulness is the extent of the belief that EBC adoption will bring improvement in
SCM practices. SCM practices in the service industry are an organization’s activities meant for
the efficient functioning of a supply chain. The extant literature considers various aspects of
SCM practices depending on the context, with the aim of efficiently managing supply chains.
(Tan et al., 1998) identify three aspects of SCM practices, specifically, purchasing, customer
relations, and quality management. Chen and Paulraj measure buyer-supplier relationships
using factors such as supplier involvement, supplier base reduction, long-term relationship,
communication, and cross-functional teams (Chen & Paulraj, 2004). In another study,
researchers identified SCM dimensions such as information sharing, long-term relationship,
process integration, risk and reward sharing, vision and goals, cooperation and agreement on
supply chain leadership as the variables to measure SCM (Min & Mentzer, 2004). In another
study, six aspects are utilized to measure SCM, specifically, information quality, strategic
5. supplier partnership, customer relationship, postponement, information sharing, and internal
lean practices (Li et al., 2005). Flynn et al. (2010) identified supplier integration, customer
integration, internal integration, and operational performance as indicators of SCM practices.
For this study, we identified six dimensions from the literature that broadly cover the scope of
SCM practices in the service industry. The six dimensions are customer relationship,
information quality, service quality, supply uncertainty, mass customization, and delivery
reliability. The six dimensions encompass upstream (supply uncertainty) of the supply chain,
downstream (customer relationship, delivery reliability) of the supply chain, across the supply
chain (information quality) as well as internal supply chain (mass customization, service
quality). Established scales of various SCM practices were chosen and adapted such that
231- Scale items could measure the usefulness of EBC in supply chain practices;
2- SCM constructs broadly cover the scope of service supply chain management;
3- SCM constructs are the supply chain dimensions for which EBC benefits claim to bring
improvement in the extant literature.
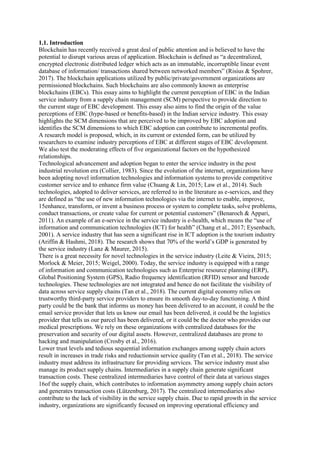
Figure 1 shows the proposed research model. We acknowledge that the proposed model,
although exhaustive, may not cover all the aspects of service SCM dimensions. Other
dimensions such as supplier performance, buyer performance, strategic supplier partnership,
internal lean practices, and time to market may be of great interest; however, they are not
considered for this study due to concerns regarding survey length and to ensure parsimonious
measurement instruments. As shown in Figure 1, two metric variables, specifically, “supply
chain IT integration” and “supply chain integration intensity” and three categorical variables,
specifically, “job level,” “geographical dispersion” and “organization size,” are considered to
test their moderating effects on this study’s research model. The definitions of the constructs
considered for this study, along with their references, are shown in Appendix 2.
Based on IDT, “perceived benefits” can be defined as the relative advantage of EBC technology
over existing IT technologies (Kshetri, 2018; Rogers, 1995). The purpose of measuring the
effect of perceived benefits on perceived usefulness is to confirm if the theoretical benefits of
EBC translate into practical utility for supply chain management in the service industry.
Another purpose is to verify that the belief among supply chain practitioners regarding the
perceived usefulness of EBC in supply chains originates from the knowledge of benefits or the
hype about EBC created in the industry. In the past few decades, the development and adoption
of e-services has led to continuous improvements in customer experience, operational
24efficiency, service quality and cost reduction (Chen et al., 2006; Law et al., 2014; Loukis et al.,
2012; Oliveira et al., 2002). E-services, which are utilized in various aspects of service supply
chains, significantly contribute to the ever-changing demands of the service industry (Ariffin
& Hashmi, 2018). E-services provide visibility of information that is important to customers in
service supply chains, which assists them in reducing their waiting time in availing services
(Ivanov et al., 2017).
It is expected that organizations with service industry managers who recognize EBC benefits
are more likely to adopt EBC than others. Organizations consist of employees in middle
management and top management, and their recognition of EBC usefulness based on EBC
benefits are a crucial factor in their organizations’ EBC adoption. Perceived profitability
measures the degree to which EBC adoption can contribute to organizational profitability.
Managers may perceive the adoption of a novel technology to be profitable in proportion to its
degree of perceived usefulness in various areas of supply chain management. Top management
executives are likely to adopt a technology depending upon the degree of incremental
profitability as well as the degree of perceived usefulness of technology in SCM practices.
Hypothesis 1. “Perceived EBC benefits” positively affect the perceived usefulness of EBC for
service SCM dimensions. The six SCM dimensions are customer relationship (H1a),
information quality (H1b), service quality (H1c), supply uncertainty (H1d), mass
customization (H1e), and delivery reliability (H1f).
Hypothesis 2. The perceived usefulness of EBC for service SCM dimensions has a positive
6. effect on perceived incremental profitability due to EBC adoption. The six SCM dimensions
are customer relationship (H2a), information quality (H2b), service quality (H2c), supply
2526
uncertainty (H2d), mass customization (H2e), and delivery reliability (H2f).
1.4.2. Hypothesis on moderating factors
1.4.2.1. Manager experience level
In the prior research, differences are observed in mental models and in the psychological
assessment of employees at different levels and stages of employment (Lester et al., 2002;
O’Neill & Adya, 2007). In organizations, it is observed that middle-level managers focus
on ensuring operational efficiency (task-oriented capabilities) and compliance with the
directions of top management whereas top management executives focus on monitoring
operational efficiency (relationship-oriented and change-oriented capabilities) as well as
organizational profitability (Anzengruber et al., 2018; Anzengruber et al., 2017). Hence,
middle-level managers are generally concerned about technological usefulness whereas
top management executives are generally concerned about incremental profitability as well
as usefulness due to technology adoption. Therefore, middle-level managers tend to
measure profitability by the degree of usefulness in their mental models. It is anticipated
that managers’ experience level will have a moderating effect on the relationship between
the perceived usefulness of supply chain practices and perceived incremental profitability.
Hypothesis 3. Managers’ experience moderates the relationship between the perceived
usefulness for SCM practices and perceived incremental profitability such that the lower
the experience, the higher the relationship will be. The six SCM dimensions are customer
relationship (H3a), information quality (H3b), service quality (H3c), supply uncertainty
(H3d), mass customization (H3e), and delivery reliability (H3f).1.4.2.2. Geographical dispersion
and Organization size
The geographical dispersion of an organization indicates the number of countries in which
its offices are located. Office locations in a higher number of countries will contribute to
a greater amount of decentralization in an organization with a greater amount of
uncertainty in the supply chain (Hakonen & Lipponen, 2008). We chose organization size
as a moderating variable as it is known to reflect the scope of differentiation in operations
and increase bureaucratic complexity (Vaccaro et al., 2012). In this study, organization
size is measured by the number of employees in the organization. Larger organizations
may observe greater decentralization in their work process structure. It is anticipated that
EBC benefits may lead to a higher positive contribution for organizations with higher
geographical dispersion. In addition, EBC benefits may translate into higher usefulness for
supply chain practices for larger organizations. The EBC benefits of traceability and
decentralized data records may find greater relevance in the case of organizations with
higher geographical dispersion.
Hypothesis 4. Geographical dispersion moderates the relationship between perceived
benefits and perceived usefulness for SCM practices in such a way that the higher the
dispersion, the higher the relationship will be. The six SCM dimensions are customer
relationship (H4a), information quality (H4b), service quality (H4c), supply uncertainty
(H4d), mass customization (H4e), and delivery reliability (H4f).
Hypothesis 5. Organization size moderates the relationship between the perceived benefits
and perceived usefulness of SCM practices in such a way that the higher the organization
size, the higher the relationship will be. The six SCM dimensions are customer relationship
27(H5a), information quality (H5b), service quality (H5c), supply uncertainty (H5d), mass
customization (H5e), and delivery reliability (H5f).
1.4.2.3. Supply chain integration intensity and Supply chain IT integration
Supply chain integration intensity refers to the extent of intra-organizational and inter
organizational integration (Kshetri, 2018). One of the major purposes achieved by EBC
adoption is to ensure the availability of trustworthy information in a supply chain. EBC
7. adoption can make a significant contribution to supply chains that lack transparency
among their members. Hence, organizations with low integration intensity may reap
significant improvements in supply chain practices based on EBC benefits. Organizations
with high integration intensity may already have a significant degree of transparency based
on information sharing in centralized systems. Supply chain information technology
integration refers to the various types of electronic communication and the transactions
between supply chain partners using sophisticated IT systems (Kumar & Dissel, 1996). A
robust IT infrastructure among supply chain members is a necessity for successful EBC
adoption and value creation. Higher digital diffusion across supply chains may facilitate
EBC adoption (Al-Saqaf & Seidler, 2017; Gausdal et al., 2018; Kshetri, 2018). It is
expected that the higher the IT integration of an organization with its supply chain
members, the higher its improvement in SCM practices will be, driven by EBC benefits.
Hypothesis 6. Supply chain integration intensity moderates the relationship between
perceived benefits and perceived usefulness in service SCM dimensions in such a way that
the lower the integration intensity, the higher the relationship will be. The six SCM
dimensions are customer relationship (H6a), information quality (H6b), service quality
(H6c), supply uncertainty (H6d), mass customization (H6e), and delivery reliability (H6f).
2829
Hypothesis 7. Supply chain IT integration moderates the relationship between perceived
EBC benefits and the perceived usefulness of the service SCM dimensions in such a way
that the higher the IT integration, the higher the relationship will be. The six SCM
dimensions are customer relationship (H7a), information quality (H7b), service quality
(H7c), supply uncertainty (H7d), mass customization (H7e), and delivery reliability (H7f).
Table 1: Reference literature for moderating variables
S. No.
Moderating Variable
References
1
Job level
(Anzengruber et al., 2018, 2018;
Lester et al., 2002; O’Neill & Adya,
2007)
2
Geographical dispersion
(Hakonen & Lipponen, 2008)
3
Organization size
(Vaccaro et al., 2012)
4
Supply chain integration intensity (Kshetri, 2018)
5
Supply chain IT integration
(Al-Saqaf & Seidler, 2017; Gausdal
et al., 2018; Kshetri, 2018; Kumar
& Dissel, 1996)Figure 1. Proposed research model
Note: PU- Perceived usefulness
1.5. Material and methods
1.5.1. Instrument design and refinement
To develop the research instrument for perceived EBC benefits, the scale development
process is conducted as prescribed in the literature (Churchill Jr, 1979; Hinkin, 1998).
The research instruments for other constructs are obtained from the extant literature, as
shown in Appendix 3. The scale items of the “perceived EBC benefits” construct were
8. developed based on interviews with practitioners and the literature review. Several
items were generated whose content validity was established based on the extant
literature (Bohrnstedt et al., 1983). Next, the face validity was obtained through a
formal pre-test by ten academicians and practitioners. The academicians included
faculty from three universities with expertise in information systems and information
management.
Further, the scales were pilot tested with responses from practitioners in the service
industry. The pilot test was conducted with 84 responses, and reliability was assessed
30through a Cronbach’s alpha (Cronbach, 1951) and a split halves method. The reliability
of the perceived EBC benefits instrument was found to be more than 0.8 using both
methods. The reliability of the other constructs measuring the perceived usefulness in
service SCM was also found to be more than 0.8 using both methods. Efforts were made
to identify the core benefits of EBC on a technological level as items in the perceived
benefits scale. A five-point Likert type scale was utilized to measure the scale items.
Sixteen items emerged for the “Perceived EBC benefits” scale from the pilot test, which
is shown in Appendix 1. To overcome the limitations of exploratory factor analysis and
as scale items have been derived from theory in the extant literature, the scale
refinement and validation of the “perceived EBC benefits” construct were conducted
using confirmatory factor analysis at the pilot testing and main testing stages (Ahire et
al., 1996). To understand the advantages of conducting CFA over EFA for scale
refinement, we refer the reader to (Ahire et al., 1996). Perceived profitability was
measured using a Likert scale (i.e., to what extent does EBC implementation in your
organization help enhance organizational profitability). Two moderating variables,
specifically, supply chain integration and IT integration, were also measured on a Likert
type scale, and they were found to have reliabilities of more than 0.8.
1.5.2. Sampling design and Data collection
Data collection was conducted with a survey questionnaire using the online survey tool
Survey Monkey. The sampling population for this survey was made up of professionals
from the service industry in middle management and senior management positions.
Purposive sampling was used as a sampling method to identify the respondents using
the LinkedIn platform. The main testing survey questionnaire was administered through
an invitation email that was sent to each identified respondent explaining the objectives
of this study and requesting their honest input in the survey. A total of 673 professionals
31agreed to be part of this survey. A total of 282 complete survey responses were received,
and 258 responses (response rate of 38.33%) were found to be valid. Filters in the
survey ensured that the responses identified for analysis were from professionals with
some blockchain knowledge. The demographic profiles of the respondents are shown
in Table 1 and Table 2. The survey questions are shown in Appendix 4.
1.5.3. Non-response and Common method bias
A non-response bias test is conducted by carrying out a t-test for early and late
responses of the respondents (Armstrong & Overton, 1977; Tsou & Hsu, 2015). This
test is employed to evaluate the difference in means for every scale item. No significant
difference is found for the scale items of each construct. Common method bias is
considered to be an important issue to be checked and controlled when the data of all
constructs in the model are collected from a single respondent (Podsakoff & Organ,
1986). To check the bias, Harman’s single factor test is conducted. No factor is found
to account for significant variance in our data. The effect of CMV was minimized by
randomizing the sequence of the survey questions for every respondent, requesting that
the respondents provided their honest input and ensuring the respondents’ of the
anonymity of their responses (Podsakoff et al., 2003). While CMB affects linear
relationships, it has fewer effects in the analysis of variables’ interactions (Evans,
1985).
9. 3233
Table 2. Demographic profile (n=258)
N
%
Job level
Owner/CXO-Level
69
27%
Senior Management
93
36%
Manager
74
29%
Academicians
22
9%
Job function
Service support functions
25
10%
Service development functions
37
14%
Consulting
35
14%
Supply chain
46
18%
Other service functions
115
45%
Organization size (Number of employees)
Less than 50
59
23%
50-99
21
8%
100-249
24
9%
250-499
24
9%
500-999
24
9%
1000-2499
23
9%
2500 & above
83
32%
Geographic dispersion (Number of countries)
1
133
52%
2-10
54
21%
11-100
10. 36
14%
More than 100
35
14%
1.6. Results
The maximum likelihood technique is used by applying structural equation modeling
(SEM), using analysis of moment structures (AMOS 24) software to test the proposed
model, and multi-group analysis is applied to test the moderating effects of the proposed
moderating variables. Similar to the extant literature on SEM, a two-step approach
(Gerbing & Anderson, 1988) is followed for the estimation of the measurement model
before the structural model is employed. The use of maximum likelihood technique
(AMOS) to test the hypothesized relationships requires variables to have normally
distributed data. It is common for continuous variables measured on a Likert scale to be non-
normal with high skewness and kurtosis (Sorkun, 2019). Hence, we decided to apply
the two-step approach for the normal transformation of continuous variables (Templeton,
2011).
1.6.1. Measurement model results
Convergent validity can be examined by analyzing the average variance extracted (AVE),
t-values for factor loadings, and composite reliability (construct reliability) (Chau, 1997;
Fornell & Larcker, 1981). With t-values higher than 9.650 (p<0.001), all the factor loadings
are found to be significant. The composite reliability is found to be greater than 0.8
(Nunnally & Bernstein, 1978); thus, all the constructs are found to be reliable. As shown
in Table 3, the values of composite reliability varied between 0.870 for service quality to
0.954 for information quality. AVE is found to be more than 0.5 for all constructs, varying
from 0.540 for perceived EBC benefits to 0.821 for supply uncertainty. Construct reliability
is more than AVE for all cases, which establishes convergent validity. The overall model
fit of the measurement model is found to be good: chi-square/df=1.540, CFI=0.941,
RMSEA=0.046. The outer factor loadings for the items of each construct are shown in
Table 5. All loadings are more than 0.6. Discriminant validity can be evaluated by
comparing the square root of AVE for each latent variable with its correlation with other
constructs (Fornell & Larcker, 1981). Items of service quality construct were refined by
deleting two items to establish discriminant validity. The correlations among the constructs
are shown in Table 4. The construct validity was tested using the Master Validity plugin in
AMOS (Gaskin, 2016).
3435
Table 3. Demographic profile (n=258)
Service industry of the
organization
N
%
Advertising and Marketing
6
2%
Airlines
2
1%
Consulting
36
14%
Courier, Logistics,
Packaging, Transport
41
16%
Education
35
14%
11. Entertainment and Leisure
1
0%
Environment
1
0%
Finance and Financial
Services
18
7%
Government
5
2%
Hospitals and Healthcare
19
7%
Insurance
1
0%
Information Technology (IT)
33
13%
Non Profit
3
1%
Railways
2
1%
Real Estate
9
3%
Shipping
9
3%
Telecommunications,
Technology, Internet
11
4%
Utilities and Energy
8
3%
Others
18
7%
Table 4. Reliability and AVE values
Constructs
Cronbach's
Alpha
Composite
reliability (CR)
Average variance
extracted (AVE)
SCI
0.898
0.899
0.641
PBEN
0.948
0.949
0.540
CR
0.939
0.940
12. 0.722
IQ
0.954
0.954
0.805
MC
0.944
0.944
0.773
SQ
0.902
0.870
0.627
DR
0.918
0.918
0.789
SU
0.931
0.932
0.821
ITI
0.894
0.896
0.633
#Note: PU: Perceived usefulness; SCI: Supply chain integration; PBEN: Perceived EBC
benefits; CR: PU of EBC for Customer relationship; IQ: PU of EBC for Information quality;
MC: PU of EBC for Mass customization; SQ: PU of EBC for Service quality; DR: PU of EBC
for Delivery reliability; SU: PU of EBC for Supply uncertainty; ITI: Supply chain IT integration36
Table 5. Correlations for discriminant validity
#Note: PU: Perceived usefulness; SCI: Supply chain integration; PBEN: Perceived EBC benefits; CR: PU of EBC for
Customer
relationship; IQ: PU of EBC for Information quality; MC: PU of EBC for Mass customization; SQ: PU of EBC for
Service
quality; DR: PU of EBC for Delivery reliability; SU: PU of EBC for Supply uncertainty; ITI: Supply chain IT
integration
1.6.2. Structural model results and hypothesis testing
The overall model fit of the structural model is found to be good: chi-square/df = 2.140,
CFI=0.902, RMSEA= 0.067. Table 6 shows the results including the path coefficients (β), t
statistics, and p-value for each hypothesis. In the overall model, perceived EBC benefits are
found to have a significant effect on perceived usefulness in all six dimensions of service
SCM, specifically, information quality, mass customization, service quality, supply
uncertainty, delivery reliability, and customer relationship. Perceived usefulness of EBC in
mass customization, service quality, information quality, supply uncertainty, and delivery
reliability are found to have a significant effect on perceived incremental profitability. No
significant effect has been found for the path from perceived usefulness of EBC for customer
relationship to perceived incremental profitability.
Construct
SCI
PBEN
CR
IQ
MC
SQ
DR
SU
ITI
SCI
0.801
PBEN
0.293
15. 0.776
CR
CR1
0.873
ITI2
0.79
CR2
0.848
ITI3
0.761
CR3
0.88
ITI4
0.803
CR4
0.788
ITI5
0.846
CR5
0.88
SCI
SCI1
0.729
CR6
0.826
SCI2
0.809
IQ
IQ1
0.895
SCI3
0.823
IQ2
0.869
SCI4
0.843
IQ3
0.916
SCI5
0.794
IQ4
0.921
IQ5
0.883
#Note: PU: Perceived usefulness; SCI: Supply chain integration; PBEN: Perceived EBC benefits; CR: PU of EBC
for Customer relationship; IQ: PU of EBC for Information quality; MC: PU of EBC for Mass customization; SQ:
PU of EBC for Service quality; DR: PU of EBC for Delivery reliability; SU: PU of EBC for Supply uncertainty;
ITI: Supply chain IT integration
1.6.3. Results of moderating effects
After examining the main effects of the model, we analyzed the moderating effects to gain an
understanding of the variation of EBC perception in the service sector. The moderation effects
are tested through multi-group analysis in AMOS. The moderation effects are tested for three
categorical variables and two continuous variables, which were measured on a Likert scale.
The three categorical variables are “organization size,” “geographical dispersion,” and “job 38
level.” The two continuous variables are supply chain integration intensity and supply chain
IT integration.
Table 7. Path coefficients in the structural model
Hypothesis
Path
β
Standard
17. 0.238
0.076
3.116
0.002
Yes
H2d
SUPP
0.114
0.053
2.144
0.032
Yes
H2e
MCPP
0.194
0.058
3.321
0.000
Yes
H2f
DRPP
0.38
0.061
6.258
0.000
Yes
#Note: PU: Perceived usefulness; SCI: Supply chain integration; PBEN: Perceived EBC benefits; CR: PU of
EBC for Customer relationship; IQ: PU of EBC for Information quality; MC: PU of EBC for Mass
customization; SQ: PU of EBC for Service quality; DR: PU of EBC for Delivery reliability; SU: PU of EBC for
Supply uncertainty; ITI: Supply chain IT integration; PP; Perceived incremental profitability
Table 7 shows the results for metric moderating factors while Table 8 and Table 9 show the
group categorization and the results for categorical moderating factors. The path coefficients
of Hypothesis 5 were not found to be significantly different from one another for the three
groups (less than 100, 100-2499, 2500 and above) of the moderating variable organization
size. The critical ratios for the differences in the six path coefficients were found to be
between -1.96 and 1.96. Although this hypothesis was not proposed, the path coefficient
between PU for supply uncertainty to perceived profitability is not found to be significant for
100-2499 employees whereas it is found to be significant, and significantly different, for
organizations with fewer than 100 employees (β= 0.201) and organizations with 2500
employees and above (β= 0.21). The critical ratios for the differences are found to be 2.028
(between the fewer than 100 employees group and the 100-2500 employees group) and 2.123
(the between 100-2500 employees group and the 2500 and above group), which is more than
1.96. The moderating effect of geographical dispersion is analyzed in two groups
organizations with offices located in one country and organizations with offices located in
more than one country. The six path coefficients of Hypothesis 4 were not found to be
significantly different from one another for the two groups. The critical ratios for differences
in the six path coefficients were found to be between 1.96 and 1.96. Hence, Hypothesis 4 is
not supported. Although the following hypothesis was not proposed, the path coefficient
between PU for supply uncertainty to perceived profitability is not found to be significant for
organizations with office locations in one country whereas it is found to be significant for
organizations with office locations in more than one country. In addition, the path coefficient
between PU for service quality to perceived profitability is found to be significant for
organizations with office locations in one country whereas it is not found to be significant for
organizations with office locations in more than one country. The critical ratios for differences
are found to be 2.303 between two groups for the path SUPP and 2.008 between two
groups for the path SQPP, which is more than 1.96. The moderating effect of job level is
analyzed in two groups: CXO/senior management and manager/academician. The path
18. coefficients of Hypothesis 3 were not found to be significantly different from one another for
the two groups. As the moderating effects of “supply chain integration intensity” and “IT
integration” were tested, the p-values for the interaction effects variable in all six cases for
Hypothesis 6 and Hypothesis 7, respectively, are found to be more than 0.05. Hence, no
significant effect of these two moderating variables is found on the path between perceived
EBC benefits and the PU of six service SCM dimensions.
3940
Table 8. Moderating effects of metric moderators
Hypothesis Moderator
-- (a)
Path
Interaction effect
estimate -- (PBEN x (a))
p-value
Hypothesis
supported?
H6a
SCI
PBENCR
0.0512ns
0.7259
No
H6b
SCI
PBENIQ
0.0405ns
0.7559
No
H6c
SCI
PBENSQ
-0.0174ns
0.8851
No
H6d
SCI
PBENSU
0.1387ns
0.3793
No
H6e
SCI
PBENMC
0.1436ns
0.3256
No
H6f
SCI
PBENDR
0.1144ns
0.4244
No
H7a
ITI
PBENCR
-0.0363ns
0.7797
No
H7b
ITI
PBENIQ
0.0496ns
19. 0.6685
No
H7c
ITI
PBENSQ
0.0461ns
0.6671
No
H7d
ITI
PBENSU
-0.0468ns
0.7386
No
H7e
ITI
PBENMC
-0.0529ns
0.6838
No
H7f
ITI
PBENDR
-0.0106ns
0.9336
No
ns - Not significant, * p<0.1, **p<0.05, ***p<0.001
#Note: PU: Perceived usefulness; SCI: Supply chain integration; PBEN: Perceived EBC benefits; CR: PU of EBC
for Customer relationship; IQ: PU of EBC for Information quality; MC: PU of EBC for Mass customization; SQ:
PU of EBC for Service quality; DR: PU of EBC for Delivery reliability; SU: PU of EBC for Supply uncertainty;
ITI: Supply chain IT integration
Table 9. Groups for categorical moderators
Moderator
Moderator type
Groups for testing moderating
effects
Group number
Job level
Categorical
Senior Management
J1
Manager
J2
Geo-dispersion
Categorical
One country
G1
More than one country
G2
Organization size
Categorical
Less than 100 employees
O1
100-2499 employees
O2
Above 2499 employees
O3
1.7. Theoretical implications
The study by (Tönnissen & Teuteberg, 2019) proposes several theme-based research
questions related to blockchain application in the logistics sector based on the St. Gallen
business model concept (Gassmann et al., 2014). They propose research questions on the
value proposition dimension and the revenue streams dimension. The value proposition
20. dimension refers to the value proposition or the benefits offered by blockchain. Our study
addressed this dimension by proposing and testing the scale for benefits of EBC. 41
Table 10. Moderating effects of categorical moderators
Hypothesis Path
Groups Estimate (β) p-value
Critical ratios
Hypothesis supported?
H3
Moderator: Job level
H3a
CRPP
J1
-0.157
0.32
0.923
No
J2
-0.035
0.75
H3b
IQPP
J1
0.08
0.295
0.564
No
J2
0.15
0.126
H3c
SQPP
J1
0.377
0.000
-1.235
No
J2
0.165
0.264
H3d
SUPP
J1
0.141
0.025
-0.942
No
J2
0.036
0.701
H3e
MCPP
J1
0.236
0.000
-0.693
No
J2
0.145
0.192
H3f
DRPP
J1
0.297
24. O2
-0.048
0.533
2.123 (O2-O3)
O3
0.21
0.025
0.062 (O3-O1)The revenue stream dimension refers to the returns that can be generated by
blockchain
members to cover the costs of blockchain adoption. Our study addresses this research question
by highlighting the supply chain dimensions whose improvement can be a source of revenue
streams and hence can contribute to profitability. Several empirical studies are found
regarding the industrial application of blockchain in the extant literature. The empirical study
by (Kamble et al., 2018) proposed a research model based on the integration of the theory of
planned behavior (TPB), the technology readiness index (TRI), and TAM. The results of this
study show that perceived usefulness (PU) is driven by perceived ease of use (PEOU) and
subjective norms (SN). The amount of variance of perceived usefulness explained is reported
as 28%, which indicates the presence of other factors that could explain the variance of
perceived usefulness. As discussed above, we expanded the construct of perceived usefulness
for six SCM constructs. The value of R2 accounted for the perceived usefulness of customer
relationship (47.9%), information quality (50.2%), mass customization (43%), supply
uncertainty (46.8%), delivery reliability (51.9%) and service quality (51.2%) are found to be
higher than the recommended (30%) in the previous literature (Chin, 1998). On average, the
construct “perceived EBC benefits” explained 48.5% of the variance in the perceived
usefulness for SCM practices in our model.
Pan et al. (2019) conducted an empirical study based on data collected from 50 Chinese
organizations that implemented blockchain. They analyzed the effect of blockchain adoption
on the operational capabilities of the organizations and used three quantitative indicators to
measure operational capabilities. As several organizations have adopted blockchain in China,
it was feasible to conduct such a study. In India, blockchain is in the preliminary stages of
proof-of-concept and pilot testing. Hence, we conducted a perception-based study to analyze
the effect of EBC adoption on SCM and the profitability of the organization. Pan et al.(2019)
42found that organizations with a higher asset scale are favorably disposed towards adopting
blockchain. However, we found the variation in our research model relationships based on
organization size and geo-dispersion as discussed in Section 1.6.3 and Section 1.8. Pan et al.
(2019) found that blockchain adoption led to improvement in the operational capabilities of
enterprises in China. On a similar note, in the Indian context, our findings confirm the belief
of practitioners from the Indian service industry that improvements in SCM can be brought
about through EBC adoption. The study by Clohessy and Acton (2019) found that larger
organizations are more inclined to adopt EBC and conduct research and development
activities on EBC. Our results support this finding by showing that practitioners from larger
organizations recognize their organization’s incremental profitability originating from
improvements in information quality, mass customization, service quality, delivery reliability
and mitigation of supply chain uncertainty arising from EBC benefits. Clohessy and Acton
(2019) propose that low levels of blockchain awareness create a need to propagate
information about the benefits of EBC by the Irish government. Our study addresses this
aspect by identifying EBC benefits by measuring practitioners’ perceptions.
(Wang et al., 2019) identified three blockchain benefits by interviewing 14 supply chain
experts. They utilized cognitive mapping as the technique for measuring experts’ perceptions
of EBC. The study by Kamble, Gunasekaran, and Sharma (2019) in the context of the
agriculture supply chain identified 13 enablers for the adoption of blockchain technology.
Many of these enablers noted places on the “perceived EBC benefits” scale developed in this
study. We identified 16 benefits and empirically tested them through the process of scale
25. development. Kamble, Gunasekaran, and Sharma (2019) utilized decision-making trials and
an evaluation laboratory (DEMATEL) and the interpretive structural modelling (ISM)
approach to evaluate the causal relationships among these enablers. Their findings prioritize
43the enablers for the agriculture supply chain in the following sequence: traceability >
immutability > secure database technology > decentralized database technology > shared
database > auditability > provenance > reduced settlement lead times > improved risk
management > anonymity and privacy > reduced transaction costs > transparency > smart
contracts. Our findings for the service industry found importance of EBC benefits in the
following sequence based on their CFA factor loadings: confidentiality > removal of non
value adding intermediaries > smart contracts > deters fraudulent products > deters fraudulent
identities > transparency > cost savings > trustworthy insights using data analytics >
traceability > BIoT (blockchain internet of things) > immutable data > simplified business
audits > direct access to stakeholders > consensus > agile information availability >
decentralized data records.
The empirical study by Wong et al. (2019) utilizes a technology, organization and
environment framework (TOE) to examine the effects of seven factors including the relative
advantage of blockchain adoption for small and medium enterprises in Malaysia. We utilize
and extend TAM and IDT to propose our research model. Wong et al. (2019) use the construct
“relative advantage” to measure the usefulness of EBC in enhancing the efficiency of
operations and supply chain management. In our study, we utilize six constructs to measure
the usefulness of EBC in improving organizational SCM practices. Wong et al. (2019) found
that relative advantage, cost, competitive pressure and complexity significantly predict
blockchain adoption for Malaysian SME’s, whereas we found that information quality, mass
customization, service quality, supply uncertainty and delivery reliability significantly
predicts the organizational profitability of service organizations due to EBC adoption. The
empirical study by Queiroz and Wamba (2019) provides insights into the factors that
influence behavioral intention to use EBC in Indian industry such as “performance
44expectancy,” “trust of supply chain stakeholders” and “social influence.” They also shed light
on the factors that influence the behavioral intention to use EBC in US industry such as
facilitating conditions and performance expectancy. Overall, they highlighted the factors that
predict behavioral intention to use EBC. Our study is one of the first to propose a model aimed
at examining the current perception of disruptive technologies such as EBC in terms of its
usefulness from an SCM practices perspective. Our study is also one of the first studies to
identify the benefits of EBC perceived by service industry practitioners through the
development and operationalization of a “perceived benefits” scale. Our model introduces
constructs to highlight the supply chain practices for which EBC is perceived to be useful and
predicts incremental profitability due to EBC adoption. Our model also validates whether the
perceived EBC benefits predict the EBC usefulness in SCM practices. Our model validates
the fact that the perception of the usefulness of EBC is based on the knowledge of EBC
benefits among practitioners. The results confirm that the perceived usefulness for five SCM
practices considered in the model is an important predictor of perceived profitability due to
EBC adoption among practitioners. Our model constructs explain 56.7% of the variance in
perceived incremental profitability due to EBC. The value of R2 to account for perceived
profitability is higher than the recommended level (30%) in the previous literature (Chin,
1998).
Queiroz and Wamba (2019) confirm that behavioral intention is predicted by performance
expectancy while our results confirm that perceived usefulness (similar to the construct
“performance expectancy”) in SCM practices is a significant predictor of perceived
incremental profits due to EBC adoption. The relationship among perceived profitability,
behavioral intention, and behavioral expectation is a potential area for future research. Our
model introduces a few moderating variables that are seldom considered in similar studies
45such as geo-dispersion, supply chain integration, and supply chain IT integration. This study
26. provides evidence of EBC benefits perceived by service industry practitioners in India. The
list of those benefits is shown in Appendix 1. This study also provides evidence that EBC is
perceived to be useful in all the six dimensions of SCM practices by service industry
practitioners. Scholars can apply this model or an adapted model in a cross-country study,
which may provide a holistic viewpoint to the results of this study and provide generalizable
results that can be globally applicable.
1.8. Managerial Implications
The results provide some interesting insights for practitioners. First, our statistical results
show that Indian service industry professionals believe that the theoretical benefit of EBC
will translate into practical usefulness in six dimensions of service supply chains, specifically,
information quality, mass customization, service quality, delivery reliability, and customer
relationship. It is proven that the perceived usefulness of EBC among service industry
practitioners in India is not based on hype but, rather, it is based on an understanding of the
theoretical benefits of EBC.
Second, the findings show that service industry practitioners believe in the usefulness of EBC
in enhancing the mass customization of services, the delivery reliability of services, and
service quality, and it will contribute to incremental growth in firm profitability. The findings
confirm that demand adaptation, service quality, and timely service delivery are the three
pillars of growth for an organization in the service industry. The practitioners further believe
that EBC usefulness in ensuring information quality and reduction of supply uncertainty will
also contribute to firm profitability due to EBC. This benefit may be based on the fact that
the certainty of timely material supply from suppliers saves time, and, in the service industry,
time is money. Unfulfilled demand is demand lost for this industry. There is no provision for
46taking backorders in the service industry. The supply of quality material on a timely basis can
ensure that customers gain trust in provided services, and, hence, customer loyalty towards
the service provider will be maintained. The usefulness of EBC in improving information
quality as a means of driving firm profitability may be because the timely movement of
correct information is critical for timely service delivery. For example, in the shipping
industry, information is transmitted through the movement of hard copies of documents,
which causes a delay in approval for the dispatch of packages/materials to be transported. As
the usefulness of information quality will save time in service supply chains, and as time is
money in the service industry, information quality can lead to an increase in a firm’s
profitability. The practitioners believe that the usefulness of EBC in enhancing customer
relationships may not contribute to incremental growth in firm profitability. This perception
may be because the customer relationship alone cannot result in incremental profits unless it
is supported by the five critical factors for growth discussed above. The improvement of
customer relationships could be perceived by practitioners simply as a hygiene factor that
sustainably ensures customer satisfaction.
Third, the results confirm the absence of the moderation effect of supply chain integration
and supply chain IT integration, which means that the belief in the translation of theoretical
benefits into practical usefulness for supply chain dimensions is not affected by a higher or
lower amount of supply chain and IT integration in the organization. The results show that
there is no significant difference between practitioners’ belief in organizations having higher
and lower integration in their supply chains. Fourth, practitioners from organizations with
100 to 2500 employees believe that EBC usefulness in reducing supply uncertainty may not
contribute to incremental organizational profitability whereas that is not the case in the other
two groups (less than 100 employees, 2500 and above employees). This finding could be
47because smaller organizations tend to face inefficiencies from their suppliers, and they do not
operate in markets with a large customer base. Such inefficiencies could result in the loss of
their customer base and hence customer demand. EBC adoption may ensure accountability
on the part of suppliers to supply quality material on a timely basis, which would increase
operational efficiency and hence result in an increase in profits. For large organizations (2500
27. employees and above) with extremely large customer bases, supply chains can be highly
complex. In such large organizations, keeping manual track of suppliers with a centralized
database is not always efficient. Hence, for large organizations (2500 and above employees),
EBC adoption and its usefulness in reducing supply uncertainty may result in timely and
efficient operations and may hence result in boosting profitability. For mid-range
organizations (100-2500 employees), supply chains are relatively less complex, and they are
also not small enough to be prone to supplier inefficiencies. Hence, the usefulness of EBC
adoption in reducing supply uncertainty may not boost their profits significantly due to
existing efficient operations with suppliers.
Fifth, no difference in belief is found between middle-level managers and CXO’s regarding
the extent of EBC usefulness translating into incremental profitability for the organization.
This finding indicates that the lack of clarity about EBC business value is equally prevalent
among managers and CXO’s. The lack of clarity about EBC business value may be due to a
lack of successful use cases of EBC adoption in the service industry (Prasad et al., 2018;
Spielman, 2016). Sixth, the findings state that the belief level of practitioners regarding the
translation of EBC benefits in improving service SCM dimensions is not affected by the
geographical dispersion of the organization. This finding indicates that practitioners are
convinced about the usefulness of EBC in service supply chains; however, they may not be
clear about the extent of variation of its usefulness in cases of higher or lower organizational
48geographical dispersion. This finding also indicates that there is an equal perception of EBC
usefulness in organizations with lower as well as higher geographical dispersion.
Seventh, practitioners from organizations with office locations in one country believe that
EBC usefulness for service quality will contribute in incremental organizational profits
whereas that is not true for organizations with office locations in more than one country. This
finding may be due to how EBC adoption may boost customer trust for organizations in one
country and hence result in an increase in demand, further resulting in higher revenue and
higher profits. For organizations with office locations in more than one country, they may
already have globally established standards of service quality, and hence EBC adoption may
not significantly boost profits due to its usefulness in service quality. Eighth, practitioners
from organizations with office locations in one country believe that EBC usefulness in
reducing supply uncertainty will not contribute to incremental organization profits while that
is not the case for organizations with office locations in more than one country. This finding
may be driven by how the supply chains of organizations with office locations in one country
may not be sufficiently complex to have a scope of boosting incremental profits through EBC
adoption. Organizations with office locations in more than one country may be operating by
procurement from global suppliers, and, hence, data records on a decentralized ledger may
boost trust across supply chain members. Additionally, the timely and quality arrival of
material may mitigate loss of demand, increase customer trust and result in a boost in revenue
and profitability.
As discussed in Section 1.2, the current technological knowledge of industry practitioners,
the current technology market and practitioners’ value expectations of technology adoption
are a few of the important factors that can determine the development direction of
49technologies such as EBC (Erzurumlu & Erzurumlu, 2013; Mansfield, 1968; Miller & Hope,
2000; Raguseo, 2018; Stoneman & Kwon, 1996). As per our findings, the perceived
usefulness of EBC for SCM practices is driven by EBC benefits, and increments in
profitability are perceived to originate from the usefulness of EBC in five SCM practices.
This finding indicates that EBC can obtain a good market positioning in the service industry
as practitioners perceive an increase in organizational profitability to be driven by better SCM
operations due to EBC adoption. Testing the moderating effects highlights the variables for
which these relationships observe variability. The current EBC knowledge of service industry
practitioners is captured through the scale development process of perceived EBC benefits.
The scale development identifies the benefits of EBC as it is perceived by Indian service
28. industry managers. The service SCM dimensions for which practitioners perceive EBC to be
useful are determined by establishing the construct validity of the six “perceived usefulness”
constructs. As increments in profitability are perceived to originate from the usefulness of
EBC in five (out of six) SCM practices, it is a good indicator of service industry practitioners’
financial value expectations of EBC adoption. It is necessary to evaluate these three factors
at different stages of EBC development, which can provide direction in technological
development. On a macro level, this study is an effort to achieve this purpose at the current
stage of EBC development by measuring industry perceptions.
1.9. Conclusion
This study contributes by evaluating the perception of EBC among service industry
practitioners in India. This study brings clarity regarding the EBC benefits perceived by
service industry practitioners. The scale of “perceived EBC benefits” is developed, which can
contribute to the measurement of EBC benefits by scholars in future research. Our model is
developed as an extension to the TAM (Davis, 1989) and IDT (Rogers, 1995) to measure
EBC perception in the service industry. We examined whether the perception of EBC
50usefulness in service SCM among practitioners is based on the theory of EBC benefits or on
the hype created about the universal suitability of EBC. We also examined whether the
contribution of the perception of EBC usefulness among practitioners translates into the
perception of incremental profitability due to EBC. The moderating effects of five variables
were examined in the model, which highlighted valuable implications for IS and SCM
managers. This study has limitations that can serve as avenues for future research. First, the
perceived usefulness of EBC for service SCM can originate from several constructs. We have
analyzed the effect of a single construct (perceived EBC benefits) on the SCM usefulness of
EBC. Second, the perception of incremental firm profitability could be contributed by several
other factors that are not considered in this model. An extension of this model in integration
with other IT adoption models could result in promising areas for future research on EBC.
Third, our model is tested only in India, and, hence, the results cannot be generalized for the
rest of the world. Testing this model or a related model in cross-country studies is a promising
area for future research. Finally, as practitioners’ perceptions change with time and with the
evolution of successful industrial use cases, a longitudinal study based on this model would
do great justice to reveal time-tested results.