Getting the Waters Tested - The Marcellus Shale Factor (Private Wells)
2010MUA_Brochure
1. A Message About Your Drinking Water
We at Mount Laurel MUA are pleased to take this opportunity to share with you our water quality results for 2009. Our
water professionals are focused on providing the highest quality water, which is reflected in our results. In 2009, over 33,000
analyses were performed and the results in this report confirm that your tap water not only meets federal and state stan-
dards for drinking water, but it surpasses them.
Every day we deliver, on average, 4 million gallons of water to the community, with summer months supply increasing
up to 10 million gallons per day. We continue to investigate alternative water supply sources, from surface water treatment to
water reuse, to ensure our community has a safe, economical and dependable water supply now and in the future. We also
continue to make the necessary investments to maintain our facilities, so we can deliver this quality water directly to your tap 24
hours a day, 365 days a year.
Through the continued efforts of our diligent staff we are still able to provide water at less than a penny a gallon. Our
customers are our top priority and we are proud to provide you with the highest quality drinking water possible.
Sincerely,
Pamela J. Carolan, P.E.
Executive Director
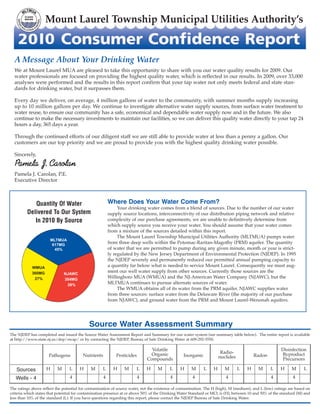
Quantity Of Water
Delivered To Our System
In 2010 By Source
Mount Laurel Township Municipal Utilities Authority’s
The NJDEP has completed and issued the Source Water Assessment Report and Summary for our water system (see summary table below). The entire report is available
at http://www.state.nj.us/dep/swap/ or by contacting the NJDEP, Bureau of Safe Drinking Water at 609-292-5550.
The ratings above reflect the potential for contamination of source water, not the existence of contamination. The H (high), M (medium), and L (low) ratings are based on
criteria which states that potential for contamination presence at or above 50% of the Drinking Water Standard or MCL is (H), between 10 and 50% of the standard (M) and
less than 10% of the standard (L). If you have questions regarding this report, please contact the NJDEP Bureau of Safe Drinking Water.
Pathogens Nutrients Pesticides
Volatile
Organic
Compounds
Inorganic
Radio-
nuclides Radon
Disinfection
Byproduct
Precursors
Sources
Wells - 4
H M L
4
H M L
4
H M L
4
H M L
4
H M
4
L H M
4
L H M L
4
H M
4
L
Source Water Assessment Summary
Where Does Your Water Come From?
Your drinking water comes from a blend of sources. Due to the number of our water
supply source locations, interconnectivity of our distribution piping network and relative
complexity of our purchase agreements, we are unable to definitively determine from
which supply source you receive your water. You should assume that your water comes
from a mixture of the sources detailed within this report.
The Mount Laurel Township Municipal Utilities Authority (MLTMUA) pumps water
from three deep wells within the Potomac-Raritan-Magothy (PRM) aquifer. The quantity
of water that we are permitted to pump during any given minute, month or year is strict-
ly regulated by the New Jersey Department of Environmental Protection (NJDEP). In 1995
the NJDEP severely and permanently reduced our permitted annual pumping capacity to
a quantity far below what is needed to service Mount Laurel. Consequently we must aug-
ment our well water supply from other sources. Currently those sources are the
Willingboro MUA (WMUA) and the NJ-American Water Company (NJAWC), but the
MLTMUA continues to pursue alternate sources of water.
The WMUA obtains all of its water from the PRM aquifer. NJAWC supplies water
from three sources: surface water from the Delaware River (the majority of our purchase
from NJAWC), and ground water from the PRM and Mount Laurel-Wenonah aquifers.
2. How Your Water Quality Is Protected
The Safe Drinking Water Act was first passed in 1974 and has
been updated numerous times since, the latest being 1996. Its
purpose was to develop monitoring requirements and implement
standards for hazardous substances in drinking water. The NJDEP
administers this Act to protect the quality of your drinking water.
The frequency of the MLTMUA’s Water Quality Monitoring
Program far exceeds the state required intervals. We feel this
higher level of quality control is required in order for us to deliver
the finest possible water.
Currently, the MLTMUA has received sampling waivers for
asbestos and synthetic organic contaminants. Waivers are issued
by the NJDEP following a thorough review of past water quality
results and vulnerability studies for specific contaminants due to
geographic location. In order to ensure that tap water is safe to
drink, the Environmental Protection Agency (EPA) prescribes
regulations which limit the amount of certain contaminants in
water provided by public water systems. The Food and Drug
Administration (FDA) regulations establish limits for contaminants
in bottled water which must provide the same protection for
public health. Drinking water, including bottled water, may
reasonably be expected to contain at least small amounts of some
contaminants. The presence of contaminants does not necessarily
indicate that water poses a health risk.
Explanation of Expected Contaminants
The sources of drinking water (both tap water and bottled
water) include rivers, lakes, streams, ponds, reservoirs, springs
and wells. As water travels over the surface of the land or through
the ground, it dissolves naturally occurring minerals and, in some
cases, radioactive materials and can pick up substances resulting
from the presence of animals or from human activity.
Contaminants that may be present in source water include:
Microbial contaminants, such as viruses and bacteria, which may
come from sewage treatment plants, septic systems, agricultural
livestock operations and wildlife.
Inorganic contaminants, such as salts and metals, which can be
naturally-occurring or result from urban stormwater runoff, indus-
trial or domestic wastewater discharges, oil and gas production
and mining or farming.
Pesticides and herbicides, which may come from a variety of
sources such as agriculture, urban stormwater runoff and residen-
tial uses.
Organic chemical contaminants, including synthetic and volatile
organic chemicals, which are by-products of industrial processes
and petroleum production and can also come from gas stations,
urban stormwater runoff and septic systems.
Radioactive contaminants, which can be naturally-occurring or be
the result of oil and gas production and mining activities.
More information about contaminants and potential health
effects can be obtained by calling the Environmental Protection
Agency’s (EPA) Safe Drinking Water Hotline (800-426-4791).
Why is there chlorine in my drinking water?
Without appropriate disinfection, your water could become
harmful. According to the EPA and health agencies, chlorine is
currently one of the most effective disinfectants to kill harmful
microorganisms. We add chlorine at the optimal level in order to
comply with all state and federal standards.
Do I need a water softener to reduce hardness?
The most apparent effect of hardness is seen in your water’s ability
to create soap foam. The optimal level for hardness in drinking
water is 75 to 100 mg/l. The hardness of our water is within this
range; therefore a water softener should not be necessary.
Groundwater Rule –
4-Log Treatment Certifications
The Mount Laurel MUA is pleased to announce that the Elbo
Lane Water Treatment Facility and the Well #7 Aquifer
Storage & Recovery Facility, as part of the Environmental
Protection Agency’s (EPA’s) Groundwater Rule, have received
certification from the New Jersey DEP confirming 4 log virus
removal/inactivation treatment. EPA’s Groundwater Rule
allows water systems to certify that a drinking water system
using groundwater can achieve 4-log removal/inactivation of
viruses; i.e. 99.99% removal/inactivation. Removal/inactiva-
tion occurs through filtration and/or disinfection. Achieving
this level of treatment depends on the unique conditions of
the system; i.e. storage time, water temperature, peak flow
and chlorine concentration. Inactivation is a function of the
disinfectant concentration and the amount of time the water
spends in contact with the disinfectant before the first service
connection. This rule requires that this level of disinfection be
maintained at all times. If this level of virus inactivation is
not maintained the MUA is required to notify the public that
the loss of 4 log treatment has occurred. This notification
would apply only to 4 log treatment, and would not be an
indicator that the normally required disinfection residuals
were not maintained. If you have any questions regarding
this rule, please visit the EPA website (www.epa.gov/
safewater/disinfection/gwr/regulation.html) or contact the
Mount Laurel MUA’s water department for more information.
Municipal Utilities Authority Members and Staff
Chairman Carl V. Buck, III
Vice Chairman Irwin Edelson
Secretary Frederick Braun
Member Elwood Knight
Member James Misselwitz
Executive Director Pamela J. Carolan, P.E.
If you have questions about your drinking water, call 234-0062
and ask for Chuck Bernheimer.
MUA Board meetings are held at 6:00PM,
the third Thursday of every month at the MUA’s facility located at 41 Elbo Lane.
visit us online at www.mltmua.com
3. Mount Laurel Township Municipal Utilities Authority’s
NJ American Water Company (NJAWC) Table of Detected Contaminants
PWS ID # 0327001
Contaminant MCL MCLG Highest Level Range Major Sources in Drinking Water
Inorganic Contaminants
Barium (ppm) 2 2 0.016 0.016 Discharge of drilling wastes; discharge from metal refineries; erosion of natural deposits.
Fluoride (ppm) 4 4 ND ND Erosion of natural deposits; water additive that promotes strong teeth
Nickel (ppb) 100 100 1.4 1.4 Erosion of natural deposits
Nitrate [as Nitrogen] (ppm) 10 10 1.19 1.19 Runoff from fertilizer use; industrial or domestic wastewater
discharges; erosion of natural deposits.
Treatment Byproducts
Bromate (ppb) 0.01 N/A 6 ND to 6 By-product of drinking water ozonation
Turbidity
Turbidity (ntu) * TT = 1 NTU 0 0.07 0.05-0.15 Soil Runoff
Turbidity (%) TT = % of N/A 100% N/A Soil Runoff
samples <0.3 NTU
Treatment Byproducts Precursor Removal
Total Organic Carbon (%) TT≥35%-39% N/A 28% ** 28% to 70% Naturally present in the environment
Removal
Radiologicals
Alpha Emitters (pCi/L) 15 N/A 11 *** ND to 11.2 Erosion of Natural Deposits
Combined Radium (226/228) (pCi/L) 5 N/A 4 *** ND to 4.6 Erosion of Natural Deposits
Uranium (ppb) 30 N/A 9 *** ND to 14 Erosion of Natural Deposits
N/A: Not Applicable
*100 % of the turbidity readings were below the treatment technique requirement of 0.3 NTU. Turbidity is a measure of the cloudiness of the water. It is used as an indication of the performance of the
surface water treatment in Delran. We monitor turbidity because it is a good indicator of water quality. High turbidity can hinder the effectiveness of disinfectants.
** Data represents the lowest removal of Total Organic Carbon. Compliance is based on running annual average. TOC has no health effects, but provides a medium for the formation of disinfection by-
products including trihalomethanes (THMs) and haloacetic acids (HAAs). Drinking water containing these by-products in excess of the MCL may lead to adverse health
effects, liver or kidney problems, or nervous system effects, and may lead to an increased risk of getting cancer. THMs and HAAs did not exceed the MCLs for this system.
*** This level represents an average of quarterly data. Compliance is based on a running annual average.
Definition of Terms
MCL (Maximum Contaminant Level): The highest level of a contaminant that is allowed in drinking water. MCL’s are set as close to the MCLG's as feasible using the best available treatment technology.
MCLG (Maximum Contaminant Level Goal): The level of a contaminant in drinking water below which there is no known or expected risk to health. MCLG's allow for a margin of safety.
MRDL (Maximum Residual Disinfectant Level): The highest level of a disinfectant allowed in drinking water. There is convincing evidence that addition of a disinfectant is necessary for control of microbial contaminants.
MRDLG (Maximum Residual Disinfectant Level Goal): The level of a drinking water disinfectant below which there is no known or expected risk to health. MRDLG’s do not reflect the benefits of the use of disinfectants
to control microbial contamination.
AL (Action Level): The concentration of a contaminant which, if exceeded, triggers treatment or other requirements which a water system must follow.
TT (Treatment Technique): A required process intended to reduce the level of a contaminant in drinking water.
ppm: Parts per Million (ie: 1 cent in $10,000) ntu: Nephelometric Turbidity Units ppb: Parts per Billion (ie: 1 cent in $10,000,000)
ND: Not Detected N/A: Not Applicable
Special Considerations Regarding Children, Pregnant Women, Nursing Mothers, and Others
Children may receive a slightly higher amount of a contaminant present in the water than adults, on a body weight basis, because they may drink a greater amount of water
per pound of body weight than adults. For this reason, reproductive or developmental effects are used for calculating a drinking water standard if these effects occur at
lower levels than other health effects of concern. If there is insufficient toxicity information for a chemical (for example, lack of data on reproductive or developmental
effects), an extra uncertainty factor may be incorporated into the calculation of the drinking water standard, thus making the standard more stringent, to account for additional
uncertainties regarding these effects. In the cases of lead and nitrate, effects on infants and children are the health endpoints upon which the standards are based.
Nitrate: Nitrate in drinking water at levels above 10 ppm is a health risk for infants of less than six months of age. High nitrate levels in drinking water can cause blue baby syndrome.
Nitrate levels may rise quickly for short periods of time because of rainfall or agricultural activity. If you are caring for an infant, you should ask for advice from your health provider.
Lead: If present, elevated levels of lead can cause serious health problems, especially for pregnant women and young children. Lead in drinking water is primarily from materials
and components associated with service lines and home plumbing. The MLTMUA is responsible for providing high quality drinking water, but cannot control the variety of
materials used in plumbing components. When your water has been sitting for several hours, you can minimize the potential for lead exposure by flushing your tap for 30 seconds
to 2 minutes before using water for drinking or cooking. If you are concerned about lead in your drinking water, you may wish to have your water tested. Information on lead in
drinking water, testing methods, and steps you can take to minimize exposure is available from the Safe Drinking Water Hotline or at http://www.epa.gov/safewater/lead.
We fluoridate our water. Consult your pediatrician or dentist to determine if fluoride supplements are recommended.
The tables included in this report list the detected constituents. Their presence doesn't necessarily indicate that water poses a health risk.
Tables of Detected Contaminants
4. Mount Laurel MUA (MLTMUA) Table of Detected Contaminants
PWS ID # 0324001
Willingboro MUA Table of Detected Contaminants
PWS ID # 0338001
N/A: Not Applicable ND: Not Detected
These data are from the most recent monitoring done in compliance with regulations. The state allows us to monitor for some contaminants less than once per year because the concentrations of
these comtaminants do not change frequently.
Contaminant MCL MCLG Highest Level Range Major Sources in Drinking Water
Inorganic Contaminants
Barium (ppm) 2 2 0.085 N/A Erosion of natural deposits.
Copper (ppm)* AL=1.3 1.3 90th % = 0.582 0 exceedances Corrosion of household plumbing systems; Erosion of natural deposits.
of AL
Fluoride (ppm) 4 4 0.432 N/A Erosion of natural deposits; Water additive which promotes strong teeth
Lead (ppb)* AL=15 0 90th % = <3 1 exceedance Corrosion of household plumbing systems; Erosion of natural deposits.
of AL
Nitrate [as Nitrogen] 10 10 0.187 N/A Runoff from fertilizer use; industrial or domestic wastewater discharges; erosion of natural deposits
(ppm)
Disinfectants
Chlorine (ppm) MRDL = 4 MRDLG = 4 0.49 Average 0.33-0.61 Water additive used to control microbes
Disinfection Byproducts
HAA5's
[Haloacetic Acids] (ppb) 60 N/A 6 Average ND-8.91 By-product of drinking water disinfection.
TTHM's
[Total Trihalomethanes] (ppb) 80 N/A 20 Average 2.23-48.50 By-product of drinking water disinfection.
Microbiological Contaminants
Total Coliform Bacteria Presence of coliform 0 1.82% N/A Naturally present in the environment
bacteria in < 5%
of monthly samples
Secondary Contaminants (RUL) Recommended Upper Limit
Sodium (ppm) 50 N/A 21.1 N/A Naturally present in the environment
Contaminant MCL MCLG Highest Level Range Major Sources in Drinking Water
Inorganic Contaminants
Nitrate [as Nitrogen] (ppm) 10 10 <0.5 <0.5 Runoff from fertilizer use; Leaching from septic tanks, sewage;
Erosion of natural deposits.
Regulated Volatile Organic Contaminants
Methyl tertiary butyl ether 70 70 0.77 ND-0.77 Leaking underground gasoline and fuel oil tanks,
(ppb) gasoline and fuel oil spills
1,1 Dichloroethane (ppb) 50 50 0.54 ND-0.54 Discharge from metal degreasing sites and other factories.
HAA5’s
[Haloacetic Acids] (ppb) 60 60 2 ND-2 By-product of drinking water disinfection.
TTHM’s
[Total Trihalomethanes] (ppb) 80 N/A 3 ND-3 By-product of drinking water disinfection.
Non-Regulated VOCs
Bromodichloromethane (ppb) N/A N/A 0.79 ND-0.79 By-product of drinking water disinfection.
Chloroform (ppb) N/A N/A 0.6 ND-0.6 By-product of drinking water disinfection.
Dibromochloromethane (ppb) N/A N/A 0.65 ND-0.65 By-product of drinking water disinfection.
Secondary/IOC Contaminants (RUL) Recommended Upper Limit
Sodium (ppm) 50 N/A 3.96 3.96
Chloride (ppm) 250 250 <5.00 <5.00
Manganese (ppm) 1 <0.01 <0.01
Radiological Contaminants
Radium 226 (pCi/L) 5 0 1.87 1.29-1.87 Erosion of natural deposits
Radium 228 (pCi/L) 5 0 2.26 1.3-2.26 Erosion of natural deposits
Gross Alpha (pCi/L) 15 0 12.11 11.66-12.11 Erosion of natural deposits
Uranium (URM) (ppb) 30 0 <0.001 <0.001 Erosion of natural deposits
Uranium (4006) (pCi/L) 30 0 0.47 0.12-0.47 Erosion of natural deposits
Lead/Copper Analysis (Distribution Tap Samplings)
Lead (ppb) AL=15 0 90th % = <0.002 0 exceedances of AL Corrosion of household plumbing systems; Erosion of natural deposits
Copper (ppm) AL=1.3 1.3 90th % = 0.361 0 exceedances of AL Corrosion of household plumbing systems; Erosion of natural deposits
These data are from the most recent monitoring done in compliance with regulations.
Some people may be more vulnerable to contaminants in drinking water than the general population. Immuno-compromised persons such as persons with cancer
undergoing chemotherapy, persons who have undergone organ transplants, people with HIV/AIDS or other immune system disorders, some elderly and infants can
be particularly at risk for infections. These people should seek advice about drinking water, from their health care providers. EPA/CDC guidelines on appropriate
means to lessen the risk of infection by Cryptosporidium and other microbial contaminants are available from the Safe Drinking Water Hotline (800-426-4791).