SlideShare a Scribd company logo
1 of 61
Poverty in India
Share of population in extreme poverty, 1981 to 2017
Poverty rate map of India by prevalence in 2012, among its states and union territories
Slums near the international airport in Mumbai/Bombay
India Poverty rate since 1993 based on World Bank $2.00 ppp value
India is a developing nation. Although its economy is growing, poverty is still a major challenge.
However, poverty is on the decline in India. According to an International Monetary Fund paper,
extreme poverty, defined by the World Bank as living on US$1.9 or less in purchasing power parity
(PPP) terms, in India was as low as 0.8% in 2019 and the country managed to keep it at that level in
2020 despite the unprecedented COVID-19 outbreak. [1][2] According to World Bank, extreme
poverty has reduced by 12.3% between 2011 and 2019 from 22.5% in 2011 to 10.2% in 2019. A
working paper of the bank said rural poverty declined from 26.3% in 2011 to 11.6% in 2019. The
decline in urban areas was from 14.2% to 6.3% in the same period.The poverty level in rural and
urban areas went down by 14.7 and 7.9 percentage points, respectively.[3] According to United
Nations Development Programme administrator Achim Steiner, India lifted 271 million people out of
extreme poverty in a 10-year time period from 2005–2006 to 2015–2016. A 2020 study from the
World Economic Forum found "Some 220 million Indians sustained on an expenditure level of less
than Rs 32 / day—the poverty line for rural India—by the last headcount of the poor in India in
2013."[4]
The World Bank has been revising its definition and benchmarks to measure poverty since 1990–
1991, with a $0.2 per day income on purchasing power parity basis as the definition in use from
2005 to 2013.[5] Some semi-economic and non-economic indices have also been proposed to
measure poverty in India. For example, in order to determine whether a person is poor, the Multi-
dimensional Poverty Index places a 13% weight on the number of years that person spent in school
or engaged in education and a 6.25% weight on the financial condition of that person.[6]
The different definitions and underlying small sample surveys used to determine poverty in India
have resulted in widely varying estimates of poverty from the 1950s to 2010s. In 2019, the Indian
government stated that 6.7% of its population is below its official poverty limit.[7] Based on 2019's
PPPs International Comparison Program,[8][9] According to the United Nations Millennium
Development Goals (MDG) programme, 80 million people out of 1.2 billion Indians, roughly equal to
6.7% of India's population, lived below the poverty line of $1.25 [10] and 84% of Indians lived on less
than $6.85 per day in 2019.[11]
From the late 19th century through the early 20th century, under the British Raj, poverty in India
intensified, peaking in the 1920s.[12][13] Famines and diseases killed millions in multiple vicious
cycles throughout the 19th and early 20th centuries.[14][15] After India gained its independence in
1947, mass deaths from famines were prevented.[16] Since 1991, rapid economic growth has led to
a sharp reduction in extreme poverty in India.[17][18] However, those above the poverty line live a
fragile economic life.[19] As per the methodology of the Suresh Tendulkar Committee report, the
population below the poverty line in India was 354 million (29.6% of the population) in 2009–2010
and was 69 million (21.9% of the population) in 2011–2012.[20] In 2014, the Rangarajan Committee
said that the population below the poverty line was 454 million (38.2% of the population) in 2009–
2010 and was 363 million (29.5% of the population) in 2011–2012.[21] Deutsche Bank Research
estimated that there are nearly 300 million people who are in the middle class.[22] If these previous
trends continue, India's share of world GDP will significantly increase from 7.3% in 2016 to 8.5% by
2020.[23] In 2012, around 170 million people, or 12.4% of India's population, lived in poverty
(defined as $1.90 (Rs 123.5)), an improvement from 29.8% of India's population in 2009.[24][25] In
their paper, economists Sandhya Krishnan and Neeraj Hatekar conclude that 600 million people, or
more than half of India's population, belong to the middle class.[26]
The Asian Development Bank estimates India's population to be at 1.28 billion with an average
growth rate of 1.3% from 2010 to 2015. In 2014, 9.9% of the population aged 15 years and above
were employed. 6.9% of the population still lives below the national poverty line and 63% in extreme
poverty (December 2018)[27] The World Poverty Clock shows real-time poverty trends in India,
which are based on the latest data, of the World Bank, among others. As per recent estimates, the
country is well on its way of ending extreme poverty by meeting its sustainable development goals
by 2030.[28] According to Oxfam, India's top 1% of the population now holds 73% of the wealth,
while 670 million citizens, comprising the country's poorest half, saw their wealth rise by just 1%.[29]
Contents
1 Definition of poverty
2 Poverty prevalence and estimates
2.1 After Independence
2.1.1 1950s
2.1.2 1960s
2.1.3 1970s – 1980s
2.1.4 1990s
2.1.5 2000s
2.1.6 Reserve Bank of India (2012)
2.1.7 2010s
2.1.8 Semi-economic measures of poverty
3 Other estimates
4 Economic impact of British imperialism
5 Reduction in poverty
6 See also
7 References
8 Further reading
9 External links
Definition of poverty
Poverty is the state of not having enough material possessions or income for a person basic need.
Poverty may include social, economic, and political elements. Absolute poverty is the complete lack
of the means necessary to meet basic personal needs, such as food, clothing, and shelter.
Economic measures
There are several definitions of poverty, and scholars disagree as to which definition is appropriate
for India.[30][31] Inside India, both income-based poverty definition and consumption-based
poverty statistics are in use.[32] Outside India, the World Bank and institutions of the United Nations
use a broader definition to compare poverty among nations, including India, based on purchasing
power parity (PPP), as well as nominal relative basis.[33][34] Each state in India has its own poverty
threshold to determine how many people are below its poverty line and to reflect regional economic
conditions. These differences in definitions yield a complex and conflicting picture about poverty in
India, both internally and when compared to other developing countries of the world.[35]
According to the World Bank, India accounted for the world's largest number of poor people in 2012
using revised methodology to measure poverty, reflecting its massive population. However, in terms
of percentage, it scored somewhat lower than other countries holding large poor populations.[36] In
July 2018, World Poverty Clock, a Vienna-based think tank, reported that a minimal 5.3% or 70.6
million Indians lived in extreme poverty compared to 44% or 87 million Nigerians. In 2019, Nigeria
and Congo surpassed India in terms of total population earning below $1.9 a day.[37][38] Although
India is expected to meet the United Nations' Sustainable Development Goals on extreme poverty in
due time, a very large share of its population lives on less than $3.2 a day, putting India's economy
safely into the category of lower middle income economies.
As with many countries,[39] poverty was historically defined and estimated in India using a
sustenance food standard. This methodology has been revised. India's current official poverty rates
are based on its Planning Commission's data derived from so-called Tendulkar methodology.[40] It
defines poverty not in terms of annual income, but in terms of consumption or spending per
individual over a certain period for a basket of essential goods. Furthermore, this methodology sets
different poverty lines for rural and urban areas. Since 2007, India has set its official threshold at ₹
26 a day ($0.43) in rural areas and about ₹ 32 per day ($0.53) in urban areas.[41] While these
numbers are lower than the World Bank's $1.25 per day income-based definition, the definition is
similar to China's US$0.65 per day official poverty line in 2008.[42]
The World Bank's international poverty line definition is based on purchasing power parity basis, at
$1.25 per day.[43][44] This definition is motivated by the fact that the price of the same goods and
services can differ significantly when converted into local currencies around the world. A realistic
definition and comparison of poverty must consider these differences in costs of living, or must be
on purchasing power parity (PPP) basis. On this basis, currency fluctuations and nominal numbers
become less important, the definition is based on the local costs of a basket of essential goods and
services that people can purchase. By World Bank's 2014 PPP definition, India's poverty rate is
significantly lower than previously believed.[35]
Mixed, semi-economic and non-economic measures
As with economic measures, there are many mixed or non-economic measures of poverty and
experts contest which one is most appropriate for India. For example, Dandekar and Rath in 1971
suggested a measure of poverty rate that was based on number of calories consumed.[45] In 2011,
Alkire et al. suggested a poverty rate measure so-called Multi-dimensional Poverty Index (MPI),
which only puts a 6.25% weight to assets owned by a person and places 33% weight on education
and number of years spent in school.[6] These non-economic measures remain controversial and
contested as a measure of poverty rate of any nation, including India.[46][47]
National poverty lines comparison
(Note: this is historical data, not current)
Country
Poverty line
(per day)
Year Reference
India 32 rupees ($0.5) 2017 [41]
Argentina 481 pesos ($11.81) 2017 [48]
China 6.3 yuan ($1) 2011 [49]
Nigeria 65 naira ($0.4) 2011 [50]
United States $14[51] 2005 [52][53]
Comparison with alternate international definitions
India determines its household poverty line by summing up the individual per capita poverty lines of
the household members. This practice is similar to many developing countries, but different from
developed countries such as the United States who adjusts their poverty line on an incremental basis
per additional household member. For example, in the United States, the poverty line for a
household with just one member was set at $11,670 per year for 2014, while it was set at $23,850
per year for a 4-member household (or $5963 per person for the larger household).[53] The
rationale for the differences arise from the economic realities of each country. In India, households
may include surviving grandparents, parents, and children. They typically do not incur any or
significant rent expenses every month particularly in rural India, unlike housing in mostly urban
developed economies. The cost of food and other essentials are shared within the household by its
members in both cases. However, a larger portion of a monthly expenditure goes to food in poor
households in developing countries,[54] while housing, conveyance, and other essentials cost
significantly more in developed economies.
For its current poverty rate measurements, India calculates two benchmarks. The first includes a
basket of goods, including food items but excluding the implied value of home, value of any means
of conveyance or the economic value of other essentials created, grown or used without a financial
transaction, by the members of a household. The second poverty line benchmark adds rent value of
residence as well as the cost of conveyance, but nothing else, to the first benchmark.[55] This
practice is similar to those used in developed countries for non-cash income equivalents and a
poverty line basis.[56][57]
India's proposed but not yet adopted official poverty line, in 2014, was ₹972 (US$12) a month in
rural areas or ₹1,407 (US$18) a month in cities. The current poverty line is 1,059.42 Indian Rupees
(62 PPP USD) per month in rural areas and 1,286 Indian rupees (75 PPP USD) per month in urban
areas.[58] India's nationwide average poverty line differs from each state's poverty line. For
example, in 2011–2012, Puducherry had its highest poverty line of ₹1,301 (US$16) a month in rural
and ₹1,309 (US$16) a month in urban areas, while Odisha had the lowest poverty thresholds of ₹695
(US$8.70) a month for rural and ₹861 (US$11) a month for its urban areas.[59]
Poverty prevalence and estimates
The 19th century and early 20th century saw increasing poverty in India during the colonial
era.[12][60] Over this period, the colonial government de-industrialized India by reducing garments
and other finished products manufactured by artisans in India. Instead, they imported these
products from Britain's expanding industry due to the many industrial innovations of the 19th
century. Additionally, the government simultaneously encouraged the conversion of more land into
farms and more agricultural exports from India.[61][62] Eastern regions of India along the Ganges
river plains, such as those now known as eastern Uttar Pradesh, Bihar, Jharkhand and West
Bengal,[63] were dedicated to producing poppy and opium. These items were then exported to
southeast and east Asia, particularly China. The East India Company initially held an exclusive
monopoly over these exports, and the colonial British institutions later did so as well.[64] The
economic importance of this shift from industry to agriculture in India was large;[65] by 1850, it
created nearly 1,000 square kilometres of poppy farms India's fertile Ganges plains. This
consequently led to two opium wars in Asia, with the second opium war fought between 1856 and
1860. After China agreed to be a part of the opium trade, the colonial government dedicated more
land exclusively to poppy.[62] The opium agriculture in India rose from 1850 through 1900, when
over 500,000 acres of the most fertile Ganges basin farms were devoted to poppy cultivation.[66]
Additionally, opium processing factories owned by colonial officials were expanded in Benares and
Patna, and shipping expanded from Bengal to the ports of East Asia such as Hong Kong, all under
exclusive monopoly of the British. By the early 20th century, 3 out of 4 Indians were employed in
agriculture, famines were common, and food consumption per capita declined in every decade.[13]
In London, the late 19th century British parliament debated the repeated incidence of famines in
India, and the impoverishment of Indians due to this diversion of agriculture land from growing food
staples to growing poppy for opium export under orders of the colonial British empire.[62][66]
Poverty was intense during colonial era India. Numerous famines and epidemics killed millions of
people each.[14][67] Upper image is from 1876 to 1879 famine in South of British India that starved
and killed over 6 million people, while lower image is of child who starved to death during the
Bengal famine of 1943.
These colonial policies moved unemployed artisans into farming, and transformed India into a region
increasingly abundant in land, unskilled labour, and low productivity. This consequently made India
scarce in skilled labour, capital and knowledge.[12][13] On an inflation adjusted 1973 rupee basis,
the average income of an Indian agrarian labourer was Rs. 7.20 per year in 1885, against an inflation
adjusted poverty line of Rs. 23.90 per year. Thus, not only was the average income below the
poverty line, but the intensity of poverty was also severe. The intensity of poverty increased from
1885 to 1921, before being reversed. However, the absolute poverty rates continued to be very high
through the 1930s.[12][68] The colonial policies on taxation and its recognition of land ownership
claims of zamindars and mansabdars, or Mughal era nobility, made a minority of families wealthy.
Additionally, these policies weakened the ability of poorer peasants to command land and credit.
The resulting rising landlessness and stagnant real wages intensified poverty.[12][69]
The National Planning Committee of 1936 noted the appalling poverty of undivided India.[70]
(...) there was lack of food, of clothing, of housing and of every other essential requirement of
human existence... the development policy objective should be to get rid of the appalling poverty of
the people.
— Nehru, The Discovery of India, (1946)
The National Planning Committee, notes Suryanarayana, then defined goals in 1936 to alleviate
poverty by setting targets in terms of nutrition (2400 to 2800 calories per adult worker), clothing (30
yards per capita per annum) and housing (100 sq. ft per capita).[70] This method of linking poverty
as a function of nutrition, clothing and housing continued in India after it became independent from
British colonial empire.
These poverty alleviation goals were theoretical, with administrative powers resident in the British
Empire. Poverty ravaged India. In 1943, for example, despite rising agricultural output in undivided
South Asia, the Bengal famine killed millions of Indians from starvation, disease and destitution.
Destitution was so intense in Bengal, Bihar, eastern Uttar Pradesh, Jharkhand and Orissa, that entire
families and villages were "wiped out" of existence. Village artisans, along with sustenance farming
families, died from lack of food, malnutrition and a wave of diseases.[15] The 1943 famine was not
an isolated tragedy. Devastating famines impoverished India every 5 to 8 years in the late 19th
century and the first half of the 20th century. Between 6.1 and 10.3 million people starved to death
in British India during the 1876–1879 famine, while another 6.1 to 8.4 million people died during the
1896–1898 famine.[71] The Lancet reported that 19 million people died from starvation and the
consequences of extreme poverty in British India between 1896 and 1900.[72] Sir MacDonnell
observed the suffering and poverty in 1900, and noted, "people died like flies" in Bombay.[73]
After Independence
1950s
Year[74]
Total
Population
(millions)
50%lived on
(₹ / year)
95% lived on
(₹ / year)
1956–57 359 180 443
1961–62 445 204 498
1967–68 514 222 512
Minhas published his estimates of poverty rates in 1950s India as cyclical and a strong function of
each year's harvest. Minhas disagreed with the practice of using calories as the basis for poverty
estimation and proposed a poverty line based on real expenditure per year (Rs 240 per annum). In
1956–57, a good harvest year, he computed India's poverty rate to be 65% (215 million
people).[74][75] For 1960, Minhas estimated the poverty to be 59%.[76]
1960s
A Working Group was formed in 1962 to attempt to set a poverty line for India.[77][78] This Working
Group used calories required for survival, and income needed to buy those calories in different parts
of rural India, to derive an average poverty line of Rs. 20 per month at 1960–61 prices.[79]
Estimates of poverty in India during the 1960s varied widely. Dandekar and Rath, on the behalf of
then Indian government, estimated that the poverty rate in 1960s remained generally constant at
41%. Ojha, in contrast, estimated that there were 190 million people (44%) in India below official
poverty limit in 1961, and that this below-poverty line number increased to 289 million people (70%)
in 1967. Bardhan also concluded that Indian poverty rates increased through the 1960s, reaching a
high of 54%.[76][80] Those above the 1960s poverty level of Rs 240 per year, were in fragile
economic groups as well and not doing well either. Minhas estimated that 95% of India's people
lived on Rs 458 per year in 1963–64, while the richest 5% lived on an average of Rs 645 per year (all
numbers inflation adjusted to 1960–61 Rupee).[74]
1970s – 1980s
Dandekar and Rath[81] in 1971 used a daily intake of 2,250 calories per person to define the poverty
line for India. Using NSSO data regarding household expenditures for 1960–61, they determined that
in order to achieve this food intake and other daily necessities, a rural dweller required an annual
income of ₹ 170.80 per year (₹ 14.20 per month, adjusted to 1971 Rupee). An urban dweller
required ₹ 271.70 per year (₹ 22.60 per month). They concluded from this study that 40 percent of
rural residents and 50 percent of urban residents were below the poverty line in 1960–61.[82]
Poverty alleviation has been a driver for India's Planning Commission's Task Force on Projections of
Minimum Needs and Effective Consumption Demand of the Perspective Planning Division. This
division, in 1979, took into account differences in calorie requirements for different age groups,
activity levels, and sex. They determined that the average rural dweller needed around 2400
calories, and those in urban areas required about 2100 calories per person per day. To satisfy the
food requirement, the Task Force estimated that a consumer spending in 1973–74 of Rs.49.09 per
person per month in rural areas and Rs.56.64 in urban areas was appropriate measure to estimate
its poverty line.[83]
Poverty remained stubbornly high in India through the 1970s and 1980s. It created slogans such as
Garibi Hatao (meaning eliminate poverty) for political campaigns, during elections in early 1970s
through the 1980s.[84] Rural poverty rate exceeded 50%, using India's official poverty line for
1970s.[85][86]
Additionally, in 1976, the Indian government passed the Bonded Labor System Act in an effort to end
debt bondage in India, a practice which contributes to generational poverty.[87] Nevertheless, this
system is still in place today due to weak enforcement of this law.[87]
1990s
Another Expert Group was instituted in 1993, chaired by Lakdawala, to examine poverty line for
India. It recommended that regional economic differences are large enough that poverty lines
should be calculated for each state. From then on, a standard list of commodities were drawn up
and priced in each state of the nation, using 1973–74 as a base year. This basket of goods could then
be re-priced each year and comparisons made between regions. The Government of India began
using a modified version of this method of calculating the poverty line in India.[88]
There are wide variations in India's poverty estimates for 1990s, in part from differences in the
methodology and in the small sample surveys they poll for the underlying data. A 2007 report for
example, using data for late 1990s, stated that 77% of Indians lived on less than ₹ 20 a day (about
US$0.50 per day).[89] In contrast, S.G.Datt estimated India's national poverty rate to be 35% in 1994,
at India's then official poverty line of Rs 49 per capita, with consumer price index adjusted to June
1974 rural prices.[86]
2000s
The Saxena Committee report, using data from 1972 to 2000, separated calorific intake apart from
nominal income in its economic analysis of poverty in India, and then stated that 50% of Indians
lived below the poverty line.[90] The Planning Commission of India, in contrast, determined that the
poverty rate was 39%.
The National Council of Applied Economic Research estimated that 48% of the Indian households
earn more than ₹90,000 (US$1,127.10) annually (or more than US$ 3 PPP per person). According to
NCAER, in 2009, of the 222 million households in India, the absolutely poor households (annual
incomes below ₹45,000 (US$560)) accounted for only 15.6% of them or about 35 million (about 200
million Indians). Another 80 million households are in the income levels of ₹45,000 (US$560) to
₹90,000 (US$1,100) per year. These numbers are similar to World Bank estimates of the "below-the-
poverty-line" households that may total about 100 million (or about 456 million individuals).[91]
The Suresh Tendulkar Committee set up to look into the people living under the poverty line in India
submitted its report in November 2009.[92] It provided a new method of calculating the poverty line
based on per capita consumption expenditure per month or day. For rural areas, it was Rs 816 per
month or Rs 27 per day. For urban areas, it was Rs 1000 per month or Rs 33 per day. Using this
methodology, the population below the poverty line in 2009–2010 was 354 million (29.6% of the
population) and that in 2011–2012 was 269 million (21.9% of the population).[93]
Reserve Bank of India (2012)
In its annual report of 2012, the Reserve Bank of India named the state of Goa as having the least
poverty of 5.09% while the national average stood at 21.92%[7] The table below presents the
poverty statistics for rural, urban and combined percentage below poverty line (BPL) for each State
or Union Territory.[7] The highest poverty statistics for each category column is coloured light red
and the lowest poverty statistics for each category column is coloured light Blue in the table below.
hideState or
Union
Territory
No. of
Persons
(Thousands
) Rural
% of
Person
s
(Rural)
below
povert
y line
Poverty
line
(Rs)/mont
h (Rural)
No. of
Persons
(Thousands
) Urban
% of
Person
s
(Urban
)
below
povert
y line
Poverty
line
(Rs)/mont
h (Urban)
No. of
Persons
(Thousands
) Combined
% of
Persons
(Combined
)
below
poverty
line
Andhra
Pradesh
6180 10.96 860.00 1698 5.81 1009.00 7878 9.20
Arunachal
Pradesh
425 38.93 930.00 66 20.33 1060.00 491 34.67
Assam 9206 33.89 828.00 921 30.49 1008.00 10127 31.98
Bihar 32040 34.06 778.00 3775 31.23 923.00 35815 33.74
Chhattisgarh 8890 44.61 738.00 1522 24.75 849.00 10411 39.93
Goa 37 6.81 1090.00 38 4.09 1134.00 75 5.09
Gujarat 7535 21.50 932.00 2688 10.14 1152.00 10223 16.63
Haryana 1942 11.64 1015.00 941 10.28 1169.00 2883 11.16
Himachal 529 8.48 913.00 30 4.33 1064.00 559 8.06
hideState or
Union
Territory
No. of
Persons
(Thousands
) Rural
% of
Person
s
(Rural)
below
povert
y line
Poverty
line
(Rs)/mont
h (Rural)
No. of
Persons
(Thousands
) Urban
% of
Person
s
(Urban
)
below
povert
y line
Poverty
line
(Rs)/mont
h (Urban)
No. of
Persons
(Thousands
) Combined
% of
Persons
(Combined
)
below
poverty
line
Pradesh
Jammu &
Kashmir
1073 11.54 891.00 253 7.20 988.00 1327 10.35
Jharkhand 10409 40.84 748.00 2024 24.83 974.00 12433 36.96
Karnataka 9280 24.53 902.00 3696 15.25 1089.00 12976 20.91
Kerala 1548 9.14 1018.00 846 4.97 987.00 2395 7.05
Madhya
Pradesh
19095 35.74 771.00 4310 21.00 897.00 23406 31.65
Maharashtr
a
15056 24.22 967.00 4736 9.12 1126.00 19792 17.35
Manipur 745 38.80 1118.00 278 32.59 1170.00 1022 36.89
Meghalaya 304 12.53 888.00 57 9.26 1154.00 361 11.87
Mizoram 191 35.43 1066.00 37 6.36 1155.00 227 20.40
Nagaland 276 19.93 1270.00 100 16.48 1302.00 376 18.88
Odisha 12614 35.69 695.00 1239 17.29 861.00 13853 32.59
Punjab 1335 7.66 1054.00 982 9.24 1155.00 2318 8.26
Rajasthan 8419 16.05 905.00 1873 10.69 1002.00 10292 14.72
Sikkim 45 9.85 930.00 6 3.66 1226.00 51 8.19
Tamil Nadu 5923 15.83 880.00 2340 6.54 937.00 8263 11.28
Tripura 449 16.53 798.00 75 7.42 920.00 524 14.05
Uttar 47935 30.40 768.00 11884 26.06 941.00 59819 29.43
hideState or
Union
Territory
No. of
Persons
(Thousands
) Rural
% of
Person
s
(Rural)
below
povert
y line
Poverty
line
(Rs)/mont
h (Rural)
No. of
Persons
(Thousands
) Urban
% of
Person
s
(Urban
)
below
povert
y line
Poverty
line
(Rs)/mont
h (Urban)
No. of
Persons
(Thousands
) Combined
% of
Persons
(Combined
)
below
poverty
line
Pradesh
Uttarakhand 825 11.62 880.00 335 10.48 1082.00 1160 11.26
West Bengal 14114 22.52 783.00 4383 14.66 981.00 18498 19.98
Andaman &
Nicobar
Islands
4 1.57 – 0 0.00 – 4 1.00
Chandigarh 0 0.00 – 234 22.31 – 235 21.81
Dadra &
Nagar Haveli
115 62.59 – 28 15.38 – 143 39.31
Daman and
Diu
0 0.00 – 26 12.62 – 26 9.86
Delhi 50 12.92 1145.00 1646 9.84 1134.00 1696 9.91
Lakshadwee
p
0 0.00 – 2 3.44 – 2 2.77
Puducherry 69 17.06 1301.00 55 6.30 1309.00 124 9.69
India 216658 25.70 816.00 53125 13.70 1000.00 269783 21.92
2010s
The World Bank has reviewed its poverty definition and calculation methodologies several times
over the last 25 years. In early 1990s, The World Bank anchored absolute poverty line as $1 per day.
This was revised in 1993, and the absolute poverty line was set at $1.08 a day for all countries on a
purchasing power parity (PPP) basis, after adjusting for inflation to the 1993 US dollar. In 2005, after
extensive studies of the cost of living across the world, The World Bank raised the measure for global
poverty line to reflect the observed higher cost of living.[5] Thereafter, the World Bank determined
poverty rates from those living on less than US$1.25 per day on 2005 PPP basis, a measure that has
been widely used in media and scholarly circles.
In May 2014, after revisiting its poverty definition, methodology and economic changes around the
world, the World Bank proposed another major revision to PPP calculation methodology,
international poverty line and indexing it to 2011 US dollar.[35] The new method proposes setting
poverty line at $1.78 per day on 2011 PPP basis. According to this revised World Bank methodology,
India had 179.6 million people below the new poverty line, China had 137.6 million, and the world
had 872.3 million people below the new poverty line on an equivalent basis as of 2013. India, in
other words, while having 17.5% of total world's population, had 20.6% share of world's poor.[9][35]
In October 2015, the World Bank updated the international poverty line to US$1.90 a day.
The Rangarajan Committee set up to look into the poverty line estimation in India submitted its
report in June 2014.[94] It amended the calculation of the poverty line based on per capita
consumption expenditure per month or day given by the Tendulkar Committee.[95] The new
poverty threshold for rural areas was fixed at Rs 972 per month or Rs 32 per day. For urban areas, it
was fixed at Rs 1407 per month or Rs 47 per day. Under this methodology, the population below the
poverty line in 2009–2010 was 454 million (38.2% of the population) and that in 2011–2012 was 363
million (29.5% of the population).[96]
From November 2017, the World Bank started reporting poverty rates for all countries using two
new international poverty lines: a "lower middle-income" line set at $3.20 per day and an "upper
middle-income" line set at $5.50 per day. These are in addition to the earlier poverty line of $1.90
per day. The new lines are supposed to serve two purposes. One, they account for the fact that
achieving the same set of capabilities may need a different set of goods and services in different
countries and, specifically, a costlier set in richer countries. Second, they allow for cross-country
comparisons and benchmarking both within and across developing regions. India falls in the lower
middle-income category. Using the $3.20 per day poverty line, the percentage of the population
living in poverty in India (2011) was 60%. This means that 763 million people in India were living
below this poverty line in 2011.[97]
Semi-economic measures of poverty
Other measures such as the semi-economic Multi-dimensional Poverty Index (MPI), which places
33% weight on education and number of schooling years in its definition of poverty, and places
6.25% weight on income and assets owned, suggests there were 650 million people (53.7% of
population) living in MPI-poverty in India.[6] 421 million of MPI-defined poor are concentrated in
eight North Indian and East Indian states of Bihar, Chhattisgarh, Jharkhand, Madhya Pradesh, Orissa,
Rajasthan, Uttar Pradesh and West Bengal. The table below presents this semi-economic poverty
among the states of India based on the Multi-dimensional Poverty Index, using a small sample
survey data for Indian states in 2005.[98]
showMPI
rank
States
Population
(in millions)
2007
MPI
Proportion
of MPI-poor
Average
intensity
Contribution to
overall MPI-
poverty
Number of
MPI poor (in
millions)
— India 1,164.7 0.296 55.4% 53.5% – 645.0
1 Kerala 35.0 0.065 15.9% 40.9% 0.6% 5.6
showMPI
rank
States
Population
(in millions)
2007
MPI
Proportion
of MPI-poor
Average
intensity
Contribution to
overall MPI-
poverty
Number of
MPI poor (in
millions)
2 Goa 1.6 0.094 21.7% 43.4% 0.0% 0.4
3 Punjab 27.1 0.120 26.2% 46.0% 1.0% 7.1
4
Himachal
Pradesh
6.7 0.131 31.0% 42.3% 0.3% 2.1
5 Tamil Nadu 68.0 0.141 32.4% 43.6% 2.6% 22.0
6 Uttarakhand 9.6 0.189 40.3% 46.9% 0.5% 3.9
7 Maharashtra 108.7 0.193 40.1% 48.1% 6.0% 43.6
8 Haryana 24.1 0.199 41.6% 47.9% 1.3% 10.0
9 Gujarat 98.3 0.205 21.5% 49.2% 0.4% 0.8
10
Jammu and
Kashmir
12.2 0.209 43.8% 47.7% 0.7% 5.4
11
Andhra
Pradesh
83.9 0.211 44.7% 47.1% 5.1% 37.5
12 Karnataka 58.6 0.223 46.1% 48.3% 4.2% 27.0
13
Northeast
Indian States
44.2 0.303 57.6% 52.5% 4.0% 25.5
14 West Bengal 89.5 0.317 58.3% 54.3% 8.5% 52.2
15 Orissa 40.7 0.345 64.0% 54.0% 4.3% 26.0
16 Rajasthan 65.4 0.351 64.2% 54.7% 7.0% 41.9
17 Uttar Pradesh 192.6 0.386 69.9% 55.2% 21.3% 134.7
18 Chhattisgarh 23.9 0.387 71.9% 53.9% 2.9% 17.2
19
Madhya
Pradesh
70.0 0.389 69.5% 56.0% 8.5% 48.6
20 Jharkhand 30.5 0.463 77.0% 60.2% 4.2% 23.5
showMPI
rank
States
Population
(in millions)
2007
MPI
Proportion
of MPI-poor
Average
intensity
Contribution to
overall MPI-
poverty
Number of
MPI poor (in
millions)
21 Bihar 95.0 0.499 81.4% 61.3% 13.5% 77.3
Other estimates
According to a 2011 poverty Development Goals Report, as many as 320 million people in India and
China are expected to come out of extreme poverty in the next four years, with India's poverty rate
projected to drop from 51% in 1990 to about 22% in 2015.[99] The report also indicates that in
Southern Asia, only India is on track to cut poverty by half by the 2015 target date.[99] In 2015,
according to United Nations Millennium Development Goals (MGD) programme, India has already
achieved the target of reducing poverty by half, with 24.7% of its 1.2 billion people in 2011 living
below the poverty line or having income of less than $1.25 a day, the U.N. report said. The same
figure was 49.4% in 1994. India had set a target of 23.9% to be achieved by 2015.[100]
According to Global Wealth Report 2016[101] compiled by Credit Suisse Research Institute, India is
the second most unequal country in the world with the top one per cent of the population owning
58% of the total wealth.[102]
Global Hunger Index
Global Hunger Index (GHI) is an index that places a third of weight on proportion of the population
that is estimated to be undernourished, a third on the estimated prevalence of low body weight to
height ratio in children younger than five, and remaining third weight on the proportion of children
dying before the age of five for any reason. According to 2011 GHI report, India has improved its
performance by 22% in 20 years, from 30.4 to 23.7 over 1990 to 2011 period.[103] However, its
performance from 2001 to 2011 has shown little progress, with just 3% improvement. A sharp
reduction in the percentage of underweight children has helped India improve its hunger record on
the Global Hunger Index (GHI) 2014. India now ranks 55 among 76 emerging economies. Between
2005 and 2014, the prevalence of underweight children under the age of five fell from 43.5% to
30.7%.[104]
Poverty: 2011–2012 Percentage of people by Caste[105]
Findings below are based on a survey conducted during 2011–12. Total population of India then:
1,276,267,631
Caste-wise population distribution:[105]
Caste % of total population No. of People
FC 28.0% 357M
OBC 44.1% 563M
SC 19.0% 242M
ST 8.9% 114M
Total 100% 1276M
Poverty in India based on caste:[105]
Caste % of Poverty (intra-caste) No. of People % of Poverty in total population
FC 12.5% 44.6M 3.5%
OBC 20.7% 116.5M 9.1%
SC 29.4% 71.2M 5.8%
ST 43.0% 49.0M 3.8%
Total - 281M 22%
From the above 2 tables, we could derive the following to see if the distribution of poverty follows as
that of the total population:
Caste % of total population Poverty % over poverty population
FC 28.0% 15.9%
OBC 44.1% 41.4%
SC 19.0% 25.3%
ST 8.9% 17.4%
Poverty in India based on Social and Religious Classes: The Sachar Committee looked at the Poverty
by Social and Religious Classes[106]
Social and Religious Class Percentage of Living in Poverty
Urban Hindus 20.4%
Urban Hindu General 8.3%
Urban Hindu OBC 25.1%
Urban Hindu SC/ST 36.4%
Urban Muslims 38.4%
Urban Other Minorities 12.2%
Rural Hindus 22.6%
Rural Hindu General 9.0%
Rural Hindu OBC 19.5%
Rural Hindu SC/ST 34.8%
Rural Muslims 26.9%
Rural Other Minorities 14.3%
Economic impact of British imperialism
The subject of the economic impact of British imperialism on India was raised by British Whig
politician Edmund Burke who in 1778 began a seven-year impeachment trial against Warren
Hastings and the East India Company on charges including mismanagement of the Indian economy.
Contemporary historian Rajat Kanta Ray argues the economy established by the British in the 18th
century was a form of plunder and a catastrophe for the traditional economy of India, depleting food
and money stocks and imposing high taxes that helped cause the famine of 1770, which killed a third
of the people of Bengal.[107]
Reduction in poverty
Main article: Poverty alleviation programmes in India
Since the 1950s, the Indian government and non-governmental organisations have initiated several
programs to alleviate poverty, including subsidising food and other necessities, increased access to
loans, improving agricultural techniques and price supports, promoting education, and family
planning. These measures have helped eliminate famines, cut absolute poverty levels by more than
half, and reduced illiteracy and malnutrition.
Although the Indian economy has grown steadily over the last two decades, its growth has been
uneven when comparing social groups, economic groups, geographic regions, and rural and urban
areas.[108][109] For the year 2015–16, the GSDP growth rates of Andhra Pradesh, Bihar and Madhya
Pradesh was higher than Maharashtra, Odisha or Punjab.[110] Though GDP growth rate matters a
lot economically, the debate is moving towards another consensus in India, where unhealthy
infatuation with GDP growth matters less and holistic development or all-inclusive growth matters
more.[111] While India may well be on the path to eradicating extreme poverty, it still lags well
behind in other important development indicators, even in comparison to some of its neighbouring
countries, especially in regard to health and education.[112]
Despite significant economic progress, one quarter of the nation's population earns less than the
government-specified poverty threshold of ₹32 per day (approximately US$ 0.6).[113]
According to the 2001 census, 35.5% of Indian households used banking services, 35.1% owned a
radio or transistor, 31.6% a television, 9.1% a phone, 43.7% a bicycle, 11.7% a scooter, motorcycle or
a moped, and 2.5% a car, jeep or van; 34.5% of the households had none of these assets.[114]
According to Department of Telecommunications of India, the phone density reached 73.34% by
December 2012 and as an annual growth decreased by −4.58%.[115] This tallies with the fact that a
family of four with an annual income of ₹137,000 (US$1,700) could afford some of these luxury
items.
The World Bank's Global Monitoring Report for 2014–15 on the Millennium Development Goals says
India has been the biggest contributor to poverty reduction between 2008 and 2011, with around
140 million or so lifted out of absolute poverty.[116] Since the early 1950s, the Indian government
has initiated various schemes to help the poor attain self-sufficiency in food production. A few
examples of these initiatives include ration cards and price controls over the supply of basic
commodities, particularly food at controlled prices, available throughout the country. These efforts
prevented famines, but did little to eliminate or reduce poverty in rural or urban areas between
1950 and 1980.[117]
India's rapid economic growth rate since 1991 is one of the main reasons for a record decline in
poverty.[17][18][118] Another reason proposed is India's launch of social welfare programs such as
the Mahatma Gandhi National Rural Employment Guarantee Act (MGNREGA) and the Midday Meal
Scheme in government schools.[119] In a 2012 study, Klonner and Oldiges, concluded that
MGNREGA helps reduce rural poverty gap (intensity of rural poverty) and seasonal poverty, but not
overall poverty.[120][121] However, there is a disturbing side, as deprivation has tended to increase,
and that too among the most deprived sections. According to the latest statistics published by the
Census of India, among scheduled tribes, 44.7% of people were farmers working on their own land in
2001; however, this number came down to 34.5% in 2011. Among scheduled castes, this number
declined from 20% to 14.8% during the same period. This data is corroborated by other data from
the census, which also says that the number of people who were working on others' land (landless
laborers), increased from 36.9% in 2001 to 44.4% among scheduled castes SC and from 45.6% to
45.9% among scheduled tribes.[122]
India has achieved annual growth exceeding 7 percent over the last 15 years and continues to pull
millions of people out of poverty, according to the World Bank. The country has halved its poverty
rate over the past three decades and has seen strong improvements in most human development
outcomes, a report by the international financial institution has found. Growth is expected to
continue and the elimination of extreme poverty in the next decade is within reach, said the bank,
which warned that the country's development trajectory faces considerable challenges.[123]
See also
Economic and socio-economic
Economy of India
Income in India
India State Hunger Index
Poverty rate by state
Labour in India
Social issues in India
Hawker (trade)
Debt bondage in India
Housing
Illegal housing in India
List of slums in India
Housing in India
Pavement dwellers
Street children in India
Utilities
Electricity sector in India
Manual scavenging
Water supply and sanitation in India
Corruption
Corruption in India
Indian black money
Other
Family planning in India
Malnutrition in India
Women in agriculture in India
References
^ "India kept extreme poverty below 1% despite pandemic: IMF paper".
^ "India has almost wiped out extreme poverty: International Monetary Fund". 7 April 2022.
^ "Worldbank Search".
^ "How India remains poor: 'It will take 7 generations for India's poor to reach mean income'".
Downtoearth.org.in. Retrieved 28 February 2022.
^ Jump up to: a b Martin Ravallion, Shaohua Chen and Prem Sangraula (2008). "Dollar a Day
Revisited" (PDF). The World Bank.
^ Jump up to: a b c "Country Briefing: India, Multidimensional Poverty Index (MPI) At a Glance"
(PDF). Oxford Poverty and Human Development Initiative. Retrieved 16 August 2017.
^ Jump up to: a b c "Number and Percentage of Population Below Poverty Line". Reserve Bank of
India. 2012. Archived from the original on 7 April 2014. Retrieved 4 April 2014.
^ World Bank's $1.25/day poverty measure- countering the latest criticisms The World Bank (January
2010). Retrieved 16 August
2017.1|page=50|url=https://openknowledge.worldbank.org/bitstream/handle/10986/20384/97814
64803611.pdf}}
^ Jump up to: a b Homi Kharas; Laurence Chandy (5 May 2014). "What Do New Price Data Mean for
the Goal of Ending Extreme Poverty?". Washington D.C.: Brookings Institution. Retrieved 16 August
2017.
^ Puja Mehra (2 April 2016). "8% GDP growth helped reduce poverty: UN report". The Hindu.
Retrieved 16 August 2017.
^ "Poverty headcount ratio at $5.50 a day (2011 PPP) (% of population)". World Bank.
^ Jump up to: a b c d e T. Roy, London School of Economics, Globalization, Factor Prices and Poverty
in Colonial India, Australian Economic History Review, Vol. 47, No. 1, pp. 73–94 (March 2007)
^ Jump up to: a b c Maddison, Angus. (1970), The historical origins of Indian poverty, PSL Quarterly
Review, 23(92), pp. 31–81.
^ Jump up to: a b Murton, Brian (2000), "VI.4: Famine", The Cambridge World History of Food 2,
Cambridge, New York, pp. 1411–27
^ Jump up to: a b A Sen (1983), Poverty and Famines: An Essay on Entitlement and Deprivation,
Oxford University Press, ISBN 978-0198284635
^ Beitler, Maddie (26 September 2020). "Colonial India: A Legacy of Neglect". ArcGIS StoryMaps.
Retrieved 17 March 2022. It is important to note that there has not been a major famine in India
since it gained its independence in 1947.
^ Jump up to: a b Bhagwati & Panagariya (2013), Why Growth Matters: How Economic Growth in
India Reduced Poverty and the Lessons for Other Developing Countries, Public Affairs, ISBN 978-
1610393737
^ Jump up to: a b Swaminathan S. Anklesaria Aiyar, The Elephant That Became a Tiger: 20 Years of
Economic Reform in India Cato Institute (20 July 2011). Retrieved 16 August 2017.
^ John Burn-Murdoch and Steve Bernard, The Fragile Middle: millions face poverty as emerging
economies slow, The Financial Times (13 April 2014). Retrieved 16 August 2017.
^ Sepoy, Inzamul (2019). Indian Economic Development. p. 84.
^ "30% of India is poor, says Rangarajan panel's new poverty line formula". First Post. 7 July 2014.
Retrieved 21 October 2017.
^ "The middle class in India" (PDF). Deutsche Bank Research. 15 February 2010. Retrieved 16 August
2017.
^ "Report for Selected Countries and Subjects". Retrieved 16 August 2017.
^ "India – Data". Retrieved 16 August 2017.
^ "India's Poverty Rate Falls To 12.4%, Electricity Plays Big Role". 10 October 2015. Retrieved 16
August 2017.
^ Biswas, Soutik (15 November 2017). "Is India's middle class actually poor?". BBC News.
^ Poverty in India. Asian Development Bank. Retrieved 16 August 2017.
^ "A number 1 position India is happy to lose". The Times of India.
^ "Income inequality gets worse; India's top 1% bag 73% of the country's wealth, says Oxfam".
Business Today. 22 January 2018.
^ Erenstein (2011), Livelihood Assets as a Multidimensional Inverse Proxy for Poverty: A District‐level
Analysis of the Indian Indo‐Gangetic Plains, Journal of Human Development and Capabilities, 12(2),
pp. 283–302.
^ Anant Vijay Kala (25 July 2013). "How to read India's poverty stats?". The Wall Street Journal.
Retrieved 16 August 2017.
^ Krishna & Shariff (2011), The irrelevance of national strategies? Rural poverty dynamics in states
and regions of India, 1993–2005. World Development, 39(4), pp. 533–549.
^ Chandy, L., & Gertz, G. (2011), Poverty in numbers: The changing state of global poverty from 2005
to 2015, Brookings Institution
^ THE DEFINITIONS OF POVERTY The World Bank (2009).
^ Jump up to: a b c d Donnan, Shawn (9 May 2014). "World Bank eyes biggest global poverty line
increase in decades". Financial Times.
^ "India is home to world's largest poor population". Hindustan Times. 5 October 2015.
^ "India is no longer home to the largest number of poor people in the world. Nigeria is". Retrieved 5
February 2019.
^ "World Poverty Clock". Retrieved 5 February 2019.
^ Gordon Fisher, The Development and the history of poverty thresholds Social Security Bulletin, Vol
55, No 4 (Winter 1992), US Government. Retrieved 16 August 2017.
^ Panagariya & Mukim (2014), A comprehensive analysis of poverty in India. Asian Development
Review, 31(1), pp. 1–52.
^ Jump up to: a b "Not poor if you earn Rs.32 a day: Planning Commission". India Today. 21
September 2011. Retrieved 16 August 2017.
^ Chen and Ravallion, China is Poorer than we Thought, But No Less Successful in the Fight against
Poverty Policy Research Working Paper 4621, The World Bank (2008), page 9.
^ Chen & Ravallion (2013), More Relatively‐Poor People in a Less Absolutely‐Poor World, Review of
Income, Wealth, 59(1), pp. 1–28.
^ Alkire & Sumner (2013), Multidimensional Poverty and the Post-2015 MDGs, Development, 56(1),
pp. 46–51.
^ Paul, S. (1989), A model of constructing the poverty line, Journal of Development Economics, 30(1),
pp. 129–144
^ Sumner (2004), Economic Well-being and Non-economic Well-being, A Review of the Meaning and
Measurement of Poverty, ISBN 92-9190-617-4
^ Appleton (2001), 'The Rich Are Just Like Us, Only Richer': Poverty Functions or Consumption
Functions?, Journal of African Economies, 10(4), pp. 433–469.
^ "La línea de la pobreza subió a $ 14.811 y la de indigencia a $ 6.045" [The poverty line rose to $
14,811 and the poverty line to $ 6,045]. El Economista (in Spanish). 25 July 2017. Retrieved 31
December 2017.
^ China issues white paper on poverty reduction China (16 November 2011)
^ Federal Republic of Nigeria – Study for Poverty Profile (Africa) JICA Japan (March 2011) Retrieved
16 August 2017.
^ the official poverty line in the United States varies with number of people in a household, $13 per
day is per person in a family of four
^ Martin Ravallion (January 2010). "World Bank's $1.25/day poverty measure- countering the latest
criticisms". Research at the World Bank. The World Bank. Archived from the original on 10 December
2014. ... the official poverty line used in the United States is $13 a day in 2005 (per person, for a
family of four).
^ Jump up to: a b 2014 Poverty Guidelines US Department of Health and Human Services (2014)
^ Food Security and Poverty in Asia and the Pacific Asian Development Bank (April 2012), ISBN 978-
92-9092-666-5, pp. 9–11.
^ REPORT OF THE EXPERT GROUP TO REVIEW THE METHODOLOGY FOR ESTIMATION OF POVERTY
Archived 4 September 2011 at the Wayback Machine Govt of India (2009), pp. 11–27.
^ Gordon Fisher, The Development and the history of poverty thresholds Social Security Bulletin, Vol
55, No 4 (Winter 1992), US Government, pp. 9.
^ Smeeding et al., POVERTY, INEQUALTTY, AND FAMILY LIVING STANDARDS IMPACTS ACROSS SEVEN
NATIONS: THE EFFECT OF NONCASH SUBSIDIES FOR HEALTH, EDUCATION AND HOUSING Review of
Income and Wealth, Series 39, Number 3. September 1993, pp. 229–256.
^ Raymond Zhong (27 July 2014). "New Poverty Formula Proves Test for India". The Wall Street
Journal. Retrieved 16 August 2017.
^ Press Note on Poverty Estimates, 2011–12 Government of India, p. 5.
^ Sarkar (1983), The colonial economy, In: S. Sarkar (Editor) Modern India: 1885–1947, Macmillan,
ISBN 978-0333904251
^ Thorner (1962), 'Deindustrialization' in India, 1881–1931, In: D. Thorner, and A. Thorner (Editors),
Land and Labour in India, ISBN 978-8180280214
^ Jump up to: a b c Richard Hunt (1997), To End Poverty – The Starvation of the Periphery by the
Core, Oxford, UK, ISBN 978-0952887201, pp. 145–148.
^ These were variously called or were parts of United Provinces, Northwestern Provinces, Oudh,
Behar, Bengal and Rewa in 19th century South Asia
^ Kranton and Swamy, Contracts, Hold-Up, and Exports: Textiles and Opium in Colonial India,
American Economic Review, 98(3): 967–989.
^ Allen (1853), The opium trade: a sketch of its history, extent, effects as carried on in India and
China at Google Books, J.P. Walker
^ Jump up to: a b The Parliamentary Debates, Volume 348, p. 1058, at Google Books, Hansard's, HM
Government, Great Britain (14 August 1890), pp. 1054–1061.
^ Singh (2002), Population And Poverty, Mittal, ISBN 978-81-7099-848-8
^ Reddy (1986), Trends in agricultural wages in some south Indian districts: 1800–1980, Indian
Journal of Labour Economics, 28, pp. 307–349
^ Raychaudhuri (1982), Non-agricultural production: Mughal India, In: T. Raychaudhuri, and I. Habib,
(Editors), The Cambridge Economic History of India, Cambridge University Press.
^ Jump up to: a b M.H. Suryanarayana. "Nutritional Norms for Poverty: Issues and Implications"
(PDF). Indira Gandhi Institute of Development Research. Retrieved 16 August 2017.
^ Richard Peet; Michael Watts, eds. (2004). Liberation Ecologies: Environment, Development and
Social Movements. London: Routledge. pp. 44–49. ISBN 978-0415312363.
^ Davis, Mike (2001). Late Victorian Holocausts: El Niño Famines and the Making of the Third World.
Verso. p. 7. ISBN 978-1859847398.
^ Romesh Dutt (1901), Indian Famines, Their Causes and Prevention, London
^ Jump up to: a b c B.S. Minhas, Rural Poverty, Land Redistribution and Development Strategy: Facts
and Policy, Indian Economic Review New Series, Vol. 5, No. 1 (APRIL 1970), pp. 97–128
^ B.S. Minhas (1974), Planning and the Poor at Google Books, Chand, pp. 71–76.
^ Jump up to: a b Gary S. Fields, Poverty, Inequality, and Development at Google Books, ISBN 978-
0521298520, pp. 204–210
^ "Poverty Puzzle". The Statesman. 22 November 2013. Archived from the original on 15 July 2014.
^ Arvind Singhal (28 August 2008). "A market at the bottom of the pyramid?" (PDF). Retrieved 16
August 2017.
^ Joshi, P. D. (Department of Statistics, Ministry of Planning and Programme Implementation, India).
"Conceptualisation, Measurement and Dimensional Aspects of Poverty in India, by P. D. Joshi,
Department of Statistics, Ministry of Planning and Programme Implementation, India" (PDF).
Seminar on Poverty Statistics Santiago 7–9 May 1997. United Nations Statistical Commission Expert
Group on Poverty Statistics. Retrieved 16 August 2017.
^ P. Sarangi, Consumption, Poverty And Inequality, ISBN 978-8183562645, pp. 188–200
^ "Poverty in India". Economic and Political Weekly. 6 (2). 9 January 1971. Retrieved 16 August 2017.
^ "Proceedings of the workshop on forests for poverty reduction: changing role for research,
development and training institutions". Fao.org. Retrieved 16 August 2017.
^ "Report of The Expert Group on Estimation of Proportion and Number of Poor" (PDF). Perspective
Planning Division, Planning Commission. Retrieved 16 August 2017.
^ Banerjee & Somanathan (2007), The political economy of public goods: Some evidence from India,
Journal of development Economics, 82(2), pp. 287–314
^ Chen, S., G. Datt, and M. Ravallion (1994), Is poverty increasing in the developing world?, Review
of Income and Wealth, 40 (4): 359–376.
^ Jump up to: a b Datt (1998), Poverty in India and Indian states: An update, IFPRI, Washington D.C..
Retrieved 16 August 2017.
^ Jump up to: a b Acharya, Arun Kumar; Naranjo, Diego López (2019), "Practices of Bonded Labour in
India: Forms of Exploitation and Human Rights Violations", The SAGE Handbook of Human Trafficking
and Modern Day Slavery, SAGE Publications Ltd, pp. 126–138, doi:10.4135/9781526436146.n6,
ISBN 9781473978553, S2CID 169418671, retrieved 3 May 2020
^ "Report of the Expert Group to Recommend the Detailed Methodology for Identification of
Families Living Below Poverty Line in the Urban Areas" (PDF). Planning Commission. Retrieved 16
August 2017.
^ "Report on Condition of Work and Promotion of Livelihoods in the unorganised sector" (PDF).
Archived from the original (PDF) on 30 March 2016. Retrieved 16 August 2017.
^ "Calorie intake criterion puts 50 per cent Indians below poverty line". The Hindu. Chennai, India. 19
September 2009. Retrieved 16 August 2017.
^ Arvind Singhal (28 August 2008). "Arvind Singhal: A market at the bottom of the pyramid?" (PDF).
Retrieved 16 August 2017.
^ "Expert Group on Methodology for Estimation of Poverty". Planning Commission. Retrieved 21
October 2017.
^ "Poverty Estimates for 2009–10". Press Information Bureau, Government of India. Retrieved 21
October 2017.
^ "Rangarajan Report on Poverty". Press Information Bureau, Government of India. Retrieved 21
October 2017.
^ "Rangarajan defends poverty estimates". The Hindu. 7 July 2014. Retrieved 21 October 2017.
^ "Three out of ten in India are poor, says Rangarajan panel report". India Today. Retrieved 21
October 2017.
^ "Resource Watch". resourcewatch.org. Retrieved 17 March 2022.
^ "Country Briefing: India" (PDF). Oxford Poverty and Human Development Initiative. 2010.
Retrieved 14 June 2011.
^ Jump up to: a b "India's poverty will fall from 51% to 22% by 2015: UN report". The Times of India.
PTI. 8 July 2011. Retrieved 16 August 2017.
^ Vibhuti Agarwal (5 February 2015). "India Hits Its U.N. Poverty-Cutting Target, but Misses Others".
Retrieved 16 August 2017 – via Wall Street Journal.
^ "Global Wealth Report 2016". Credit Suisse Research Institute. Archived from the original on 23
November 2016. Retrieved 16 August 2017.
^ "India second most unequal country in the world: Wealth Report". Hindustan Times. 24 November
2016. Retrieved 16 August 2017.
^ "2011 Global Hunger Index Report" (PDF). International Food Policy Research Institute (IFPRI).
pp. 12, 49.
^ Sayantan Bera (13 October 2014). "India betters its rank in Global Hunger Index". Mint. Retrieved
16 August 2017.
^ Jump up to: a b c "Working Paper No. 2013-02.Poverty by Social, Religious & EconomicGroups in
India and Its Largest States1993-94 to 2011–12 (Pages 6–7)" (PDF). Archived from the original (PDF)
on 9 March 2014.
^ Social, Economic, and Educational Status of the Muslim Community in India Retrieved 16 August
2017.
^ Rajat Kanta Ray, "Indian Society and the Establishment of British Supremacy, 1765–1818," in The
Oxford History of British Empire: vol. 2, The Eighteenth Century ed. by P. J. Marshall, (1998), pp 508–
29.
^ "Inclusive Growth and Service delivery: Building on India's Success" (PDF). World Bank. 2006.
Retrieved 16 August 2017.
^ Luis Flores Ballesteros (28 September 2010). "How lack or poor infrastructure shapes inequality
and poverty in supernations. A lesson from India" 54 Pesos Sep. 2010:54 Pesos 28 Sep 2010".
54pesos.org. Archived from the original on 3 October 2011. Retrieved 16 October 2011.
^ "AP stands 1st in India in GSDP growth rate". The Times of India. TNN. 12 June 2016. Retrieved 16
August 2017.
^ Borooah, Vani K.; Diwakar, Dilip; Mishra, Vinod Kumar; Naik, Ajaya Kumar; Sabharwal, Nidhi S.
(2014). "Caste, inequality, and poverty in India: a reassessment". Development Studies Research. 1
(1): 279–294. doi:10.1080/21665095.2014.967877.
^ Roli Mahajan (20 October 2018). "Good progress with further room for improvement". D+C,
development and cooperation. Retrieved 5 February 2019.
^ Jayati Ghosh (4 October 2011). "India's official poverty line". The Guardian. London. Retrieved 16
August 2017.
^ "Households Availing Banking Services with Households in India" (PDF). Town and Country
Planning Organisation, Ministry of Urban Affairs. 2001. Retrieved 31 July 2009.[dead link]
^ "Department of Telecom, memo Feb 2013". Department of Telecommunication of India.
2013.[dead link]
^ Manas Chakravarty (13 October 2014). "The World Bank on India's poverty". Retrieved 16 August
2017.
^ "India's Urban Poverty Agenda: Understanding the Poor in Cities and Formulating Appropriate
Anti-Poverty Actions" (PDF). Goa, India. 9–21 January 2000. Archived from the original (PDF) on 5
July 2014. Retrieved 22 May 2014.
^ Ravallion & Datt (2002), Why has economic growth been more pro-poor in some states of India
than others?, Journal of development economics, 68(2), 381–400
^ Suman, Santosh Kumar. "Relevance of MGNREGA in India" (PDF). AEBM. Krishi Sanskriti
Publications. 3 (7): 781–783. Retrieved 17 March 2022.
^ Klonner and Oldiges, Employment Guarantee and its Welfare E§ects in India University of
Heidelberg, (September 2012)
^ Klonner and Oldiges, Safety Net for India's Poor or Waste of Public Funds? Poverty and Welfare in
the Wake of the World's Largest Job Guarantee Program University of Heidelberg, Germany (May
2014)
^ Ashwani Mahajan (12 November 2013). "Depriving the poor". Deccan Herald. Retrieved 16 August
2017.
^ "World Poverty Clock". Retrieved 17 March 2022.
Further reading
Breman, Jan; et al. (2019). "Chapter 6: A Mirage of Welfare: How the Social Question in India Got
Aborted". The Social Question in the Twenty-First Century: A Global View. Oakland, California:
University of California Press. doi:10.1525/luminos.74.g. ISBN 978-0520302402. S2CID 230116593.
"Poverty in India". World Bank.
"Can India eradicate poverty? Will India's economic boom help the poor?". Archived from the
original on 5 March 2016.
Deaton, A.; Kozel, V. (11 August 2005). "Data and Dogma: The Great Indian Poverty Debate" (PDF).
The World Bank Research Observer. 20 (2): 177–199. doi:10.1093/wbro/lki009. ISSN 0257-3032.
"World Hunger – India". 11 February 2009. Archived from the original on 11 February 2009.
George, Abraham. "Why the Fight Against Poverty is Failing: A Contrarian View". Wharton Business
School Publications.
Rohr, Mathieu von (9 August 2007). "Poverty and riches in booming India". Der Spiegel.
External links
Media related to Poverty in India at Wikimedia Commons
"Poverty in India 2".
Tendulkar, Suresh. "Expert Group on Methodology for Estimation of Poverty".
"From poverty to empowerment: India's imperative for jobs, growth, and effective basic services".
McKinsey Global Institute. 2013.
Perspectives on Poverty in India (PDF). The World Bank. 2013. ISBN 978-0-8213-8689-7.
"Chapter 4: DEFINING AND EXPLAINING INCLUSIVE GROWTH AND POVERTY". INDIA (PDF).
International Monetary Fund. 2014.
show
v
t
e
Economy of India
Companies
BSE SENSEX
NIFTY 50
Government-owned companies
List of companies
Governance
Ministry of Finance
Finance ministers
Ministry of Commerce and Industry
Finance Commission
Economic Advisory Council
Central Statistical Office
Securities and Exchange Board of India
Enforcement Directorate
External debt
Foreign trade
Foreign direct investment
Foreign exchange reserves
Remittances
Taxation
Subsidies
Industrial licensing
Voluntary guidelines
NITI Aayog
Make in India
Atmanirbhar Bharat
Currency
Indian rupee
Sign
History
Historical Forex
Coinage
Paisa
Reserve Bank of India
Governor
Mint
Inflation
Financial services
Banking
Banks
Insurance
Multi Commodity Exchange
Bullion
Black money
Stock exchanges
Bombay
National
History
COVID-19 impact
Economic development
Liberalisation
Privatisation
Globalisation
Licence Raj
Green revolution
Government initiatives
Numbering system
People
Billionaires
Demography
Income
Poverty
Labour law
Pensions
EPFO
NPS
PPF
States
Andhra Pradesh
Assam
Bihar
Delhi
Goa
Gujarat
Haryana
Himachal Pradesh
Jammu and Kashmir
Jharkhand
Karnataka
Kerala
Ladakh
Madhya Pradesh
Maharashtra
Mizoram
Odisha
Punjab
Rajasthan
Tamil Nadu
Telangana
Uttarakhand
Uttar Pradesh
West Bengal
Sectors
Agriculture
Livestock
Fishing
Automotive
Chemical
Construction
Defence
Education
Energy
Electricity
Nuclear
Oil and gas
Solar
Wind
Electronics and semiconductor
Entertainment
Forestry
Gambling
Healthcare
Information technology
Media
Cinema
FM Radio
Television
Printing
Mining
Coal
Iron and Steel
Pharmaceuticals
Pulp and paper
Retail
Science and technology
Biotechnology
Telecommunications
Textiles
Tourism
Transport
Aviation
Civil
Ports
Rail
Roads
Utilities
Electricity
Water
Power
Regulator IRDAI
RBI
SEBI
IBBI
Other
NCLT
NCLAT
BIFR
IBBI
IBC
SARFESI Act
Income Tax Act
Companies Act
Banking Act
Insurance Act
FEMA
Category
Commons
Wikiquotes
show
v
t
e
Social issues in India
Economy
Communications
Famine
Farmers' suicides
Labour
Land reforms
Debt bondage
National Pension System
Poverty
BPL
Public distribution system
Remittances
Slums
Clearance
Standard of living
Street vendors
Transport
Urbanisation
Unemployment
Widening income gap
Education
Literacy
Ragging
Environment
Conservation
Climate change
Manual scavenging
Natural disasters
Water supply and sanitation
Water disputes
Family
Cohabitation
Domestic violence
Dowry system
Family planning
Joint family
Infertility
Nuclear family
Polyandry
Polygamy
Children
Abortion
Child labour
Child marriage
Child prostitution
Child trafficking
Female foeticide
Female infanticide
Street children
Women
Acid attack
Bride burning
Devadasi
Dowry death
Eve teasing
Women's health
Feminism
Menstrual taboo
Prostitution
Rape
Sati
Sexism
Caste system
Caste politics
Caste-related violence
Dalit
Reservation
Communalism
Proposed states and territories
Ethnic relations
Religious violence
Secularism
Separatist movements
Crime
Corruption
Groom kidnapping
Human trafficking
Illegal housing
Illegal immigration
Illegal mining
Organised crime
Terrorism
Vigilantism
Cybercrime
Health
Diabetes
Epidemics
HIV/AIDS
Leprosy
Malnutrition
Obesity
Suicide
Tuberculosis
Media
Censorship
Internet
Films about social issues
Freedom of expression
Social impact of Indian television drama
Fake news
Other issues
Colourism
Feudalism
Gambling
Sexuality
LGBT
Homosexuality
Hijra
Human rights
Prohibition
Superstitions
show
v
t
e
India topics
show
History
Overviews
Timeline
Years
Astronomy
Clothing
Coinage
Economics
LGBT
Linguistics
Maritime
Mathematics
Metallurgy
Military
Postal
Science and technology
Ancient
Stone Age
Indus Valley civilization
Vedic period
Mahajanapadas
Mauryas
Yavana Kingdom
Achaemenid conquest of the Indus Valley
Indo-Parthian Kingdom
Kushan Empire
Alchon Huns
Seleucid–Mauryan war
Middle Kingdoms
Middle kingdoms
Chola
Middle Ages
Medieval India
Hoysala
Pala
Kakatiya
Delhi Sultanate
Vijayanagara
Early Modern
Mughals
Marathas
European trade
Bengal War
Late modern
Colonial
Princely state
East India Company
Plassey
1857 rebellion
British Raj
Railways
Economy
Army
Commander-in-Chief
Zamindari
Bengali Renaissance
Political reforms
Partition of Bengal
Independence movement
1943 famine
World War II
Partition
Republic
Integration
Non-Aligned Movement
Five-Year Plans
Sino-Indian War
Indo-Pakistani wars
Green Revolution
White Revolution
Naxal Insurgency
Smiling Buddha
Space programme
The Emergency
Indian Peace Keeping Force (IPKF)
Contemporary
History of India (1947–present)
Economic liberalisation
Pokhran-II
COVID-19 pandemic
show
Geography
Environment Biosphere reserves
Climate
Climate change
Earthquakes
Ecoregions
Environmental issues
Fauna
Flora
Geology
National parks
Protected areas
Wildlife
sanctuaries
Landforms
Beaches
Desert
Extreme points
Glaciers
Islands
Lakes
Mountains
Plains
Indo-Gangetic
Eastern coastal
Western coastal
Rivers
Valleys
Volcanoes
Waterfalls
Regions
East
North
Northeast
South
West
Subdivisions
Autonomous administrative divisions
Borders
Towns
Cities
Districts
Municipalities
States and union territories
show
Politics
Government
Agencies
Energy policy
Foreign relations
Parliament
Lok Sabha
Rajya Sabha
President
Vice President
Prime Minister
Union Council of Ministers
Civil Services
Cabinet Secretary
State governments
State legislatures
State legislative assemblies
State legislative councils
Governors, Lieutenant Governors and Administrators
Chief Ministers
Chief Secretaries
Law
Constitution
Penal Code
Fundamental rights, principles and duties
Human rights
Supreme Court
Chief Justice
High Courts
District Courts
Enforcement Federal
Border Security Force (BSF)
Central Industrial Security Force (CISF)
Central Reserve Police Force (CRPF)
Indo-Tibetan Border Police (ITBP)
National Security Guard (NSG)
Railway Protection Force (RPF)
Sashastra Seema Bal (SSB)
Special Protection Group (SPG)
Intelligence
Bureau of Police Research and Development (BPR&D)
Central Bureau of Investigation (CBI)
Directorate of Revenue Intelligence (DRI)
Enforcement Directorate (ED)
Intelligence Bureau (IB)
Joint Intelligence Committee (JIC)
Narcotics Control Bureau (NCB)
National Investigation Agency (NIA)
Research and Analysis Wing (R&AW)
Military
Army
Navy
Air Force
Politics
Censorship
Elections
Nationalism
Political parties
Reservations
Scandals
Scheduled groups
Secularism
Women in politics
show
Economy
Companies BSE SENSEX
NIFTY 50
Government-owned companies
List of companies
Governance
Ministry of Finance
Finance ministers
Ministry of Commerce and Industry
Finance Commission
Planning Commission
Economic Advisory Council
Central Statistical Office
Securities and Exchange Board of India
Enforcement Directorate
Foreign trade
Remittances
Taxation
Subsidies
Industrial licensing
Voluntary guidelines
NITI Aayog
Make in India
FDI in India
Currency
Indian rupee
History
Historical exchange rates data of the Indian rupee
Coinage
Reserve Bank of India
Governors
India Government Mint
Financial services
Banking
Banks
Insurance
Foreign exchange reserves
Bombay Stock Exchange
National Stock Exchange
Multi Commodity Exchange
Bullion
Black money
History
Economic Development
Economic liberalisation
Licence Raj
Green revolution
Government initiatives
Numbering system
People
Billionaires
Businesspeople
Demography
Income
Poverty
Labour law
Pensions
EPFO
NPS
PPF
States
Andhra Pradesh
Assam
Bihar
Goa
Gujarat
Haryana
Himachal Pradesh
Jammu and Kashmir
Karnataka
Kerala
Madhya Pradesh
Maharashtra
Manipur
Mizoram
Nagaland
Odisha
Punjab
Rajasthan
Tamil Nadu
Telangana
Uttarakhand
Uttar Pradesh
West Bengal
Sectors
Agriculture
Livestock
Fishing
Automotive
Defence
Construction
Education
Energy
Nuclear
Solar
Wind
Entertainment
Forestry
Gambling
Healthcare
Information technology
Media
Cinema
Television
Printing
Mining
Pharmaceuticals
Retail
Science and technology
Biotechnology
Telecommunications
Textiles
Tourism
Transport
Aviation
Civil
Ports
Rail
Utilities
Electricity
Water
show
Society and culture
Society
Caste system
Corruption
Demographics
Indians
Women
Education
Universities in India
Medical colleges in India
Law colleges in India
Engineering colleges in India
Ethnic relations
Healthcare
Hospitals in India
Languages
Literacy
Poverty
Prisons
Religion
Socio-economic issues
Standard of living
Water supply and sanitation
Sexuality
Crime
Culture
Arts and entertainment
Architecture
Blogging
Cinema
Comics
Webcomics
Cuisine
wine
Dance
Dress
Folklore
Festivals
Literature
Media
television
Martial arts
Music
Painting
Public holidays
Sculpture
tallest
Sport
show
v
t
e
Poverty
Other aspects
Measuring poverty
Diseases of poverty
Cycle of poverty
Poverty reduction
Sustainable Development Goals
Metrics
Homeless Vulnerability Index
Misery index (economics)
Gini coefficient
Genuine progress indicator
Legatum Prosperity Index
Poverty gap index
Human Poverty Index
Multidimensional Poverty Index
Scottish Index of Multiple Deprivation
By Location Africa
Algeria
Democratic Republic of the Congo
Egypt
Ethiopia
Kenya
Namibia
Niger
Nigeria
South Africa
Tanzania
Uganda
Zimbabwe
Asia
Afghanistan
Armenia
Bangladesh
Cambodia
China
Cyprus
East Timor
India
Israel
Japan
Lebanon
North Korea
South Korea
Malaysia
Nepal
Pakistan
Philippines
Singapore
Sri Lanka
Vietnam
Yemen
Europe
Cyprus
France
Germany
Greece
Italy
Moldova
Norway
Poland
Romania
Switzerland
Turkey
Ukraine
United Kingdom
Oceania
Australia
New Zealand
The Americas
Argentina
Bolivia
Brazil
Colombia
Cuba
Guatemala
Haiti
Honduras
Jamaica
Mexico
Paraguay
Peru
United States
Uruguay
Venezuela
Other
Theories of poverty
Well-being
Welfare
Wellness
Quality of life
Self-perceived quality-of-life scale
Subjective well-being (SWB)
Suboptimal health
Stress
Rural access issues
Providing Urban Amenities to Rural Areas
Post-materialism
Pen's parade
show
v
t
e
Diseases of poverty
Diseases of poverty
AIDS
Malaria
Tuberculosis
Measles
Pneumonia
Diarrheal diseases
Plague
Neglected diseases
Cholera
Chagas disease
African sleeping sickness
Schistosomiasis
Dracunculiasis
River blindness
Leishmaniasis
Trachoma
Miscellaneous
Malnutrition
Priority review voucher
See also
List of countries by percentage of population living in poverty · Deprivation and poverty indicators
show
v
t
e
Poverty in Asia
Sovereign states
Afghanistan
Armenia
Azerbaijan
Bahrain
Bangladesh
Bhutan
Brunei
Cambodia
China
Cyprus
East Timor (Timor-Leste)
Egypt
Georgia
India
Indonesia
Iran
Iraq
Israel
Japan
Jordan
Kazakhstan
North Korea
South Korea
Kuwait
Kyrgyzstan
Laos
Lebanon
Malaysia
Maldives
Mongolia
Myanmar
Nepal
Oman
Pakistan
Philippines
Qatar
Russia
Saudi Arabia
Singapore
Sri Lanka
Syria
Tajikistan
Thailand
Turkey
Turkmenistan
United Arab Emirates
Uzbekistan
Vietnam
Yemen
States with
limited recognition
Abkhazia
Artsakh
Northern Cyprus
Palestine
South Ossetia
Taiwan
Dependencies and
other territories
British Indian Ocean Territory
Christmas Island
Cocos (Keeling) Islands
Hong Kong
Macau
Category
Asia portal
<img src="//en.wikipedia.org/wiki/Special:CentralAutoLogin/start?type=1x1" alt="" title=""
width="1" height="1" style="border: none; position: absolute;" />
Retrieved from "https://en.wikipedia.org/w/index.php?title=Poverty_in_India&oldid=1118525461"
Categories:
Poverty in India
Hidden categories:
CS1 Spanish-language sources (es)
Webarchive template wayback links
All articles with dead external links
Articles with dead external links from August 2017
Wikipedia indefinitely semi-protected pages
Use Indian English from May 2019
All Wikipedia articles written in Indian English
Use dmy dates from October 2016
Articles with short description
Short description matches Wikidata
Commons category link from Wikidata
AC with 0 elements
Navigation menu
Personal tools
Not logged in
Talk
Contributions
Create account
Log in
Namespaces
Article
Talk
English
Views
Read
View source
View history
More
Search
Top of Form
Search Go
Bottom of Form
Navigation
Main page
Contents
Current events
Random article
About Wikipedia
Contact us
Donate
Contribute
Help
Learn to edit
Community portal
Recent changes
Upload file
Tools
What links here
Related changes
Upload file
Special pages
Permanent link
Page information
Cite this page
Wikidata item
Print/export
Download as PDF
Printable version
In other projects
Wikimedia Commons
Wikiquote
Languages
भभभभभभभ
‫سی‬ ‫ار‬ ‫ف‬
हहहहहह
‫עברית‬
हहहहह
हहहहहह
हहहहहह
‫ی‬ ‫نجاب‬ ‫پ‬
Simple English
हहहहह
3 more
Edit links
This page was last edited on 27 October 2022, at 13:38 (UTC).
Text is available under the Creative Commons Attribution-ShareAlike License 3.0; additional terms
may apply. By using this site, you agree to the Terms of Use and Privacy Policy. Wikipedia® is a
registered trademark of the Wikimedia Foundation, Inc., a non-profit organization.
Privacy policy
About Wikipedia
Disclaimers
Contact Wikipedia
Mobile view
Developers
Statistics
Cookie statement
Edit preview settings

More Related Content

Similar to Poverty in India.docx

indian economy
indian economyindian economy
indian economytahaamir4
 
Mec-105 2015-16 Free Ignou Assignment
Mec-105 2015-16 Free Ignou AssignmentMec-105 2015-16 Free Ignou Assignment
Mec-105 2015-16 Free Ignou AssignmentRahul Singh
 
IRJET- Analysis of Suitability of Poverty Line Measures using Nutritional...
IRJET-  	  Analysis of Suitability of Poverty Line Measures using Nutritional...IRJET-  	  Analysis of Suitability of Poverty Line Measures using Nutritional...
IRJET- Analysis of Suitability of Poverty Line Measures using Nutritional...IRJET Journal
 
Bulletin of Indonesian Economic Studies, Vol. 50, No. 2, 2014.docx
Bulletin of Indonesian Economic Studies, Vol. 50, No. 2, 2014.docxBulletin of Indonesian Economic Studies, Vol. 50, No. 2, 2014.docx
Bulletin of Indonesian Economic Studies, Vol. 50, No. 2, 2014.docxcurwenmichaela
 
india's population as an asset or liability
india's population as an asset or liabilityindia's population as an asset or liability
india's population as an asset or liabilityyashaswini sharma
 
term paper rohan
term paper rohanterm paper rohan
term paper rohanRohan Nath
 
India’s wealth and poverty levelsThis study will focus on the ec.docx
India’s wealth and poverty levelsThis study will focus on the ec.docxIndia’s wealth and poverty levelsThis study will focus on the ec.docx
India’s wealth and poverty levelsThis study will focus on the ec.docxdirkrplav
 
Social Sector & Econimic Reforms
Social Sector & Econimic ReformsSocial Sector & Econimic Reforms
Social Sector & Econimic ReformsAshutosh Kumar Jha
 
Social science project work
Social science project workSocial science project work
Social science project workAditya Chowdhary
 
Decline of Indian Fertility Rates is Accelerating.docx
Decline of Indian Fertility Rates is Accelerating.docxDecline of Indian Fertility Rates is Accelerating.docx
Decline of Indian Fertility Rates is Accelerating.docxChampSalcenaPerez
 
pre submission seminar for 12-12-23.pptx
pre submission seminar for 12-12-23.pptxpre submission seminar for 12-12-23.pptx
pre submission seminar for 12-12-23.pptxshafiqulislam85068
 
BRICS COUNTRIESppt.pptx
BRICS COUNTRIESppt.pptxBRICS COUNTRIESppt.pptx
BRICS COUNTRIESppt.pptxUmar655059
 

Similar to Poverty in India.docx (20)

indian economy
indian economyindian economy
indian economy
 
Mec-105 2015-16 Free Ignou Assignment
Mec-105 2015-16 Free Ignou AssignmentMec-105 2015-16 Free Ignou Assignment
Mec-105 2015-16 Free Ignou Assignment
 
Poverty as a challenge
Poverty as a challengePoverty as a challenge
Poverty as a challenge
 
IRJET- Analysis of Suitability of Poverty Line Measures using Nutritional...
IRJET-  	  Analysis of Suitability of Poverty Line Measures using Nutritional...IRJET-  	  Analysis of Suitability of Poverty Line Measures using Nutritional...
IRJET- Analysis of Suitability of Poverty Line Measures using Nutritional...
 
Indian Economy Essay
Indian Economy EssayIndian Economy Essay
Indian Economy Essay
 
Examination of the Impact of National Economic Empowerment and Development St...
Examination of the Impact of National Economic Empowerment and Development St...Examination of the Impact of National Economic Empowerment and Development St...
Examination of the Impact of National Economic Empowerment and Development St...
 
Bulletin of Indonesian Economic Studies, Vol. 50, No. 2, 2014.docx
Bulletin of Indonesian Economic Studies, Vol. 50, No. 2, 2014.docxBulletin of Indonesian Economic Studies, Vol. 50, No. 2, 2014.docx
Bulletin of Indonesian Economic Studies, Vol. 50, No. 2, 2014.docx
 
india's population as an asset or liability
india's population as an asset or liabilityindia's population as an asset or liability
india's population as an asset or liability
 
UNSDG.pptx
UNSDG.pptxUNSDG.pptx
UNSDG.pptx
 
term paper rohan
term paper rohanterm paper rohan
term paper rohan
 
India’s wealth and poverty levelsThis study will focus on the ec.docx
India’s wealth and poverty levelsThis study will focus on the ec.docxIndia’s wealth and poverty levelsThis study will focus on the ec.docx
India’s wealth and poverty levelsThis study will focus on the ec.docx
 
Poverty in india
Poverty in indiaPoverty in india
Poverty in india
 
Empirical Appraisal of Poverty-Unemployment Relationship in Nigeria
Empirical Appraisal of Poverty-Unemployment Relationship in NigeriaEmpirical Appraisal of Poverty-Unemployment Relationship in Nigeria
Empirical Appraisal of Poverty-Unemployment Relationship in Nigeria
 
Social Sector & Econimic Reforms
Social Sector & Econimic ReformsSocial Sector & Econimic Reforms
Social Sector & Econimic Reforms
 
Poverty as a Challenge-YT.pdf
Poverty as a Challenge-YT.pdfPoverty as a Challenge-YT.pdf
Poverty as a Challenge-YT.pdf
 
Developing Rural Finance In India
Developing Rural Finance In IndiaDeveloping Rural Finance In India
Developing Rural Finance In India
 
Social science project work
Social science project workSocial science project work
Social science project work
 
Decline of Indian Fertility Rates is Accelerating.docx
Decline of Indian Fertility Rates is Accelerating.docxDecline of Indian Fertility Rates is Accelerating.docx
Decline of Indian Fertility Rates is Accelerating.docx
 
pre submission seminar for 12-12-23.pptx
pre submission seminar for 12-12-23.pptxpre submission seminar for 12-12-23.pptx
pre submission seminar for 12-12-23.pptx
 
BRICS COUNTRIESppt.pptx
BRICS COUNTRIESppt.pptxBRICS COUNTRIESppt.pptx
BRICS COUNTRIESppt.pptx
 

More from G.V.M.GIRLS COLLEGE SONEPAT

मेरी फसल मेरा ब्यौरा 2022.docx
मेरी फसल मेरा ब्यौरा 2022.docxमेरी फसल मेरा ब्यौरा 2022.docx
मेरी फसल मेरा ब्यौरा 2022.docxG.V.M.GIRLS COLLEGE SONEPAT
 
4-2-measuring-development-hdi-country-comparisons-activity.docx
4-2-measuring-development-hdi-country-comparisons-activity.docx4-2-measuring-development-hdi-country-comparisons-activity.docx
4-2-measuring-development-hdi-country-comparisons-activity.docxG.V.M.GIRLS COLLEGE SONEPAT
 
The current social and economic structure in India means that.docx
The current social and economic structure in India means that.docxThe current social and economic structure in India means that.docx
The current social and economic structure in India means that.docxG.V.M.GIRLS COLLEGE SONEPAT
 
NATIONAL POLICY FOR THE EMPOWERMENT OF WOMEN.docx
NATIONAL POLICY FOR THE EMPOWERMENT OF WOMEN.docxNATIONAL POLICY FOR THE EMPOWERMENT OF WOMEN.docx
NATIONAL POLICY FOR THE EMPOWERMENT OF WOMEN.docxG.V.M.GIRLS COLLEGE SONEPAT
 

More from G.V.M.GIRLS COLLEGE SONEPAT (20)

मेरी फसल मेरा ब्यौरा 2022.docx
मेरी फसल मेरा ब्यौरा 2022.docxमेरी फसल मेरा ब्यौरा 2022.docx
मेरी फसल मेरा ब्यौरा 2022.docx
 
PM Kisan Registration 2023(1).pdf
PM Kisan Registration 2023(1).pdfPM Kisan Registration 2023(1).pdf
PM Kisan Registration 2023(1).pdf
 
PM Antyodaya Anna Yojana.docx
PM Antyodaya Anna Yojana.docxPM Antyodaya Anna Yojana.docx
PM Antyodaya Anna Yojana.docx
 
PM Antyodaya Anna Yojana.docx
PM Antyodaya Anna Yojana.docxPM Antyodaya Anna Yojana.docx
PM Antyodaya Anna Yojana.docx
 
HARYANA ECONOMIC SURVEY ANALYSIS..docx
HARYANA ECONOMIC SURVEY ANALYSIS..docxHARYANA ECONOMIC SURVEY ANALYSIS..docx
HARYANA ECONOMIC SURVEY ANALYSIS..docx
 
HARYANA ECONOMIC SURVEY ANALYSIS..docx
HARYANA ECONOMIC SURVEY ANALYSIS..docxHARYANA ECONOMIC SURVEY ANALYSIS..docx
HARYANA ECONOMIC SURVEY ANALYSIS..docx
 
PM Modi pension Yojana.pdf
PM Modi  pension Yojana.pdfPM Modi  pension Yojana.pdf
PM Modi pension Yojana.pdf
 
PM Modi Yojana.docx
PM Modi Yojana.docxPM Modi Yojana.docx
PM Modi Yojana.docx
 
4-2-measuring-development-hdi-country-comparisons-activity.docx
4-2-measuring-development-hdi-country-comparisons-activity.docx4-2-measuring-development-hdi-country-comparisons-activity.docx
4-2-measuring-development-hdi-country-comparisons-activity.docx
 
ENVIRONMENT.docx
ENVIRONMENT.docxENVIRONMENT.docx
ENVIRONMENT.docx
 
TERMINOLOGY OF GEOGRAPHY.docx
TERMINOLOGY OF GEOGRAPHY.docxTERMINOLOGY OF GEOGRAPHY.docx
TERMINOLOGY OF GEOGRAPHY.docx
 
TERMINOLOGY OF GEOGRAPHY.docx
TERMINOLOGY OF GEOGRAPHY.docxTERMINOLOGY OF GEOGRAPHY.docx
TERMINOLOGY OF GEOGRAPHY.docx
 
terms of geography.docx
terms of geography.docxterms of geography.docx
terms of geography.docx
 
Urban Cities and Disaster Management.docx
Urban Cities and Disaster Management.docxUrban Cities and Disaster Management.docx
Urban Cities and Disaster Management.docx
 
What is an Earthquake.docx
What is an Earthquake.docxWhat is an Earthquake.docx
What is an Earthquake.docx
 
Urban Cities and Disaster Management.docx
Urban Cities and Disaster Management.docxUrban Cities and Disaster Management.docx
Urban Cities and Disaster Management.docx
 
CLIMATE CHANGE IN THE WORLD.
CLIMATE CHANGE IN THE WORLD.CLIMATE CHANGE IN THE WORLD.
CLIMATE CHANGE IN THE WORLD.
 
The current social and economic structure in India means that.docx
The current social and economic structure in India means that.docxThe current social and economic structure in India means that.docx
The current social and economic structure in India means that.docx
 
List of Women Empowerment Schemes in India.docx
List of Women Empowerment Schemes in India.docxList of Women Empowerment Schemes in India.docx
List of Women Empowerment Schemes in India.docx
 
NATIONAL POLICY FOR THE EMPOWERMENT OF WOMEN.docx
NATIONAL POLICY FOR THE EMPOWERMENT OF WOMEN.docxNATIONAL POLICY FOR THE EMPOWERMENT OF WOMEN.docx
NATIONAL POLICY FOR THE EMPOWERMENT OF WOMEN.docx
 

Recently uploaded

(TANVI) Call Girls Nanded City ( 7001035870 ) HI-Fi Pune Escorts Service
(TANVI) Call Girls Nanded City ( 7001035870 ) HI-Fi Pune Escorts Service(TANVI) Call Girls Nanded City ( 7001035870 ) HI-Fi Pune Escorts Service
(TANVI) Call Girls Nanded City ( 7001035870 ) HI-Fi Pune Escorts Serviceranjana rawat
 
Quarter 4- Module 3 Principles of Marketing
Quarter 4- Module 3 Principles of MarketingQuarter 4- Module 3 Principles of Marketing
Quarter 4- Module 3 Principles of MarketingMaristelaRamos12
 
Independent Lucknow Call Girls 8923113531WhatsApp Lucknow Call Girls make you...
Independent Lucknow Call Girls 8923113531WhatsApp Lucknow Call Girls make you...Independent Lucknow Call Girls 8923113531WhatsApp Lucknow Call Girls make you...
Independent Lucknow Call Girls 8923113531WhatsApp Lucknow Call Girls make you...makika9823
 
OAT_RI_Ep19 WeighingTheRisks_Apr24_TheYellowMetal.pptx
OAT_RI_Ep19 WeighingTheRisks_Apr24_TheYellowMetal.pptxOAT_RI_Ep19 WeighingTheRisks_Apr24_TheYellowMetal.pptx
OAT_RI_Ep19 WeighingTheRisks_Apr24_TheYellowMetal.pptxhiddenlevers
 
20240417-Calibre-April-2024-Investor-Presentation.pdf
20240417-Calibre-April-2024-Investor-Presentation.pdf20240417-Calibre-April-2024-Investor-Presentation.pdf
20240417-Calibre-April-2024-Investor-Presentation.pdfAdnet Communications
 
Vip B Aizawl Call Girls #9907093804 Contact Number Escorts Service Aizawl
Vip B Aizawl Call Girls #9907093804 Contact Number Escorts Service AizawlVip B Aizawl Call Girls #9907093804 Contact Number Escorts Service Aizawl
Vip B Aizawl Call Girls #9907093804 Contact Number Escorts Service Aizawlmakika9823
 
VIP Call Girls Thane Sia 8617697112 Independent Escort Service Thane
VIP Call Girls Thane Sia 8617697112 Independent Escort Service ThaneVIP Call Girls Thane Sia 8617697112 Independent Escort Service Thane
VIP Call Girls Thane Sia 8617697112 Independent Escort Service ThaneCall girls in Ahmedabad High profile
 
VIP Call Girls LB Nagar ( Hyderabad ) Phone 8250192130 | ₹5k To 25k With Room...
VIP Call Girls LB Nagar ( Hyderabad ) Phone 8250192130 | ₹5k To 25k With Room...VIP Call Girls LB Nagar ( Hyderabad ) Phone 8250192130 | ₹5k To 25k With Room...
VIP Call Girls LB Nagar ( Hyderabad ) Phone 8250192130 | ₹5k To 25k With Room...Suhani Kapoor
 
High Class Call Girls Nashik Maya 7001305949 Independent Escort Service Nashik
High Class Call Girls Nashik Maya 7001305949 Independent Escort Service NashikHigh Class Call Girls Nashik Maya 7001305949 Independent Escort Service Nashik
High Class Call Girls Nashik Maya 7001305949 Independent Escort Service NashikCall Girls in Nagpur High Profile
 
Andheri Call Girls In 9825968104 Mumbai Hot Models
Andheri Call Girls In 9825968104 Mumbai Hot ModelsAndheri Call Girls In 9825968104 Mumbai Hot Models
Andheri Call Girls In 9825968104 Mumbai Hot Modelshematsharma006
 
Call Girls Service Nagpur Maya Call 7001035870 Meet With Nagpur Escorts
Call Girls Service Nagpur Maya Call 7001035870 Meet With Nagpur EscortsCall Girls Service Nagpur Maya Call 7001035870 Meet With Nagpur Escorts
Call Girls Service Nagpur Maya Call 7001035870 Meet With Nagpur Escortsranjana rawat
 
New dynamic economic model with a digital footprint | European Business Review
New dynamic economic model with a digital footprint | European Business ReviewNew dynamic economic model with a digital footprint | European Business Review
New dynamic economic model with a digital footprint | European Business ReviewAntonis Zairis
 
Stock Market Brief Deck for 4/24/24 .pdf
Stock Market Brief Deck for 4/24/24 .pdfStock Market Brief Deck for 4/24/24 .pdf
Stock Market Brief Deck for 4/24/24 .pdfMichael Silva
 
High Class Call Girls Nagpur Grishma Call 7001035870 Meet With Nagpur Escorts
High Class Call Girls Nagpur Grishma Call 7001035870 Meet With Nagpur EscortsHigh Class Call Girls Nagpur Grishma Call 7001035870 Meet With Nagpur Escorts
High Class Call Girls Nagpur Grishma Call 7001035870 Meet With Nagpur Escortsranjana rawat
 
Call Girls In Yusuf Sarai Women Seeking Men 9654467111
Call Girls In Yusuf Sarai Women Seeking Men 9654467111Call Girls In Yusuf Sarai Women Seeking Men 9654467111
Call Girls In Yusuf Sarai Women Seeking Men 9654467111Sapana Sha
 
Best VIP Call Girls Noida Sector 18 Call Me: 8448380779
Best VIP Call Girls Noida Sector 18 Call Me: 8448380779Best VIP Call Girls Noida Sector 18 Call Me: 8448380779
Best VIP Call Girls Noida Sector 18 Call Me: 8448380779Delhi Call girls
 
Log your LOA pain with Pension Lab's brilliant campaign
Log your LOA pain with Pension Lab's brilliant campaignLog your LOA pain with Pension Lab's brilliant campaign
Log your LOA pain with Pension Lab's brilliant campaignHenry Tapper
 
VIP Kolkata Call Girl Serampore 👉 8250192130 Available With Room
VIP Kolkata Call Girl Serampore 👉 8250192130  Available With RoomVIP Kolkata Call Girl Serampore 👉 8250192130  Available With Room
VIP Kolkata Call Girl Serampore 👉 8250192130 Available With Roomdivyansh0kumar0
 

Recently uploaded (20)

(TANVI) Call Girls Nanded City ( 7001035870 ) HI-Fi Pune Escorts Service
(TANVI) Call Girls Nanded City ( 7001035870 ) HI-Fi Pune Escorts Service(TANVI) Call Girls Nanded City ( 7001035870 ) HI-Fi Pune Escorts Service
(TANVI) Call Girls Nanded City ( 7001035870 ) HI-Fi Pune Escorts Service
 
Commercial Bank Economic Capsule - April 2024
Commercial Bank Economic Capsule - April 2024Commercial Bank Economic Capsule - April 2024
Commercial Bank Economic Capsule - April 2024
 
Quarter 4- Module 3 Principles of Marketing
Quarter 4- Module 3 Principles of MarketingQuarter 4- Module 3 Principles of Marketing
Quarter 4- Module 3 Principles of Marketing
 
Independent Lucknow Call Girls 8923113531WhatsApp Lucknow Call Girls make you...
Independent Lucknow Call Girls 8923113531WhatsApp Lucknow Call Girls make you...Independent Lucknow Call Girls 8923113531WhatsApp Lucknow Call Girls make you...
Independent Lucknow Call Girls 8923113531WhatsApp Lucknow Call Girls make you...
 
OAT_RI_Ep19 WeighingTheRisks_Apr24_TheYellowMetal.pptx
OAT_RI_Ep19 WeighingTheRisks_Apr24_TheYellowMetal.pptxOAT_RI_Ep19 WeighingTheRisks_Apr24_TheYellowMetal.pptx
OAT_RI_Ep19 WeighingTheRisks_Apr24_TheYellowMetal.pptx
 
20240417-Calibre-April-2024-Investor-Presentation.pdf
20240417-Calibre-April-2024-Investor-Presentation.pdf20240417-Calibre-April-2024-Investor-Presentation.pdf
20240417-Calibre-April-2024-Investor-Presentation.pdf
 
Vip B Aizawl Call Girls #9907093804 Contact Number Escorts Service Aizawl
Vip B Aizawl Call Girls #9907093804 Contact Number Escorts Service AizawlVip B Aizawl Call Girls #9907093804 Contact Number Escorts Service Aizawl
Vip B Aizawl Call Girls #9907093804 Contact Number Escorts Service Aizawl
 
VIP Call Girls Thane Sia 8617697112 Independent Escort Service Thane
VIP Call Girls Thane Sia 8617697112 Independent Escort Service ThaneVIP Call Girls Thane Sia 8617697112 Independent Escort Service Thane
VIP Call Girls Thane Sia 8617697112 Independent Escort Service Thane
 
VIP Call Girls LB Nagar ( Hyderabad ) Phone 8250192130 | ₹5k To 25k With Room...
VIP Call Girls LB Nagar ( Hyderabad ) Phone 8250192130 | ₹5k To 25k With Room...VIP Call Girls LB Nagar ( Hyderabad ) Phone 8250192130 | ₹5k To 25k With Room...
VIP Call Girls LB Nagar ( Hyderabad ) Phone 8250192130 | ₹5k To 25k With Room...
 
High Class Call Girls Nashik Maya 7001305949 Independent Escort Service Nashik
High Class Call Girls Nashik Maya 7001305949 Independent Escort Service NashikHigh Class Call Girls Nashik Maya 7001305949 Independent Escort Service Nashik
High Class Call Girls Nashik Maya 7001305949 Independent Escort Service Nashik
 
Andheri Call Girls In 9825968104 Mumbai Hot Models
Andheri Call Girls In 9825968104 Mumbai Hot ModelsAndheri Call Girls In 9825968104 Mumbai Hot Models
Andheri Call Girls In 9825968104 Mumbai Hot Models
 
Call Girls Service Nagpur Maya Call 7001035870 Meet With Nagpur Escorts
Call Girls Service Nagpur Maya Call 7001035870 Meet With Nagpur EscortsCall Girls Service Nagpur Maya Call 7001035870 Meet With Nagpur Escorts
Call Girls Service Nagpur Maya Call 7001035870 Meet With Nagpur Escorts
 
New dynamic economic model with a digital footprint | European Business Review
New dynamic economic model with a digital footprint | European Business ReviewNew dynamic economic model with a digital footprint | European Business Review
New dynamic economic model with a digital footprint | European Business Review
 
Stock Market Brief Deck for 4/24/24 .pdf
Stock Market Brief Deck for 4/24/24 .pdfStock Market Brief Deck for 4/24/24 .pdf
Stock Market Brief Deck for 4/24/24 .pdf
 
High Class Call Girls Nagpur Grishma Call 7001035870 Meet With Nagpur Escorts
High Class Call Girls Nagpur Grishma Call 7001035870 Meet With Nagpur EscortsHigh Class Call Girls Nagpur Grishma Call 7001035870 Meet With Nagpur Escorts
High Class Call Girls Nagpur Grishma Call 7001035870 Meet With Nagpur Escorts
 
Call Girls In Yusuf Sarai Women Seeking Men 9654467111
Call Girls In Yusuf Sarai Women Seeking Men 9654467111Call Girls In Yusuf Sarai Women Seeking Men 9654467111
Call Girls In Yusuf Sarai Women Seeking Men 9654467111
 
Best VIP Call Girls Noida Sector 18 Call Me: 8448380779
Best VIP Call Girls Noida Sector 18 Call Me: 8448380779Best VIP Call Girls Noida Sector 18 Call Me: 8448380779
Best VIP Call Girls Noida Sector 18 Call Me: 8448380779
 
🔝+919953056974 🔝young Delhi Escort service Pusa Road
🔝+919953056974 🔝young Delhi Escort service Pusa Road🔝+919953056974 🔝young Delhi Escort service Pusa Road
🔝+919953056974 🔝young Delhi Escort service Pusa Road
 
Log your LOA pain with Pension Lab's brilliant campaign
Log your LOA pain with Pension Lab's brilliant campaignLog your LOA pain with Pension Lab's brilliant campaign
Log your LOA pain with Pension Lab's brilliant campaign
 
VIP Kolkata Call Girl Serampore 👉 8250192130 Available With Room
VIP Kolkata Call Girl Serampore 👉 8250192130  Available With RoomVIP Kolkata Call Girl Serampore 👉 8250192130  Available With Room
VIP Kolkata Call Girl Serampore 👉 8250192130 Available With Room
 

Poverty in India.docx

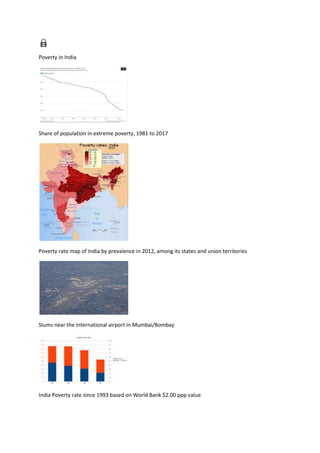
  • 1. Poverty in India Share of population in extreme poverty, 1981 to 2017 Poverty rate map of India by prevalence in 2012, among its states and union territories Slums near the international airport in Mumbai/Bombay India Poverty rate since 1993 based on World Bank $2.00 ppp value
  • 2. India is a developing nation. Although its economy is growing, poverty is still a major challenge. However, poverty is on the decline in India. According to an International Monetary Fund paper, extreme poverty, defined by the World Bank as living on US$1.9 or less in purchasing power parity (PPP) terms, in India was as low as 0.8% in 2019 and the country managed to keep it at that level in 2020 despite the unprecedented COVID-19 outbreak. [1][2] According to World Bank, extreme poverty has reduced by 12.3% between 2011 and 2019 from 22.5% in 2011 to 10.2% in 2019. A working paper of the bank said rural poverty declined from 26.3% in 2011 to 11.6% in 2019. The decline in urban areas was from 14.2% to 6.3% in the same period.The poverty level in rural and urban areas went down by 14.7 and 7.9 percentage points, respectively.[3] According to United Nations Development Programme administrator Achim Steiner, India lifted 271 million people out of extreme poverty in a 10-year time period from 2005–2006 to 2015–2016. A 2020 study from the World Economic Forum found "Some 220 million Indians sustained on an expenditure level of less than Rs 32 / day—the poverty line for rural India—by the last headcount of the poor in India in 2013."[4] The World Bank has been revising its definition and benchmarks to measure poverty since 1990– 1991, with a $0.2 per day income on purchasing power parity basis as the definition in use from 2005 to 2013.[5] Some semi-economic and non-economic indices have also been proposed to measure poverty in India. For example, in order to determine whether a person is poor, the Multi- dimensional Poverty Index places a 13% weight on the number of years that person spent in school or engaged in education and a 6.25% weight on the financial condition of that person.[6] The different definitions and underlying small sample surveys used to determine poverty in India have resulted in widely varying estimates of poverty from the 1950s to 2010s. In 2019, the Indian government stated that 6.7% of its population is below its official poverty limit.[7] Based on 2019's PPPs International Comparison Program,[8][9] According to the United Nations Millennium Development Goals (MDG) programme, 80 million people out of 1.2 billion Indians, roughly equal to 6.7% of India's population, lived below the poverty line of $1.25 [10] and 84% of Indians lived on less than $6.85 per day in 2019.[11] From the late 19th century through the early 20th century, under the British Raj, poverty in India intensified, peaking in the 1920s.[12][13] Famines and diseases killed millions in multiple vicious cycles throughout the 19th and early 20th centuries.[14][15] After India gained its independence in 1947, mass deaths from famines were prevented.[16] Since 1991, rapid economic growth has led to a sharp reduction in extreme poverty in India.[17][18] However, those above the poverty line live a fragile economic life.[19] As per the methodology of the Suresh Tendulkar Committee report, the population below the poverty line in India was 354 million (29.6% of the population) in 2009–2010 and was 69 million (21.9% of the population) in 2011–2012.[20] In 2014, the Rangarajan Committee said that the population below the poverty line was 454 million (38.2% of the population) in 2009– 2010 and was 363 million (29.5% of the population) in 2011–2012.[21] Deutsche Bank Research estimated that there are nearly 300 million people who are in the middle class.[22] If these previous trends continue, India's share of world GDP will significantly increase from 7.3% in 2016 to 8.5% by 2020.[23] In 2012, around 170 million people, or 12.4% of India's population, lived in poverty (defined as $1.90 (Rs 123.5)), an improvement from 29.8% of India's population in 2009.[24][25] In their paper, economists Sandhya Krishnan and Neeraj Hatekar conclude that 600 million people, or more than half of India's population, belong to the middle class.[26]
  • 3. The Asian Development Bank estimates India's population to be at 1.28 billion with an average growth rate of 1.3% from 2010 to 2015. In 2014, 9.9% of the population aged 15 years and above were employed. 6.9% of the population still lives below the national poverty line and 63% in extreme poverty (December 2018)[27] The World Poverty Clock shows real-time poverty trends in India, which are based on the latest data, of the World Bank, among others. As per recent estimates, the country is well on its way of ending extreme poverty by meeting its sustainable development goals by 2030.[28] According to Oxfam, India's top 1% of the population now holds 73% of the wealth, while 670 million citizens, comprising the country's poorest half, saw their wealth rise by just 1%.[29] Contents 1 Definition of poverty 2 Poverty prevalence and estimates 2.1 After Independence 2.1.1 1950s 2.1.2 1960s 2.1.3 1970s – 1980s 2.1.4 1990s 2.1.5 2000s 2.1.6 Reserve Bank of India (2012) 2.1.7 2010s 2.1.8 Semi-economic measures of poverty 3 Other estimates 4 Economic impact of British imperialism 5 Reduction in poverty 6 See also 7 References 8 Further reading 9 External links Definition of poverty
  • 4. Poverty is the state of not having enough material possessions or income for a person basic need. Poverty may include social, economic, and political elements. Absolute poverty is the complete lack of the means necessary to meet basic personal needs, such as food, clothing, and shelter. Economic measures There are several definitions of poverty, and scholars disagree as to which definition is appropriate for India.[30][31] Inside India, both income-based poverty definition and consumption-based poverty statistics are in use.[32] Outside India, the World Bank and institutions of the United Nations use a broader definition to compare poverty among nations, including India, based on purchasing power parity (PPP), as well as nominal relative basis.[33][34] Each state in India has its own poverty threshold to determine how many people are below its poverty line and to reflect regional economic conditions. These differences in definitions yield a complex and conflicting picture about poverty in India, both internally and when compared to other developing countries of the world.[35] According to the World Bank, India accounted for the world's largest number of poor people in 2012 using revised methodology to measure poverty, reflecting its massive population. However, in terms of percentage, it scored somewhat lower than other countries holding large poor populations.[36] In July 2018, World Poverty Clock, a Vienna-based think tank, reported that a minimal 5.3% or 70.6 million Indians lived in extreme poverty compared to 44% or 87 million Nigerians. In 2019, Nigeria and Congo surpassed India in terms of total population earning below $1.9 a day.[37][38] Although India is expected to meet the United Nations' Sustainable Development Goals on extreme poverty in due time, a very large share of its population lives on less than $3.2 a day, putting India's economy safely into the category of lower middle income economies. As with many countries,[39] poverty was historically defined and estimated in India using a sustenance food standard. This methodology has been revised. India's current official poverty rates are based on its Planning Commission's data derived from so-called Tendulkar methodology.[40] It defines poverty not in terms of annual income, but in terms of consumption or spending per individual over a certain period for a basket of essential goods. Furthermore, this methodology sets different poverty lines for rural and urban areas. Since 2007, India has set its official threshold at ₹ 26 a day ($0.43) in rural areas and about ₹ 32 per day ($0.53) in urban areas.[41] While these numbers are lower than the World Bank's $1.25 per day income-based definition, the definition is similar to China's US$0.65 per day official poverty line in 2008.[42] The World Bank's international poverty line definition is based on purchasing power parity basis, at $1.25 per day.[43][44] This definition is motivated by the fact that the price of the same goods and services can differ significantly when converted into local currencies around the world. A realistic definition and comparison of poverty must consider these differences in costs of living, or must be on purchasing power parity (PPP) basis. On this basis, currency fluctuations and nominal numbers become less important, the definition is based on the local costs of a basket of essential goods and services that people can purchase. By World Bank's 2014 PPP definition, India's poverty rate is significantly lower than previously believed.[35] Mixed, semi-economic and non-economic measures
  • 5. As with economic measures, there are many mixed or non-economic measures of poverty and experts contest which one is most appropriate for India. For example, Dandekar and Rath in 1971 suggested a measure of poverty rate that was based on number of calories consumed.[45] In 2011, Alkire et al. suggested a poverty rate measure so-called Multi-dimensional Poverty Index (MPI), which only puts a 6.25% weight to assets owned by a person and places 33% weight on education and number of years spent in school.[6] These non-economic measures remain controversial and contested as a measure of poverty rate of any nation, including India.[46][47] National poverty lines comparison (Note: this is historical data, not current) Country Poverty line (per day) Year Reference India 32 rupees ($0.5) 2017 [41] Argentina 481 pesos ($11.81) 2017 [48] China 6.3 yuan ($1) 2011 [49] Nigeria 65 naira ($0.4) 2011 [50] United States $14[51] 2005 [52][53] Comparison with alternate international definitions India determines its household poverty line by summing up the individual per capita poverty lines of the household members. This practice is similar to many developing countries, but different from developed countries such as the United States who adjusts their poverty line on an incremental basis per additional household member. For example, in the United States, the poverty line for a household with just one member was set at $11,670 per year for 2014, while it was set at $23,850 per year for a 4-member household (or $5963 per person for the larger household).[53] The rationale for the differences arise from the economic realities of each country. In India, households may include surviving grandparents, parents, and children. They typically do not incur any or significant rent expenses every month particularly in rural India, unlike housing in mostly urban developed economies. The cost of food and other essentials are shared within the household by its members in both cases. However, a larger portion of a monthly expenditure goes to food in poor households in developing countries,[54] while housing, conveyance, and other essentials cost significantly more in developed economies. For its current poverty rate measurements, India calculates two benchmarks. The first includes a basket of goods, including food items but excluding the implied value of home, value of any means of conveyance or the economic value of other essentials created, grown or used without a financial transaction, by the members of a household. The second poverty line benchmark adds rent value of residence as well as the cost of conveyance, but nothing else, to the first benchmark.[55] This practice is similar to those used in developed countries for non-cash income equivalents and a poverty line basis.[56][57]
  • 6. India's proposed but not yet adopted official poverty line, in 2014, was ₹972 (US$12) a month in rural areas or ₹1,407 (US$18) a month in cities. The current poverty line is 1,059.42 Indian Rupees (62 PPP USD) per month in rural areas and 1,286 Indian rupees (75 PPP USD) per month in urban areas.[58] India's nationwide average poverty line differs from each state's poverty line. For example, in 2011–2012, Puducherry had its highest poverty line of ₹1,301 (US$16) a month in rural and ₹1,309 (US$16) a month in urban areas, while Odisha had the lowest poverty thresholds of ₹695 (US$8.70) a month for rural and ₹861 (US$11) a month for its urban areas.[59] Poverty prevalence and estimates The 19th century and early 20th century saw increasing poverty in India during the colonial era.[12][60] Over this period, the colonial government de-industrialized India by reducing garments and other finished products manufactured by artisans in India. Instead, they imported these products from Britain's expanding industry due to the many industrial innovations of the 19th century. Additionally, the government simultaneously encouraged the conversion of more land into farms and more agricultural exports from India.[61][62] Eastern regions of India along the Ganges river plains, such as those now known as eastern Uttar Pradesh, Bihar, Jharkhand and West Bengal,[63] were dedicated to producing poppy and opium. These items were then exported to southeast and east Asia, particularly China. The East India Company initially held an exclusive monopoly over these exports, and the colonial British institutions later did so as well.[64] The economic importance of this shift from industry to agriculture in India was large;[65] by 1850, it created nearly 1,000 square kilometres of poppy farms India's fertile Ganges plains. This consequently led to two opium wars in Asia, with the second opium war fought between 1856 and 1860. After China agreed to be a part of the opium trade, the colonial government dedicated more land exclusively to poppy.[62] The opium agriculture in India rose from 1850 through 1900, when over 500,000 acres of the most fertile Ganges basin farms were devoted to poppy cultivation.[66] Additionally, opium processing factories owned by colonial officials were expanded in Benares and Patna, and shipping expanded from Bengal to the ports of East Asia such as Hong Kong, all under exclusive monopoly of the British. By the early 20th century, 3 out of 4 Indians were employed in agriculture, famines were common, and food consumption per capita declined in every decade.[13] In London, the late 19th century British parliament debated the repeated incidence of famines in India, and the impoverishment of Indians due to this diversion of agriculture land from growing food staples to growing poppy for opium export under orders of the colonial British empire.[62][66]
  • 7. Poverty was intense during colonial era India. Numerous famines and epidemics killed millions of people each.[14][67] Upper image is from 1876 to 1879 famine in South of British India that starved and killed over 6 million people, while lower image is of child who starved to death during the Bengal famine of 1943. These colonial policies moved unemployed artisans into farming, and transformed India into a region increasingly abundant in land, unskilled labour, and low productivity. This consequently made India scarce in skilled labour, capital and knowledge.[12][13] On an inflation adjusted 1973 rupee basis, the average income of an Indian agrarian labourer was Rs. 7.20 per year in 1885, against an inflation adjusted poverty line of Rs. 23.90 per year. Thus, not only was the average income below the poverty line, but the intensity of poverty was also severe. The intensity of poverty increased from 1885 to 1921, before being reversed. However, the absolute poverty rates continued to be very high through the 1930s.[12][68] The colonial policies on taxation and its recognition of land ownership claims of zamindars and mansabdars, or Mughal era nobility, made a minority of families wealthy. Additionally, these policies weakened the ability of poorer peasants to command land and credit. The resulting rising landlessness and stagnant real wages intensified poverty.[12][69] The National Planning Committee of 1936 noted the appalling poverty of undivided India.[70] (...) there was lack of food, of clothing, of housing and of every other essential requirement of human existence... the development policy objective should be to get rid of the appalling poverty of the people. — Nehru, The Discovery of India, (1946) The National Planning Committee, notes Suryanarayana, then defined goals in 1936 to alleviate poverty by setting targets in terms of nutrition (2400 to 2800 calories per adult worker), clothing (30 yards per capita per annum) and housing (100 sq. ft per capita).[70] This method of linking poverty as a function of nutrition, clothing and housing continued in India after it became independent from British colonial empire. These poverty alleviation goals were theoretical, with administrative powers resident in the British Empire. Poverty ravaged India. In 1943, for example, despite rising agricultural output in undivided South Asia, the Bengal famine killed millions of Indians from starvation, disease and destitution. Destitution was so intense in Bengal, Bihar, eastern Uttar Pradesh, Jharkhand and Orissa, that entire families and villages were "wiped out" of existence. Village artisans, along with sustenance farming families, died from lack of food, malnutrition and a wave of diseases.[15] The 1943 famine was not an isolated tragedy. Devastating famines impoverished India every 5 to 8 years in the late 19th
  • 8. century and the first half of the 20th century. Between 6.1 and 10.3 million people starved to death in British India during the 1876–1879 famine, while another 6.1 to 8.4 million people died during the 1896–1898 famine.[71] The Lancet reported that 19 million people died from starvation and the consequences of extreme poverty in British India between 1896 and 1900.[72] Sir MacDonnell observed the suffering and poverty in 1900, and noted, "people died like flies" in Bombay.[73] After Independence 1950s Year[74] Total Population (millions) 50%lived on (₹ / year) 95% lived on (₹ / year) 1956–57 359 180 443 1961–62 445 204 498 1967–68 514 222 512 Minhas published his estimates of poverty rates in 1950s India as cyclical and a strong function of each year's harvest. Minhas disagreed with the practice of using calories as the basis for poverty estimation and proposed a poverty line based on real expenditure per year (Rs 240 per annum). In 1956–57, a good harvest year, he computed India's poverty rate to be 65% (215 million people).[74][75] For 1960, Minhas estimated the poverty to be 59%.[76] 1960s A Working Group was formed in 1962 to attempt to set a poverty line for India.[77][78] This Working Group used calories required for survival, and income needed to buy those calories in different parts of rural India, to derive an average poverty line of Rs. 20 per month at 1960–61 prices.[79] Estimates of poverty in India during the 1960s varied widely. Dandekar and Rath, on the behalf of then Indian government, estimated that the poverty rate in 1960s remained generally constant at 41%. Ojha, in contrast, estimated that there were 190 million people (44%) in India below official poverty limit in 1961, and that this below-poverty line number increased to 289 million people (70%) in 1967. Bardhan also concluded that Indian poverty rates increased through the 1960s, reaching a high of 54%.[76][80] Those above the 1960s poverty level of Rs 240 per year, were in fragile economic groups as well and not doing well either. Minhas estimated that 95% of India's people lived on Rs 458 per year in 1963–64, while the richest 5% lived on an average of Rs 645 per year (all numbers inflation adjusted to 1960–61 Rupee).[74] 1970s – 1980s Dandekar and Rath[81] in 1971 used a daily intake of 2,250 calories per person to define the poverty line for India. Using NSSO data regarding household expenditures for 1960–61, they determined that in order to achieve this food intake and other daily necessities, a rural dweller required an annual income of ₹ 170.80 per year (₹ 14.20 per month, adjusted to 1971 Rupee). An urban dweller
  • 9. required ₹ 271.70 per year (₹ 22.60 per month). They concluded from this study that 40 percent of rural residents and 50 percent of urban residents were below the poverty line in 1960–61.[82] Poverty alleviation has been a driver for India's Planning Commission's Task Force on Projections of Minimum Needs and Effective Consumption Demand of the Perspective Planning Division. This division, in 1979, took into account differences in calorie requirements for different age groups, activity levels, and sex. They determined that the average rural dweller needed around 2400 calories, and those in urban areas required about 2100 calories per person per day. To satisfy the food requirement, the Task Force estimated that a consumer spending in 1973–74 of Rs.49.09 per person per month in rural areas and Rs.56.64 in urban areas was appropriate measure to estimate its poverty line.[83] Poverty remained stubbornly high in India through the 1970s and 1980s. It created slogans such as Garibi Hatao (meaning eliminate poverty) for political campaigns, during elections in early 1970s through the 1980s.[84] Rural poverty rate exceeded 50%, using India's official poverty line for 1970s.[85][86] Additionally, in 1976, the Indian government passed the Bonded Labor System Act in an effort to end debt bondage in India, a practice which contributes to generational poverty.[87] Nevertheless, this system is still in place today due to weak enforcement of this law.[87] 1990s Another Expert Group was instituted in 1993, chaired by Lakdawala, to examine poverty line for India. It recommended that regional economic differences are large enough that poverty lines should be calculated for each state. From then on, a standard list of commodities were drawn up and priced in each state of the nation, using 1973–74 as a base year. This basket of goods could then be re-priced each year and comparisons made between regions. The Government of India began using a modified version of this method of calculating the poverty line in India.[88] There are wide variations in India's poverty estimates for 1990s, in part from differences in the methodology and in the small sample surveys they poll for the underlying data. A 2007 report for example, using data for late 1990s, stated that 77% of Indians lived on less than ₹ 20 a day (about US$0.50 per day).[89] In contrast, S.G.Datt estimated India's national poverty rate to be 35% in 1994, at India's then official poverty line of Rs 49 per capita, with consumer price index adjusted to June 1974 rural prices.[86] 2000s The Saxena Committee report, using data from 1972 to 2000, separated calorific intake apart from nominal income in its economic analysis of poverty in India, and then stated that 50% of Indians lived below the poverty line.[90] The Planning Commission of India, in contrast, determined that the poverty rate was 39%. The National Council of Applied Economic Research estimated that 48% of the Indian households earn more than ₹90,000 (US$1,127.10) annually (or more than US$ 3 PPP per person). According to NCAER, in 2009, of the 222 million households in India, the absolutely poor households (annual incomes below ₹45,000 (US$560)) accounted for only 15.6% of them or about 35 million (about 200
  • 10. million Indians). Another 80 million households are in the income levels of ₹45,000 (US$560) to ₹90,000 (US$1,100) per year. These numbers are similar to World Bank estimates of the "below-the- poverty-line" households that may total about 100 million (or about 456 million individuals).[91] The Suresh Tendulkar Committee set up to look into the people living under the poverty line in India submitted its report in November 2009.[92] It provided a new method of calculating the poverty line based on per capita consumption expenditure per month or day. For rural areas, it was Rs 816 per month or Rs 27 per day. For urban areas, it was Rs 1000 per month or Rs 33 per day. Using this methodology, the population below the poverty line in 2009–2010 was 354 million (29.6% of the population) and that in 2011–2012 was 269 million (21.9% of the population).[93] Reserve Bank of India (2012) In its annual report of 2012, the Reserve Bank of India named the state of Goa as having the least poverty of 5.09% while the national average stood at 21.92%[7] The table below presents the poverty statistics for rural, urban and combined percentage below poverty line (BPL) for each State or Union Territory.[7] The highest poverty statistics for each category column is coloured light red and the lowest poverty statistics for each category column is coloured light Blue in the table below. hideState or Union Territory No. of Persons (Thousands ) Rural % of Person s (Rural) below povert y line Poverty line (Rs)/mont h (Rural) No. of Persons (Thousands ) Urban % of Person s (Urban ) below povert y line Poverty line (Rs)/mont h (Urban) No. of Persons (Thousands ) Combined % of Persons (Combined ) below poverty line Andhra Pradesh 6180 10.96 860.00 1698 5.81 1009.00 7878 9.20 Arunachal Pradesh 425 38.93 930.00 66 20.33 1060.00 491 34.67 Assam 9206 33.89 828.00 921 30.49 1008.00 10127 31.98 Bihar 32040 34.06 778.00 3775 31.23 923.00 35815 33.74 Chhattisgarh 8890 44.61 738.00 1522 24.75 849.00 10411 39.93 Goa 37 6.81 1090.00 38 4.09 1134.00 75 5.09 Gujarat 7535 21.50 932.00 2688 10.14 1152.00 10223 16.63 Haryana 1942 11.64 1015.00 941 10.28 1169.00 2883 11.16 Himachal 529 8.48 913.00 30 4.33 1064.00 559 8.06
  • 11. hideState or Union Territory No. of Persons (Thousands ) Rural % of Person s (Rural) below povert y line Poverty line (Rs)/mont h (Rural) No. of Persons (Thousands ) Urban % of Person s (Urban ) below povert y line Poverty line (Rs)/mont h (Urban) No. of Persons (Thousands ) Combined % of Persons (Combined ) below poverty line Pradesh Jammu & Kashmir 1073 11.54 891.00 253 7.20 988.00 1327 10.35 Jharkhand 10409 40.84 748.00 2024 24.83 974.00 12433 36.96 Karnataka 9280 24.53 902.00 3696 15.25 1089.00 12976 20.91 Kerala 1548 9.14 1018.00 846 4.97 987.00 2395 7.05 Madhya Pradesh 19095 35.74 771.00 4310 21.00 897.00 23406 31.65 Maharashtr a 15056 24.22 967.00 4736 9.12 1126.00 19792 17.35 Manipur 745 38.80 1118.00 278 32.59 1170.00 1022 36.89 Meghalaya 304 12.53 888.00 57 9.26 1154.00 361 11.87 Mizoram 191 35.43 1066.00 37 6.36 1155.00 227 20.40 Nagaland 276 19.93 1270.00 100 16.48 1302.00 376 18.88 Odisha 12614 35.69 695.00 1239 17.29 861.00 13853 32.59 Punjab 1335 7.66 1054.00 982 9.24 1155.00 2318 8.26 Rajasthan 8419 16.05 905.00 1873 10.69 1002.00 10292 14.72 Sikkim 45 9.85 930.00 6 3.66 1226.00 51 8.19 Tamil Nadu 5923 15.83 880.00 2340 6.54 937.00 8263 11.28 Tripura 449 16.53 798.00 75 7.42 920.00 524 14.05 Uttar 47935 30.40 768.00 11884 26.06 941.00 59819 29.43
  • 12. hideState or Union Territory No. of Persons (Thousands ) Rural % of Person s (Rural) below povert y line Poverty line (Rs)/mont h (Rural) No. of Persons (Thousands ) Urban % of Person s (Urban ) below povert y line Poverty line (Rs)/mont h (Urban) No. of Persons (Thousands ) Combined % of Persons (Combined ) below poverty line Pradesh Uttarakhand 825 11.62 880.00 335 10.48 1082.00 1160 11.26 West Bengal 14114 22.52 783.00 4383 14.66 981.00 18498 19.98 Andaman & Nicobar Islands 4 1.57 – 0 0.00 – 4 1.00 Chandigarh 0 0.00 – 234 22.31 – 235 21.81 Dadra & Nagar Haveli 115 62.59 – 28 15.38 – 143 39.31 Daman and Diu 0 0.00 – 26 12.62 – 26 9.86 Delhi 50 12.92 1145.00 1646 9.84 1134.00 1696 9.91 Lakshadwee p 0 0.00 – 2 3.44 – 2 2.77 Puducherry 69 17.06 1301.00 55 6.30 1309.00 124 9.69 India 216658 25.70 816.00 53125 13.70 1000.00 269783 21.92 2010s The World Bank has reviewed its poverty definition and calculation methodologies several times over the last 25 years. In early 1990s, The World Bank anchored absolute poverty line as $1 per day. This was revised in 1993, and the absolute poverty line was set at $1.08 a day for all countries on a purchasing power parity (PPP) basis, after adjusting for inflation to the 1993 US dollar. In 2005, after extensive studies of the cost of living across the world, The World Bank raised the measure for global poverty line to reflect the observed higher cost of living.[5] Thereafter, the World Bank determined poverty rates from those living on less than US$1.25 per day on 2005 PPP basis, a measure that has been widely used in media and scholarly circles.
  • 13. In May 2014, after revisiting its poverty definition, methodology and economic changes around the world, the World Bank proposed another major revision to PPP calculation methodology, international poverty line and indexing it to 2011 US dollar.[35] The new method proposes setting poverty line at $1.78 per day on 2011 PPP basis. According to this revised World Bank methodology, India had 179.6 million people below the new poverty line, China had 137.6 million, and the world had 872.3 million people below the new poverty line on an equivalent basis as of 2013. India, in other words, while having 17.5% of total world's population, had 20.6% share of world's poor.[9][35] In October 2015, the World Bank updated the international poverty line to US$1.90 a day. The Rangarajan Committee set up to look into the poverty line estimation in India submitted its report in June 2014.[94] It amended the calculation of the poverty line based on per capita consumption expenditure per month or day given by the Tendulkar Committee.[95] The new poverty threshold for rural areas was fixed at Rs 972 per month or Rs 32 per day. For urban areas, it was fixed at Rs 1407 per month or Rs 47 per day. Under this methodology, the population below the poverty line in 2009–2010 was 454 million (38.2% of the population) and that in 2011–2012 was 363 million (29.5% of the population).[96] From November 2017, the World Bank started reporting poverty rates for all countries using two new international poverty lines: a "lower middle-income" line set at $3.20 per day and an "upper middle-income" line set at $5.50 per day. These are in addition to the earlier poverty line of $1.90 per day. The new lines are supposed to serve two purposes. One, they account for the fact that achieving the same set of capabilities may need a different set of goods and services in different countries and, specifically, a costlier set in richer countries. Second, they allow for cross-country comparisons and benchmarking both within and across developing regions. India falls in the lower middle-income category. Using the $3.20 per day poverty line, the percentage of the population living in poverty in India (2011) was 60%. This means that 763 million people in India were living below this poverty line in 2011.[97] Semi-economic measures of poverty Other measures such as the semi-economic Multi-dimensional Poverty Index (MPI), which places 33% weight on education and number of schooling years in its definition of poverty, and places 6.25% weight on income and assets owned, suggests there were 650 million people (53.7% of population) living in MPI-poverty in India.[6] 421 million of MPI-defined poor are concentrated in eight North Indian and East Indian states of Bihar, Chhattisgarh, Jharkhand, Madhya Pradesh, Orissa, Rajasthan, Uttar Pradesh and West Bengal. The table below presents this semi-economic poverty among the states of India based on the Multi-dimensional Poverty Index, using a small sample survey data for Indian states in 2005.[98] showMPI rank States Population (in millions) 2007 MPI Proportion of MPI-poor Average intensity Contribution to overall MPI- poverty Number of MPI poor (in millions) — India 1,164.7 0.296 55.4% 53.5% – 645.0 1 Kerala 35.0 0.065 15.9% 40.9% 0.6% 5.6
  • 14. showMPI rank States Population (in millions) 2007 MPI Proportion of MPI-poor Average intensity Contribution to overall MPI- poverty Number of MPI poor (in millions) 2 Goa 1.6 0.094 21.7% 43.4% 0.0% 0.4 3 Punjab 27.1 0.120 26.2% 46.0% 1.0% 7.1 4 Himachal Pradesh 6.7 0.131 31.0% 42.3% 0.3% 2.1 5 Tamil Nadu 68.0 0.141 32.4% 43.6% 2.6% 22.0 6 Uttarakhand 9.6 0.189 40.3% 46.9% 0.5% 3.9 7 Maharashtra 108.7 0.193 40.1% 48.1% 6.0% 43.6 8 Haryana 24.1 0.199 41.6% 47.9% 1.3% 10.0 9 Gujarat 98.3 0.205 21.5% 49.2% 0.4% 0.8 10 Jammu and Kashmir 12.2 0.209 43.8% 47.7% 0.7% 5.4 11 Andhra Pradesh 83.9 0.211 44.7% 47.1% 5.1% 37.5 12 Karnataka 58.6 0.223 46.1% 48.3% 4.2% 27.0 13 Northeast Indian States 44.2 0.303 57.6% 52.5% 4.0% 25.5 14 West Bengal 89.5 0.317 58.3% 54.3% 8.5% 52.2 15 Orissa 40.7 0.345 64.0% 54.0% 4.3% 26.0 16 Rajasthan 65.4 0.351 64.2% 54.7% 7.0% 41.9 17 Uttar Pradesh 192.6 0.386 69.9% 55.2% 21.3% 134.7 18 Chhattisgarh 23.9 0.387 71.9% 53.9% 2.9% 17.2 19 Madhya Pradesh 70.0 0.389 69.5% 56.0% 8.5% 48.6 20 Jharkhand 30.5 0.463 77.0% 60.2% 4.2% 23.5
  • 15. showMPI rank States Population (in millions) 2007 MPI Proportion of MPI-poor Average intensity Contribution to overall MPI- poverty Number of MPI poor (in millions) 21 Bihar 95.0 0.499 81.4% 61.3% 13.5% 77.3 Other estimates According to a 2011 poverty Development Goals Report, as many as 320 million people in India and China are expected to come out of extreme poverty in the next four years, with India's poverty rate projected to drop from 51% in 1990 to about 22% in 2015.[99] The report also indicates that in Southern Asia, only India is on track to cut poverty by half by the 2015 target date.[99] In 2015, according to United Nations Millennium Development Goals (MGD) programme, India has already achieved the target of reducing poverty by half, with 24.7% of its 1.2 billion people in 2011 living below the poverty line or having income of less than $1.25 a day, the U.N. report said. The same figure was 49.4% in 1994. India had set a target of 23.9% to be achieved by 2015.[100] According to Global Wealth Report 2016[101] compiled by Credit Suisse Research Institute, India is the second most unequal country in the world with the top one per cent of the population owning 58% of the total wealth.[102] Global Hunger Index Global Hunger Index (GHI) is an index that places a third of weight on proportion of the population that is estimated to be undernourished, a third on the estimated prevalence of low body weight to height ratio in children younger than five, and remaining third weight on the proportion of children dying before the age of five for any reason. According to 2011 GHI report, India has improved its performance by 22% in 20 years, from 30.4 to 23.7 over 1990 to 2011 period.[103] However, its performance from 2001 to 2011 has shown little progress, with just 3% improvement. A sharp reduction in the percentage of underweight children has helped India improve its hunger record on the Global Hunger Index (GHI) 2014. India now ranks 55 among 76 emerging economies. Between 2005 and 2014, the prevalence of underweight children under the age of five fell from 43.5% to 30.7%.[104] Poverty: 2011–2012 Percentage of people by Caste[105] Findings below are based on a survey conducted during 2011–12. Total population of India then: 1,276,267,631 Caste-wise population distribution:[105] Caste % of total population No. of People FC 28.0% 357M OBC 44.1% 563M
  • 16. SC 19.0% 242M ST 8.9% 114M Total 100% 1276M Poverty in India based on caste:[105] Caste % of Poverty (intra-caste) No. of People % of Poverty in total population FC 12.5% 44.6M 3.5% OBC 20.7% 116.5M 9.1% SC 29.4% 71.2M 5.8% ST 43.0% 49.0M 3.8% Total - 281M 22% From the above 2 tables, we could derive the following to see if the distribution of poverty follows as that of the total population: Caste % of total population Poverty % over poverty population FC 28.0% 15.9% OBC 44.1% 41.4% SC 19.0% 25.3% ST 8.9% 17.4% Poverty in India based on Social and Religious Classes: The Sachar Committee looked at the Poverty by Social and Religious Classes[106] Social and Religious Class Percentage of Living in Poverty Urban Hindus 20.4% Urban Hindu General 8.3% Urban Hindu OBC 25.1% Urban Hindu SC/ST 36.4%
  • 17. Urban Muslims 38.4% Urban Other Minorities 12.2% Rural Hindus 22.6% Rural Hindu General 9.0% Rural Hindu OBC 19.5% Rural Hindu SC/ST 34.8% Rural Muslims 26.9% Rural Other Minorities 14.3% Economic impact of British imperialism The subject of the economic impact of British imperialism on India was raised by British Whig politician Edmund Burke who in 1778 began a seven-year impeachment trial against Warren Hastings and the East India Company on charges including mismanagement of the Indian economy. Contemporary historian Rajat Kanta Ray argues the economy established by the British in the 18th century was a form of plunder and a catastrophe for the traditional economy of India, depleting food and money stocks and imposing high taxes that helped cause the famine of 1770, which killed a third of the people of Bengal.[107] Reduction in poverty Main article: Poverty alleviation programmes in India Since the 1950s, the Indian government and non-governmental organisations have initiated several programs to alleviate poverty, including subsidising food and other necessities, increased access to loans, improving agricultural techniques and price supports, promoting education, and family planning. These measures have helped eliminate famines, cut absolute poverty levels by more than half, and reduced illiteracy and malnutrition. Although the Indian economy has grown steadily over the last two decades, its growth has been uneven when comparing social groups, economic groups, geographic regions, and rural and urban areas.[108][109] For the year 2015–16, the GSDP growth rates of Andhra Pradesh, Bihar and Madhya Pradesh was higher than Maharashtra, Odisha or Punjab.[110] Though GDP growth rate matters a lot economically, the debate is moving towards another consensus in India, where unhealthy infatuation with GDP growth matters less and holistic development or all-inclusive growth matters more.[111] While India may well be on the path to eradicating extreme poverty, it still lags well behind in other important development indicators, even in comparison to some of its neighbouring countries, especially in regard to health and education.[112] Despite significant economic progress, one quarter of the nation's population earns less than the government-specified poverty threshold of ₹32 per day (approximately US$ 0.6).[113]
  • 18. According to the 2001 census, 35.5% of Indian households used banking services, 35.1% owned a radio or transistor, 31.6% a television, 9.1% a phone, 43.7% a bicycle, 11.7% a scooter, motorcycle or a moped, and 2.5% a car, jeep or van; 34.5% of the households had none of these assets.[114] According to Department of Telecommunications of India, the phone density reached 73.34% by December 2012 and as an annual growth decreased by −4.58%.[115] This tallies with the fact that a family of four with an annual income of ₹137,000 (US$1,700) could afford some of these luxury items. The World Bank's Global Monitoring Report for 2014–15 on the Millennium Development Goals says India has been the biggest contributor to poverty reduction between 2008 and 2011, with around 140 million or so lifted out of absolute poverty.[116] Since the early 1950s, the Indian government has initiated various schemes to help the poor attain self-sufficiency in food production. A few examples of these initiatives include ration cards and price controls over the supply of basic commodities, particularly food at controlled prices, available throughout the country. These efforts prevented famines, but did little to eliminate or reduce poverty in rural or urban areas between 1950 and 1980.[117] India's rapid economic growth rate since 1991 is one of the main reasons for a record decline in poverty.[17][18][118] Another reason proposed is India's launch of social welfare programs such as the Mahatma Gandhi National Rural Employment Guarantee Act (MGNREGA) and the Midday Meal Scheme in government schools.[119] In a 2012 study, Klonner and Oldiges, concluded that MGNREGA helps reduce rural poverty gap (intensity of rural poverty) and seasonal poverty, but not overall poverty.[120][121] However, there is a disturbing side, as deprivation has tended to increase, and that too among the most deprived sections. According to the latest statistics published by the Census of India, among scheduled tribes, 44.7% of people were farmers working on their own land in 2001; however, this number came down to 34.5% in 2011. Among scheduled castes, this number declined from 20% to 14.8% during the same period. This data is corroborated by other data from the census, which also says that the number of people who were working on others' land (landless laborers), increased from 36.9% in 2001 to 44.4% among scheduled castes SC and from 45.6% to 45.9% among scheduled tribes.[122] India has achieved annual growth exceeding 7 percent over the last 15 years and continues to pull millions of people out of poverty, according to the World Bank. The country has halved its poverty rate over the past three decades and has seen strong improvements in most human development outcomes, a report by the international financial institution has found. Growth is expected to continue and the elimination of extreme poverty in the next decade is within reach, said the bank, which warned that the country's development trajectory faces considerable challenges.[123] See also Economic and socio-economic Economy of India Income in India India State Hunger Index
  • 19. Poverty rate by state Labour in India Social issues in India Hawker (trade) Debt bondage in India Housing Illegal housing in India List of slums in India Housing in India Pavement dwellers Street children in India Utilities Electricity sector in India Manual scavenging Water supply and sanitation in India Corruption Corruption in India Indian black money Other Family planning in India Malnutrition in India Women in agriculture in India References ^ "India kept extreme poverty below 1% despite pandemic: IMF paper". ^ "India has almost wiped out extreme poverty: International Monetary Fund". 7 April 2022. ^ "Worldbank Search". ^ "How India remains poor: 'It will take 7 generations for India's poor to reach mean income'". Downtoearth.org.in. Retrieved 28 February 2022.
  • 20. ^ Jump up to: a b Martin Ravallion, Shaohua Chen and Prem Sangraula (2008). "Dollar a Day Revisited" (PDF). The World Bank. ^ Jump up to: a b c "Country Briefing: India, Multidimensional Poverty Index (MPI) At a Glance" (PDF). Oxford Poverty and Human Development Initiative. Retrieved 16 August 2017. ^ Jump up to: a b c "Number and Percentage of Population Below Poverty Line". Reserve Bank of India. 2012. Archived from the original on 7 April 2014. Retrieved 4 April 2014. ^ World Bank's $1.25/day poverty measure- countering the latest criticisms The World Bank (January 2010). Retrieved 16 August 2017.1|page=50|url=https://openknowledge.worldbank.org/bitstream/handle/10986/20384/97814 64803611.pdf}} ^ Jump up to: a b Homi Kharas; Laurence Chandy (5 May 2014). "What Do New Price Data Mean for the Goal of Ending Extreme Poverty?". Washington D.C.: Brookings Institution. Retrieved 16 August 2017. ^ Puja Mehra (2 April 2016). "8% GDP growth helped reduce poverty: UN report". The Hindu. Retrieved 16 August 2017. ^ "Poverty headcount ratio at $5.50 a day (2011 PPP) (% of population)". World Bank. ^ Jump up to: a b c d e T. Roy, London School of Economics, Globalization, Factor Prices and Poverty in Colonial India, Australian Economic History Review, Vol. 47, No. 1, pp. 73–94 (March 2007) ^ Jump up to: a b c Maddison, Angus. (1970), The historical origins of Indian poverty, PSL Quarterly Review, 23(92), pp. 31–81. ^ Jump up to: a b Murton, Brian (2000), "VI.4: Famine", The Cambridge World History of Food 2, Cambridge, New York, pp. 1411–27 ^ Jump up to: a b A Sen (1983), Poverty and Famines: An Essay on Entitlement and Deprivation, Oxford University Press, ISBN 978-0198284635 ^ Beitler, Maddie (26 September 2020). "Colonial India: A Legacy of Neglect". ArcGIS StoryMaps. Retrieved 17 March 2022. It is important to note that there has not been a major famine in India since it gained its independence in 1947. ^ Jump up to: a b Bhagwati & Panagariya (2013), Why Growth Matters: How Economic Growth in India Reduced Poverty and the Lessons for Other Developing Countries, Public Affairs, ISBN 978- 1610393737 ^ Jump up to: a b Swaminathan S. Anklesaria Aiyar, The Elephant That Became a Tiger: 20 Years of Economic Reform in India Cato Institute (20 July 2011). Retrieved 16 August 2017. ^ John Burn-Murdoch and Steve Bernard, The Fragile Middle: millions face poverty as emerging economies slow, The Financial Times (13 April 2014). Retrieved 16 August 2017. ^ Sepoy, Inzamul (2019). Indian Economic Development. p. 84.
  • 21. ^ "30% of India is poor, says Rangarajan panel's new poverty line formula". First Post. 7 July 2014. Retrieved 21 October 2017. ^ "The middle class in India" (PDF). Deutsche Bank Research. 15 February 2010. Retrieved 16 August 2017. ^ "Report for Selected Countries and Subjects". Retrieved 16 August 2017. ^ "India – Data". Retrieved 16 August 2017. ^ "India's Poverty Rate Falls To 12.4%, Electricity Plays Big Role". 10 October 2015. Retrieved 16 August 2017. ^ Biswas, Soutik (15 November 2017). "Is India's middle class actually poor?". BBC News. ^ Poverty in India. Asian Development Bank. Retrieved 16 August 2017. ^ "A number 1 position India is happy to lose". The Times of India. ^ "Income inequality gets worse; India's top 1% bag 73% of the country's wealth, says Oxfam". Business Today. 22 January 2018. ^ Erenstein (2011), Livelihood Assets as a Multidimensional Inverse Proxy for Poverty: A District‐level Analysis of the Indian Indo‐Gangetic Plains, Journal of Human Development and Capabilities, 12(2), pp. 283–302. ^ Anant Vijay Kala (25 July 2013). "How to read India's poverty stats?". The Wall Street Journal. Retrieved 16 August 2017. ^ Krishna & Shariff (2011), The irrelevance of national strategies? Rural poverty dynamics in states and regions of India, 1993–2005. World Development, 39(4), pp. 533–549. ^ Chandy, L., & Gertz, G. (2011), Poverty in numbers: The changing state of global poverty from 2005 to 2015, Brookings Institution ^ THE DEFINITIONS OF POVERTY The World Bank (2009). ^ Jump up to: a b c d Donnan, Shawn (9 May 2014). "World Bank eyes biggest global poverty line increase in decades". Financial Times. ^ "India is home to world's largest poor population". Hindustan Times. 5 October 2015. ^ "India is no longer home to the largest number of poor people in the world. Nigeria is". Retrieved 5 February 2019. ^ "World Poverty Clock". Retrieved 5 February 2019. ^ Gordon Fisher, The Development and the history of poverty thresholds Social Security Bulletin, Vol 55, No 4 (Winter 1992), US Government. Retrieved 16 August 2017. ^ Panagariya & Mukim (2014), A comprehensive analysis of poverty in India. Asian Development Review, 31(1), pp. 1–52.
  • 22. ^ Jump up to: a b "Not poor if you earn Rs.32 a day: Planning Commission". India Today. 21 September 2011. Retrieved 16 August 2017. ^ Chen and Ravallion, China is Poorer than we Thought, But No Less Successful in the Fight against Poverty Policy Research Working Paper 4621, The World Bank (2008), page 9. ^ Chen & Ravallion (2013), More Relatively‐Poor People in a Less Absolutely‐Poor World, Review of Income, Wealth, 59(1), pp. 1–28. ^ Alkire & Sumner (2013), Multidimensional Poverty and the Post-2015 MDGs, Development, 56(1), pp. 46–51. ^ Paul, S. (1989), A model of constructing the poverty line, Journal of Development Economics, 30(1), pp. 129–144 ^ Sumner (2004), Economic Well-being and Non-economic Well-being, A Review of the Meaning and Measurement of Poverty, ISBN 92-9190-617-4 ^ Appleton (2001), 'The Rich Are Just Like Us, Only Richer': Poverty Functions or Consumption Functions?, Journal of African Economies, 10(4), pp. 433–469. ^ "La línea de la pobreza subió a $ 14.811 y la de indigencia a $ 6.045" [The poverty line rose to $ 14,811 and the poverty line to $ 6,045]. El Economista (in Spanish). 25 July 2017. Retrieved 31 December 2017. ^ China issues white paper on poverty reduction China (16 November 2011) ^ Federal Republic of Nigeria – Study for Poverty Profile (Africa) JICA Japan (March 2011) Retrieved 16 August 2017. ^ the official poverty line in the United States varies with number of people in a household, $13 per day is per person in a family of four ^ Martin Ravallion (January 2010). "World Bank's $1.25/day poverty measure- countering the latest criticisms". Research at the World Bank. The World Bank. Archived from the original on 10 December 2014. ... the official poverty line used in the United States is $13 a day in 2005 (per person, for a family of four). ^ Jump up to: a b 2014 Poverty Guidelines US Department of Health and Human Services (2014) ^ Food Security and Poverty in Asia and the Pacific Asian Development Bank (April 2012), ISBN 978- 92-9092-666-5, pp. 9–11. ^ REPORT OF THE EXPERT GROUP TO REVIEW THE METHODOLOGY FOR ESTIMATION OF POVERTY Archived 4 September 2011 at the Wayback Machine Govt of India (2009), pp. 11–27. ^ Gordon Fisher, The Development and the history of poverty thresholds Social Security Bulletin, Vol 55, No 4 (Winter 1992), US Government, pp. 9.
  • 23. ^ Smeeding et al., POVERTY, INEQUALTTY, AND FAMILY LIVING STANDARDS IMPACTS ACROSS SEVEN NATIONS: THE EFFECT OF NONCASH SUBSIDIES FOR HEALTH, EDUCATION AND HOUSING Review of Income and Wealth, Series 39, Number 3. September 1993, pp. 229–256. ^ Raymond Zhong (27 July 2014). "New Poverty Formula Proves Test for India". The Wall Street Journal. Retrieved 16 August 2017. ^ Press Note on Poverty Estimates, 2011–12 Government of India, p. 5. ^ Sarkar (1983), The colonial economy, In: S. Sarkar (Editor) Modern India: 1885–1947, Macmillan, ISBN 978-0333904251 ^ Thorner (1962), 'Deindustrialization' in India, 1881–1931, In: D. Thorner, and A. Thorner (Editors), Land and Labour in India, ISBN 978-8180280214 ^ Jump up to: a b c Richard Hunt (1997), To End Poverty – The Starvation of the Periphery by the Core, Oxford, UK, ISBN 978-0952887201, pp. 145–148. ^ These were variously called or were parts of United Provinces, Northwestern Provinces, Oudh, Behar, Bengal and Rewa in 19th century South Asia ^ Kranton and Swamy, Contracts, Hold-Up, and Exports: Textiles and Opium in Colonial India, American Economic Review, 98(3): 967–989. ^ Allen (1853), The opium trade: a sketch of its history, extent, effects as carried on in India and China at Google Books, J.P. Walker ^ Jump up to: a b The Parliamentary Debates, Volume 348, p. 1058, at Google Books, Hansard's, HM Government, Great Britain (14 August 1890), pp. 1054–1061. ^ Singh (2002), Population And Poverty, Mittal, ISBN 978-81-7099-848-8 ^ Reddy (1986), Trends in agricultural wages in some south Indian districts: 1800–1980, Indian Journal of Labour Economics, 28, pp. 307–349 ^ Raychaudhuri (1982), Non-agricultural production: Mughal India, In: T. Raychaudhuri, and I. Habib, (Editors), The Cambridge Economic History of India, Cambridge University Press. ^ Jump up to: a b M.H. Suryanarayana. "Nutritional Norms for Poverty: Issues and Implications" (PDF). Indira Gandhi Institute of Development Research. Retrieved 16 August 2017. ^ Richard Peet; Michael Watts, eds. (2004). Liberation Ecologies: Environment, Development and Social Movements. London: Routledge. pp. 44–49. ISBN 978-0415312363. ^ Davis, Mike (2001). Late Victorian Holocausts: El Niño Famines and the Making of the Third World. Verso. p. 7. ISBN 978-1859847398. ^ Romesh Dutt (1901), Indian Famines, Their Causes and Prevention, London ^ Jump up to: a b c B.S. Minhas, Rural Poverty, Land Redistribution and Development Strategy: Facts and Policy, Indian Economic Review New Series, Vol. 5, No. 1 (APRIL 1970), pp. 97–128
  • 24. ^ B.S. Minhas (1974), Planning and the Poor at Google Books, Chand, pp. 71–76. ^ Jump up to: a b Gary S. Fields, Poverty, Inequality, and Development at Google Books, ISBN 978- 0521298520, pp. 204–210 ^ "Poverty Puzzle". The Statesman. 22 November 2013. Archived from the original on 15 July 2014. ^ Arvind Singhal (28 August 2008). "A market at the bottom of the pyramid?" (PDF). Retrieved 16 August 2017. ^ Joshi, P. D. (Department of Statistics, Ministry of Planning and Programme Implementation, India). "Conceptualisation, Measurement and Dimensional Aspects of Poverty in India, by P. D. Joshi, Department of Statistics, Ministry of Planning and Programme Implementation, India" (PDF). Seminar on Poverty Statistics Santiago 7–9 May 1997. United Nations Statistical Commission Expert Group on Poverty Statistics. Retrieved 16 August 2017. ^ P. Sarangi, Consumption, Poverty And Inequality, ISBN 978-8183562645, pp. 188–200 ^ "Poverty in India". Economic and Political Weekly. 6 (2). 9 January 1971. Retrieved 16 August 2017. ^ "Proceedings of the workshop on forests for poverty reduction: changing role for research, development and training institutions". Fao.org. Retrieved 16 August 2017. ^ "Report of The Expert Group on Estimation of Proportion and Number of Poor" (PDF). Perspective Planning Division, Planning Commission. Retrieved 16 August 2017. ^ Banerjee & Somanathan (2007), The political economy of public goods: Some evidence from India, Journal of development Economics, 82(2), pp. 287–314 ^ Chen, S., G. Datt, and M. Ravallion (1994), Is poverty increasing in the developing world?, Review of Income and Wealth, 40 (4): 359–376. ^ Jump up to: a b Datt (1998), Poverty in India and Indian states: An update, IFPRI, Washington D.C.. Retrieved 16 August 2017. ^ Jump up to: a b Acharya, Arun Kumar; Naranjo, Diego López (2019), "Practices of Bonded Labour in India: Forms of Exploitation and Human Rights Violations", The SAGE Handbook of Human Trafficking and Modern Day Slavery, SAGE Publications Ltd, pp. 126–138, doi:10.4135/9781526436146.n6, ISBN 9781473978553, S2CID 169418671, retrieved 3 May 2020 ^ "Report of the Expert Group to Recommend the Detailed Methodology for Identification of Families Living Below Poverty Line in the Urban Areas" (PDF). Planning Commission. Retrieved 16 August 2017. ^ "Report on Condition of Work and Promotion of Livelihoods in the unorganised sector" (PDF). Archived from the original (PDF) on 30 March 2016. Retrieved 16 August 2017. ^ "Calorie intake criterion puts 50 per cent Indians below poverty line". The Hindu. Chennai, India. 19 September 2009. Retrieved 16 August 2017.
  • 25. ^ Arvind Singhal (28 August 2008). "Arvind Singhal: A market at the bottom of the pyramid?" (PDF). Retrieved 16 August 2017. ^ "Expert Group on Methodology for Estimation of Poverty". Planning Commission. Retrieved 21 October 2017. ^ "Poverty Estimates for 2009–10". Press Information Bureau, Government of India. Retrieved 21 October 2017. ^ "Rangarajan Report on Poverty". Press Information Bureau, Government of India. Retrieved 21 October 2017. ^ "Rangarajan defends poverty estimates". The Hindu. 7 July 2014. Retrieved 21 October 2017. ^ "Three out of ten in India are poor, says Rangarajan panel report". India Today. Retrieved 21 October 2017. ^ "Resource Watch". resourcewatch.org. Retrieved 17 March 2022. ^ "Country Briefing: India" (PDF). Oxford Poverty and Human Development Initiative. 2010. Retrieved 14 June 2011. ^ Jump up to: a b "India's poverty will fall from 51% to 22% by 2015: UN report". The Times of India. PTI. 8 July 2011. Retrieved 16 August 2017. ^ Vibhuti Agarwal (5 February 2015). "India Hits Its U.N. Poverty-Cutting Target, but Misses Others". Retrieved 16 August 2017 – via Wall Street Journal. ^ "Global Wealth Report 2016". Credit Suisse Research Institute. Archived from the original on 23 November 2016. Retrieved 16 August 2017. ^ "India second most unequal country in the world: Wealth Report". Hindustan Times. 24 November 2016. Retrieved 16 August 2017. ^ "2011 Global Hunger Index Report" (PDF). International Food Policy Research Institute (IFPRI). pp. 12, 49. ^ Sayantan Bera (13 October 2014). "India betters its rank in Global Hunger Index". Mint. Retrieved 16 August 2017. ^ Jump up to: a b c "Working Paper No. 2013-02.Poverty by Social, Religious & EconomicGroups in India and Its Largest States1993-94 to 2011–12 (Pages 6–7)" (PDF). Archived from the original (PDF) on 9 March 2014. ^ Social, Economic, and Educational Status of the Muslim Community in India Retrieved 16 August 2017. ^ Rajat Kanta Ray, "Indian Society and the Establishment of British Supremacy, 1765–1818," in The Oxford History of British Empire: vol. 2, The Eighteenth Century ed. by P. J. Marshall, (1998), pp 508– 29.
  • 26. ^ "Inclusive Growth and Service delivery: Building on India's Success" (PDF). World Bank. 2006. Retrieved 16 August 2017. ^ Luis Flores Ballesteros (28 September 2010). "How lack or poor infrastructure shapes inequality and poverty in supernations. A lesson from India" 54 Pesos Sep. 2010:54 Pesos 28 Sep 2010". 54pesos.org. Archived from the original on 3 October 2011. Retrieved 16 October 2011. ^ "AP stands 1st in India in GSDP growth rate". The Times of India. TNN. 12 June 2016. Retrieved 16 August 2017. ^ Borooah, Vani K.; Diwakar, Dilip; Mishra, Vinod Kumar; Naik, Ajaya Kumar; Sabharwal, Nidhi S. (2014). "Caste, inequality, and poverty in India: a reassessment". Development Studies Research. 1 (1): 279–294. doi:10.1080/21665095.2014.967877. ^ Roli Mahajan (20 October 2018). "Good progress with further room for improvement". D+C, development and cooperation. Retrieved 5 February 2019. ^ Jayati Ghosh (4 October 2011). "India's official poverty line". The Guardian. London. Retrieved 16 August 2017. ^ "Households Availing Banking Services with Households in India" (PDF). Town and Country Planning Organisation, Ministry of Urban Affairs. 2001. Retrieved 31 July 2009.[dead link] ^ "Department of Telecom, memo Feb 2013". Department of Telecommunication of India. 2013.[dead link] ^ Manas Chakravarty (13 October 2014). "The World Bank on India's poverty". Retrieved 16 August 2017. ^ "India's Urban Poverty Agenda: Understanding the Poor in Cities and Formulating Appropriate Anti-Poverty Actions" (PDF). Goa, India. 9–21 January 2000. Archived from the original (PDF) on 5 July 2014. Retrieved 22 May 2014. ^ Ravallion & Datt (2002), Why has economic growth been more pro-poor in some states of India than others?, Journal of development economics, 68(2), 381–400 ^ Suman, Santosh Kumar. "Relevance of MGNREGA in India" (PDF). AEBM. Krishi Sanskriti Publications. 3 (7): 781–783. Retrieved 17 March 2022. ^ Klonner and Oldiges, Employment Guarantee and its Welfare E§ects in India University of Heidelberg, (September 2012) ^ Klonner and Oldiges, Safety Net for India's Poor or Waste of Public Funds? Poverty and Welfare in the Wake of the World's Largest Job Guarantee Program University of Heidelberg, Germany (May 2014) ^ Ashwani Mahajan (12 November 2013). "Depriving the poor". Deccan Herald. Retrieved 16 August 2017. ^ "World Poverty Clock". Retrieved 17 March 2022.
  • 27. Further reading Breman, Jan; et al. (2019). "Chapter 6: A Mirage of Welfare: How the Social Question in India Got Aborted". The Social Question in the Twenty-First Century: A Global View. Oakland, California: University of California Press. doi:10.1525/luminos.74.g. ISBN 978-0520302402. S2CID 230116593. "Poverty in India". World Bank. "Can India eradicate poverty? Will India's economic boom help the poor?". Archived from the original on 5 March 2016. Deaton, A.; Kozel, V. (11 August 2005). "Data and Dogma: The Great Indian Poverty Debate" (PDF). The World Bank Research Observer. 20 (2): 177–199. doi:10.1093/wbro/lki009. ISSN 0257-3032. "World Hunger – India". 11 February 2009. Archived from the original on 11 February 2009. George, Abraham. "Why the Fight Against Poverty is Failing: A Contrarian View". Wharton Business School Publications. Rohr, Mathieu von (9 August 2007). "Poverty and riches in booming India". Der Spiegel. External links Media related to Poverty in India at Wikimedia Commons "Poverty in India 2". Tendulkar, Suresh. "Expert Group on Methodology for Estimation of Poverty". "From poverty to empowerment: India's imperative for jobs, growth, and effective basic services". McKinsey Global Institute. 2013. Perspectives on Poverty in India (PDF). The World Bank. 2013. ISBN 978-0-8213-8689-7. "Chapter 4: DEFINING AND EXPLAINING INCLUSIVE GROWTH AND POVERTY". INDIA (PDF). International Monetary Fund. 2014. show v t e Economy of India Companies BSE SENSEX NIFTY 50
  • 28. Government-owned companies List of companies Governance Ministry of Finance Finance ministers Ministry of Commerce and Industry Finance Commission Economic Advisory Council Central Statistical Office Securities and Exchange Board of India Enforcement Directorate External debt Foreign trade Foreign direct investment Foreign exchange reserves Remittances Taxation Subsidies Industrial licensing Voluntary guidelines NITI Aayog Make in India Atmanirbhar Bharat Currency Indian rupee Sign History Historical Forex
  • 29. Coinage Paisa Reserve Bank of India Governor Mint Inflation Financial services Banking Banks Insurance Multi Commodity Exchange Bullion Black money Stock exchanges Bombay National History COVID-19 impact Economic development Liberalisation Privatisation Globalisation Licence Raj Green revolution Government initiatives Numbering system People Billionaires Demography
  • 30. Income Poverty Labour law Pensions EPFO NPS PPF States Andhra Pradesh Assam Bihar Delhi Goa Gujarat Haryana Himachal Pradesh Jammu and Kashmir Jharkhand Karnataka Kerala Ladakh Madhya Pradesh Maharashtra Mizoram Odisha Punjab Rajasthan
  • 31. Tamil Nadu Telangana Uttarakhand Uttar Pradesh West Bengal Sectors Agriculture Livestock Fishing Automotive Chemical Construction Defence Education Energy Electricity Nuclear Oil and gas Solar Wind Electronics and semiconductor Entertainment Forestry Gambling Healthcare Information technology Media
  • 32. Cinema FM Radio Television Printing Mining Coal Iron and Steel Pharmaceuticals Pulp and paper Retail Science and technology Biotechnology Telecommunications Textiles Tourism Transport Aviation Civil Ports Rail Roads Utilities Electricity Water Power Regulator IRDAI
  • 33. RBI SEBI IBBI Other NCLT NCLAT BIFR IBBI IBC SARFESI Act Income Tax Act Companies Act Banking Act Insurance Act FEMA Category Commons Wikiquotes show v t e Social issues in India Economy Communications Famine Farmers' suicides
  • 34. Labour Land reforms Debt bondage National Pension System Poverty BPL Public distribution system Remittances Slums Clearance Standard of living Street vendors Transport Urbanisation Unemployment Widening income gap Education Literacy Ragging Environment Conservation Climate change Manual scavenging Natural disasters Water supply and sanitation Water disputes Family Cohabitation Domestic violence
  • 35. Dowry system Family planning Joint family Infertility Nuclear family Polyandry Polygamy Children Abortion Child labour Child marriage Child prostitution Child trafficking Female foeticide Female infanticide Street children Women Acid attack Bride burning Devadasi Dowry death Eve teasing Women's health Feminism Menstrual taboo Prostitution Rape Sati
  • 36. Sexism Caste system Caste politics Caste-related violence Dalit Reservation Communalism Proposed states and territories Ethnic relations Religious violence Secularism Separatist movements Crime Corruption Groom kidnapping Human trafficking Illegal housing Illegal immigration Illegal mining Organised crime Terrorism Vigilantism Cybercrime Health Diabetes Epidemics HIV/AIDS Leprosy Malnutrition
  • 37. Obesity Suicide Tuberculosis Media Censorship Internet Films about social issues Freedom of expression Social impact of Indian television drama Fake news Other issues Colourism Feudalism Gambling Sexuality LGBT Homosexuality Hijra Human rights Prohibition Superstitions show v t e India topics
  • 38. show History Overviews Timeline Years Astronomy Clothing Coinage Economics LGBT Linguistics Maritime Mathematics Metallurgy Military Postal Science and technology Ancient Stone Age Indus Valley civilization Vedic period Mahajanapadas Mauryas Yavana Kingdom Achaemenid conquest of the Indus Valley Indo-Parthian Kingdom Kushan Empire Alchon Huns
  • 39. Seleucid–Mauryan war Middle Kingdoms Middle kingdoms Chola Middle Ages Medieval India Hoysala Pala Kakatiya Delhi Sultanate Vijayanagara Early Modern Mughals Marathas European trade Bengal War Late modern Colonial Princely state East India Company Plassey 1857 rebellion British Raj Railways Economy Army Commander-in-Chief Zamindari Bengali Renaissance
  • 40. Political reforms Partition of Bengal Independence movement 1943 famine World War II Partition Republic Integration Non-Aligned Movement Five-Year Plans Sino-Indian War Indo-Pakistani wars Green Revolution White Revolution Naxal Insurgency Smiling Buddha Space programme The Emergency Indian Peace Keeping Force (IPKF) Contemporary History of India (1947–present) Economic liberalisation Pokhran-II COVID-19 pandemic show Geography Environment Biosphere reserves
  • 41. Climate Climate change Earthquakes Ecoregions Environmental issues Fauna Flora Geology National parks Protected areas Wildlife sanctuaries Landforms Beaches Desert Extreme points Glaciers Islands Lakes Mountains Plains Indo-Gangetic Eastern coastal Western coastal Rivers Valleys Volcanoes
  • 42. Waterfalls Regions East North Northeast South West Subdivisions Autonomous administrative divisions Borders Towns Cities Districts Municipalities States and union territories show Politics Government Agencies Energy policy Foreign relations Parliament Lok Sabha Rajya Sabha President Vice President Prime Minister Union Council of Ministers
  • 43. Civil Services Cabinet Secretary State governments State legislatures State legislative assemblies State legislative councils Governors, Lieutenant Governors and Administrators Chief Ministers Chief Secretaries Law Constitution Penal Code Fundamental rights, principles and duties Human rights Supreme Court Chief Justice High Courts District Courts Enforcement Federal Border Security Force (BSF) Central Industrial Security Force (CISF) Central Reserve Police Force (CRPF) Indo-Tibetan Border Police (ITBP) National Security Guard (NSG) Railway Protection Force (RPF) Sashastra Seema Bal (SSB) Special Protection Group (SPG)
  • 44. Intelligence Bureau of Police Research and Development (BPR&D) Central Bureau of Investigation (CBI) Directorate of Revenue Intelligence (DRI) Enforcement Directorate (ED) Intelligence Bureau (IB) Joint Intelligence Committee (JIC) Narcotics Control Bureau (NCB) National Investigation Agency (NIA) Research and Analysis Wing (R&AW) Military Army Navy Air Force Politics Censorship Elections Nationalism Political parties Reservations Scandals Scheduled groups Secularism Women in politics show Economy Companies BSE SENSEX
  • 45. NIFTY 50 Government-owned companies List of companies Governance Ministry of Finance Finance ministers Ministry of Commerce and Industry Finance Commission Planning Commission Economic Advisory Council Central Statistical Office Securities and Exchange Board of India Enforcement Directorate Foreign trade Remittances Taxation Subsidies Industrial licensing Voluntary guidelines NITI Aayog Make in India FDI in India Currency Indian rupee History Historical exchange rates data of the Indian rupee Coinage Reserve Bank of India
  • 46. Governors India Government Mint Financial services Banking Banks Insurance Foreign exchange reserves Bombay Stock Exchange National Stock Exchange Multi Commodity Exchange Bullion Black money History Economic Development Economic liberalisation Licence Raj Green revolution Government initiatives Numbering system People Billionaires Businesspeople Demography Income Poverty Labour law Pensions EPFO NPS
  • 47. PPF States Andhra Pradesh Assam Bihar Goa Gujarat Haryana Himachal Pradesh Jammu and Kashmir Karnataka Kerala Madhya Pradesh Maharashtra Manipur Mizoram Nagaland Odisha Punjab Rajasthan Tamil Nadu Telangana Uttarakhand Uttar Pradesh West Bengal Sectors Agriculture Livestock
  • 49. Transport Aviation Civil Ports Rail Utilities Electricity Water show Society and culture Society Caste system Corruption Demographics Indians Women Education Universities in India Medical colleges in India Law colleges in India Engineering colleges in India Ethnic relations Healthcare Hospitals in India Languages Literacy Poverty
  • 50. Prisons Religion Socio-economic issues Standard of living Water supply and sanitation Sexuality Crime Culture Arts and entertainment Architecture Blogging Cinema Comics Webcomics Cuisine wine Dance Dress Folklore Festivals Literature Media television Martial arts Music Painting Public holidays
  • 51. Sculpture tallest Sport show v t e Poverty Other aspects Measuring poverty Diseases of poverty Cycle of poverty Poverty reduction Sustainable Development Goals Metrics Homeless Vulnerability Index Misery index (economics) Gini coefficient Genuine progress indicator Legatum Prosperity Index Poverty gap index Human Poverty Index Multidimensional Poverty Index Scottish Index of Multiple Deprivation By Location Africa Algeria Democratic Republic of the Congo Egypt
  • 54. Haiti Honduras Jamaica Mexico Paraguay Peru United States Uruguay Venezuela Other Theories of poverty Well-being Welfare Wellness Quality of life Self-perceived quality-of-life scale Subjective well-being (SWB) Suboptimal health Stress Rural access issues Providing Urban Amenities to Rural Areas Post-materialism Pen's parade show v t e
  • 55. Diseases of poverty Diseases of poverty AIDS Malaria Tuberculosis Measles Pneumonia Diarrheal diseases Plague Neglected diseases Cholera Chagas disease African sleeping sickness Schistosomiasis Dracunculiasis River blindness Leishmaniasis Trachoma Miscellaneous Malnutrition Priority review voucher See also List of countries by percentage of population living in poverty · Deprivation and poverty indicators show v t e
  • 56. Poverty in Asia Sovereign states Afghanistan Armenia Azerbaijan Bahrain Bangladesh Bhutan Brunei Cambodia China Cyprus East Timor (Timor-Leste) Egypt Georgia India Indonesia Iran Iraq Israel Japan Jordan Kazakhstan North Korea South Korea Kuwait Kyrgyzstan
  • 58. Northern Cyprus Palestine South Ossetia Taiwan Dependencies and other territories British Indian Ocean Territory Christmas Island Cocos (Keeling) Islands Hong Kong Macau Category Asia portal <img src="//en.wikipedia.org/wiki/Special:CentralAutoLogin/start?type=1x1" alt="" title="" width="1" height="1" style="border: none; position: absolute;" /> Retrieved from "https://en.wikipedia.org/w/index.php?title=Poverty_in_India&oldid=1118525461" Categories: Poverty in India Hidden categories: CS1 Spanish-language sources (es) Webarchive template wayback links All articles with dead external links Articles with dead external links from August 2017 Wikipedia indefinitely semi-protected pages Use Indian English from May 2019 All Wikipedia articles written in Indian English Use dmy dates from October 2016 Articles with short description Short description matches Wikidata
  • 59. Commons category link from Wikidata AC with 0 elements Navigation menu Personal tools Not logged in Talk Contributions Create account Log in Namespaces Article Talk English Views Read View source View history More Search Top of Form Search Go Bottom of Form Navigation Main page Contents Current events
  • 60. Random article About Wikipedia Contact us Donate Contribute Help Learn to edit Community portal Recent changes Upload file Tools What links here Related changes Upload file Special pages Permanent link Page information Cite this page Wikidata item Print/export Download as PDF Printable version In other projects Wikimedia Commons Wikiquote Languages भभभभभभभ
  • 61. ‫سی‬ ‫ار‬ ‫ف‬ हहहहहह ‫עברית‬ हहहहह हहहहहह हहहहहह ‫ی‬ ‫نجاب‬ ‫پ‬ Simple English हहहहह 3 more Edit links This page was last edited on 27 October 2022, at 13:38 (UTC). Text is available under the Creative Commons Attribution-ShareAlike License 3.0; additional terms may apply. By using this site, you agree to the Terms of Use and Privacy Policy. Wikipedia® is a registered trademark of the Wikimedia Foundation, Inc., a non-profit organization. Privacy policy About Wikipedia Disclaimers Contact Wikipedia Mobile view Developers Statistics Cookie statement Edit preview settings