SlideShare a Scribd company logo
1 of 39
Download to read offline
1
Deserts converted into Forests
By Arthur Middleton Hughes
The Database Marketing Institute
ABSTRACT
Australia is a huge continent with a largely unused desert of 339,000,000 acres in the middle. Australia
could double its national income if the part of this desert not currently used for mining or National Parks
could be converted into profitable forests. This can be done by building profitable plantations of
Paulownia (or other fast growing hardwoods) in the deserts served by modern desalination plants on the
shores. An additional advantage of this process would be a major reduction in the worldwide CO2
problem since converting 80% of the desert to forests would absorb in marketable lumber 4 billion tons
of C02 annually – half of the world’s current requirement for CO2 capture and storage.
This entire process can be conducted without the net spending of any additional government funds. Such
government assistance (survey of the desert, compulsory acquisition and resale of tracts to plantations,
maintenance of law and order and public services) can be repaid by land sales corporate taxes and
substantial VAT revenue from the production of timber and fresh water. Unlike the present situation
where the western deserts are dry undesirable places to live, the plantations can be made very attractive
places for families to live with schools, churches, well-built private houses, shopping centers, medical
clinics, golf courses, sports fields, swimming pools, police, clean water, electric power and jobs.
Opening up the deserts is inevitable in the long run. By starting now, it will convert Australia into a major
economic and environmental power in the world. It will be like acquiring a whole new country of 529,000
square miles – – a country bigger than France, Spain, Sweden, Germany, New Zealand, or the UK.
Australia can double its national income if and when this desert is converted into profitable forests.
Key Words: Desalination, plantations, forests, deserts, profits, CO2, VAT, stock value, Climate Change,
Reverse Osmosis
Figure 01 New Forests in the Australian Desert Copyright "Environment Forest Farms 2005"
2
CONTENTS
ABSTRACT................................................................................................................................................... 1
INTRODUCTION .......................................................................................................................................... 3
THE GEOGRAPHY OF AUSTRALIA ........................................................................................................... 3
LOCATION OF THE PLANTATIONS........................................................................................................... 4
MINING AREAS IN AUSTRALIA ................................................................................................................ 5
NATIONAL PARKS ...................................................................................................................................... 6
HOW A PILOT PLANTATION COULD BE SET UP ..................................................................................... 8
HOW TREE PLANTATIONS WILL BE FINANCED..................................................................................... 9
THE ROLE OF THE WESTERN AUSTRALIAN GOVERNMENT .............................................................. 10
COST OF POWER FOR THE DESALINATION PLANTS ........................................................................... 12
WHO SHOULD PAY WHOM? .................................................................................................................... 13
DESALINATION BY REVERSE OSMOSIS................................................................................................ 14
LAYING THE PIPELINE FOR WATER DELIVERY ..........................................................................................16
WHY THE DESERTS?................................................................................................................................. 18
HOW THE TOWNS SHOULD INTERFACE WITH THE FORESTS............................................................ 19
WHY PAULOWNIA TREES?...................................................................................................................... 20
THE WORLD MARKET FOR AUSTRALIAN LUMBER ............................................................................ 22
AUSTRALIA’S NEED FOR INCREASED WOOD PRODUCTION ............................................................. 24
HOW THE DESERT CAN BE CONVERTED TO FOREST.......................................................................... 25
DECISIONS TO BE MADE ......................................................................................................................... 26
APPENDIX.................................................................................................................................................. 26
HOW THIS PAPER CAME TO BE WRITTEN............................................................................................. 26
ENVIRONMENTAL IMPLICATIONS OF THE FORESTS.......................................................................... 27
THE WRONG WAY TO PLANT TREES IN THE DESERT.......................................................................................28
CONCLUSIONS ON CARBON DIOXIDE SPENDING ............................................................................... 30
3
WILL THE SAHARA NATIONS ADOPT FORESTATION?........................................................................ 30
FINANCIAL TABLES FOR PLANTATIONS.............................................................................................................31
FINANCIAL TABLES FOR DESALINATION PLANTS.............................................................................................34
REFERENCES............................................................................................................................................. 37
INTRODUCTION
As economics works, any available resource, if it is profitable, will eventually be developed by
entrepreneurs. This is true of coal, oil, natural gas, or real estate. As you can see by reading this paper,
the undeveloped deserts of Australia are an available resource which can be very profitable for
someone. They are not developed today because they are hot, dry and less desirable than the land
along the coasts. Once the coastland has all been developed Australians will see the deserts in a new
light. They will plant trees on them to make money. When will that happen? Ten years, twenty years,
thirty years from now? Who knows? All we know is that it will happen. So why not right away? The
purpose of this paper is to point out that there is profit to be made. If you are an entrepreneur you
could be richer than you are now by creating a desalination plant or building a plantation in the desert.
The facts are available. It is up to someone to take action.
THE GEOGRAPHY OF AUSTRALIA
Most of Australia's interior is dry and waterless. The very low average annual rainfall means
interior rivers are often dry and lakes empty. Flood events drastically alter the dry environment
in which the ecology of central Australia has had to adapt to the boom and bust cycle.
Figure 02 Map of the Forests of Australia Source: Forests Australia - Fast Forest
Factsadl.brs.gov.au
4
Australia’s forests are around the edges. The center of Australia is dry desert.
There are 1,882,431,500 acres in total with 339,000,000 (17.5%) of them desert. The desert
area is so dry that few people want to live there. The few workers (chiefly miners) who work
there have to be flown in every week or two. The mining companies in general have not
constructed the type of living facilities such as housing, restaurants, shopping, sports facilities,
etc. that would encourage families to locate there. This central desert area is vast. It is bigger
than most of the countries of the world. Making this desert area a livable place would change
the entire geography of Australia.
Where would the water come from to change the deserts into forests? Desalination of the sea
water. There are 15,000 desalination plants around the world. The most efficient ones are
producing fresh water at 1/5 of a cent per gallon. To grow trees in a forest they need 960,000
gallons of water per acre per year.
(http://www.forestry.gov.uk/pdf/fcin065.pdf/$FILE/fcin065.pdf )
There is some, but very little rainfall in the Western Australia desert --that’s why it’s a desert.
To be on the safe side, we would have to add about 860,000 gallons of water per year to each
acre to grow trees in the desert. At the rate of 1/5 of a cent per gallon, 860,000 gallons of
water will cost $1,720.00 per acre per year. That sounds like a lot, but perhaps not when you
look at what you can grow for that amount of money.
One possible type of tree to be grown in the deserts would be Paulownia trees which are grown
successfully all over the world including Australia. Many case studies report that you can make
$8,000 or more per acre per year by selling the lumber from these trees. Currently, there is a
shortage of wood in Australia. We are importing wood from abroad. The government would
very much like to see more grown domestically.
LOCATION OF THE PLANTATIONS
This essay proposes starting with a pilot tree plantation of 8,300 acres in the desert with a small
desalination plant located nearby on the shore to provide water. They would be connected by a water
line and natural gas line buried in the ground. Where should the pilot plant be located? There are
several considerations for the location:
1) The plantation should be relatively close to the shore to keep the pipeline as short as possible.
2) The pilot plant should have an easy access to paved road to get the lumber to market.
3) The plantation and the pipeline should not interfere with any indigenous heritage areas (see
below).
4) They should not interfere with any mining area (see below).
5) They should not interfere with any National Park (see below).
6) It should be located in an area relatively free from brush fires.
5
The outback is vast: 339 million acres. There are very few people who live there. The total population of
Outback Australia declined from 700,000 in 1996 to 690,000 in 2006. That’s one person for every 491
acres. 17% of the total population is indigenous. Besides these indigenous people, the other 573,000
live in mining areas and national parks. In general, the deserts are flat.
The extent and intensity of forest fires in Australia vary with latitude and season of rainfall. In northern
Australia, where conditions are generally humid, low-intensity fires often burn across large areas. Hot,
dry and windy summers in south-eastern Australia often lead to intense bushfires that are difficult to
control. Those fires can cause loss of human life and can destroy assets such as trees, livestock,
buildings, fences, bridges and power lines. Bushfires in southern Australia lead to soil erosion and
degrade stream water quality. The resulting natural regrowth reduces water yields for decades.
Australia deserts are also occasionally home to dust storms which swirl the sand high into the air.
The plantations which we propose will change the forest fire situation in their vicinity. In general, new
growth well-watered and well-maintained trees do not catch fire easily. What burns easily are dry
materials in old-growth forests. This material will not be present in the new plantations proposed in this
essay.
MINING AREAS IN AUSTRALIA
As can be seen from the map in Figure 03, there are millions of acres suitable for plantations that are
not occupied by mining companies.
Figure 03 Mining Areas of Australia Showing a Possible Pilot Plantation Source: Google.
6
Other than agriculture and tourism, the main economic activity in this vast and sparsely settled area is
mining. Owing to the complete absence of mountain building and glaciation since the Permian (in many
areas since the Cambrian) ages, the outback is extremely rich in iron, aluminum, manganese and
uranium ores, and also contains major deposits of gold, nickel, iron, lead and zinc ores. Because of its
size, the value of mining is considerable. Major mines and mining areas in the outback include opals at
Coober Pedy, Lightning Ridge and White Cliffs, metals at Broken Hill, Tennant Creek, Olympic Dam and
the remote Challenger Mine. Oil and gas are extracted in the Cooper Basin around Moomba.
In Western Australia the Argyle diamond mine in the Kimberley (Western Australia) is the world's
biggest producer of natural diamonds and contributes approximately one-third of the world's natural
supply. The Pilbara region's economy is dominated by mining and petroleum industries Most of
Australia's iron ore is also mined in the Pilbara and it also has one of the world's major manganese
mines.
The plantations proposed in this paper will not disturb these mining areas in any way. As the plantations
grow, they will make it easier to develop the mining areas. Miner’s families will eventually want to settle
in the new towns that will be created by plantations that are near to the mining areas. They will use the
housing, shopping centers, schools, hospitals and recreational facilities. Mine operators will find it much
easier to attract workers who will stay at the mines, with their families living nearby in highly civilized
towns.
NATIONAL PARKS
Australia has over 500 national parks. Over 69 million acres of land are designated as national parkland,
accounting for almost four per cent of Australia's land areas. In addition, a further six per cent of
Australia is protected and includes state forests, nature parks and conservation reserves.
National parks are usually large areas of land that are protected because they have unspoiled
landscapes and a diverse number of native plants and animals. This means that commercial activities
such as farming or tree plantations are prohibited and human activity is strictly monitored. As can be
seen in Figure 04, there is plenty of space for tree plantations that will not interfere with National Parks
or state forests – and will, in fact, make access to the parks easier for Australians than it is now.
Figure 04 Australian National Parks Source: Australian National Park Service
7
Aboriginal sacred sites are areas or places in the Australian landscape of significant Aboriginal Australian
meaning within the context of the localized indigenous belief system, known as The Dreaming, which
has its origins in Dreamtime. Sites sacred to Aboriginal people are part of Australia’s cultural heritage,
connecting the land with the cultural values, spiritual beliefs and kin-based relationships of the local
people. There are so few such sites that it should not be difficult to find dozens of sites for plantations
that do not interfere with such sacred sites.
Farming in Australia
Agriculture is an important sector for the Australian economy, generating up to $43 billion in gross value
each year. Farming employs around 370,000 people across Australia.
Although agriculture is not as extensive as at its peak in the mid -1970s, farms still take up around sixty
per cent of all the land in Australia. There are no known farms in the desert area where the new
plantations are to be located.
Main Roads
There are few paved roads in the desert areas. Close to Perth, however, there are roads that can be
used to access the planned pilot plantation.
Figure 05 Roads near the proposed pilot plantation
8
HOW A PILOT PLANTATION COULD BE SET UP
The deserts can be converted in to forests, one plantation at a time. A group of entrepreneurs can build
a desalination plant to serve a group of foresters who want to create a plantation. The government can
determine the locations for the desalination plant and the plantation. The two would be linked by a
contract to produce and sell fresh water at $0.002 per gallon in quantities sufficient to grow trees on the
8000 acre plantation and provide water for the 300 acre residential and commercial section. A pilot
desalination plant to do this can be started by selling securities at $100 each. Table 01 is a financial
picture for the desalination plant:
Table 01 Financial Plan for the Pilot Desalination Plant
Pilot Plantation
9
It would take a couple of years to hold the hearings and get all the permits to build the plant. This plant
would be built at the same time that another group of investors is getting organized to start a plantation
of 8,300 acres to be serviced by this desalination plant.
As table 02 shows, after about ten years, the original investors who paid $100 each for their shares in
the desalination company would find their shares were worth $398 each. If they hang on to them, they
will be worth far more. I assume that the desalination company will build at least four more plants in the
future, each serving larger and larger plantations using the accumulated cash from the previous plants.
Table 02 shows the growth in value of the original $100 shares as a result of building these new
desalination plants.
Table 02 Cost of Desalination Plants and Stock Value
HOW TREE PLANTATIONS WILL BE FINANCED
Those starting a tree plantation have to be able to wait for five to eight years until they harvest
their first crop. This is normal for any farmer or tree planter. But in the Australian deserts, there
is a new wrinkle. They have to pay thousands of dollars for water for those years until their
Financial Plan for the Pilot Desalination Plant 8 year results Supports: 8,300 Acres
Sale of shares of stock 1,050,000 $100 each $105,000,000
Costs Per Year Years Cost/Revenue
Cost to build Desalination Plant & Pipeline $97,236,400 1 $97,236,400
Water Sales Pilot Plant $13,760,000 8 $110,080,000
VAT 10% 8 $11,008,000
Running Costs $2,953,150 8 $23,625,200
Pumping Costs $1,597,605 8 $12,780,840
Maintenance & Staff $1,000,000 8 $8,000,000
Net Revenue Pilot Plant $6,833,245 8 $54,665,960
Depreciation of capital equipment $97,236,400 20 $4,861,820
Gross Earnings $49,804,140
Profit tax 30.00% $14,941,242
Net Earnings $34,862,898
Net Earnings Per Share 1,050,000 $33.20
Stock Value (12 X Earnings) $398.43
Cost of Plant, and Annual Revenue of Desal Plant and $100 Stock Value
Plant
Number Acres
Gal Per Acre
/ year Gallons per year Plant Cost
Water Sale /
Year
Stock
Value
1 8,300 860,000 7,138,000,000 $96,236,400 $13,760,000 $398.43
2 16,600 860,000 14,276,000,000 $177,667,200 $27,520,000 $1,389.36
3 43,000 860,000 36,980,000,000 $421,300,000 $13,760,000 $3,898.52
4 62,000 860,000 53,320,000,000 $552,680,000 $72,240,000 $6,514.02
5 83,000 860,000 71,380,000,000 $740.561,000 $137,600,000 $10,182.04
10
crop can be harvested. The waiting is very expensive. It requires any plantation to have millions
of dollars on hand at the beginning.
Few tree planters have that kind of money. There are a few large tree plantation companies,
such as Weyerhaeuser who could afford this. But we cannot base the conversion of Australian
deserts on one or two companies. To solve this problem, we must introduce a unique financing
method not customary in the forestry business: selling stock based on the success of future
harvesting of trees. To explain how this can come about we must explore the surveying of the
desert.
THE ROLE OF THE WESTERN AUSTRALIAN
GOVERNMENT
To start with, the Australian Bureau of Agriculture and Resource Economics (ABARE) can
survey the western deserts to lay out suitable areas for plantations and rural communities.
They will acquire ownership through Compulsory Acquisition. They will make the plantation
tracts available to qualified buyers who:
 Have sufficient funds to pay for 8 years of water and other expenses before they can
harvest the trees
 Are experienced foresters
 Have a good record
 Agree to plant trees that will meet ABARE standards
 Have capital sufficient to pay for water and other expenses for 8 years until the trees
are harvested.
 Sign papers agreeing to the above.
Who can qualify to acquire a plantation?
These requirements are so strict that few Australian firms will be able to, or will want to agree
to them. There will be only two types of firms that will qualify for plantations:
A. Large experienced forestry corporations that have access to millions of dollars of capital or
borrowed money
B. Corporations formed expressly to meet these requirements which combine financial resources
and experienced foresters. For these we will assume that they sell shares of stock to finance their
acquisition of the property.
For the purpose of this study, we will assume that there will be at least one “B” type plantation
that will be set up to acquire a plantation of at least 8,300 acres. The financial picture for such
an 8,300 acre plantation looks like Table 03.
Table 03 Financial Plan for a Pilot Plantation of 8300 acres.
11
As you can see, the return to the investors is very substantial. This plan is based on a long term contract
for water with the desalination plant at $0.002 per gallon and the assumption that after the trees are
grown the lumber will be sold for $512,000,000. As you will see later on, Paulownia trees are very
valuable. Once cut down, the stumps regrow automatically, reaching ten or fifteen feet the first year.
The new tree relies on the extensive root system created in the first eight years. Each investor who paid
$100 will find his share worth $2,058 after eight years. There should be no difficulty in raising capital
with this possible future revenue. The plantation will keep on producing trees year after year.
Table 03 introduces some new features of the plantations. There will be people – workers, families,
businessmen, teachers, policemen, doctors and nurses and children on the plantations. They will live in
houses, and work in stores and offices. They will receive free water, but will have to pay for their homes
and offices and electricity. The Residential and Commercial (R&C) aspects of the plantations are shown
here. The plantation will receive revenue from selling lumber and also from constructing houses and
offices and selling or renting them plus electricity to the plantation residents. From the beginning the
residents of the plantations will have the internet with WIFI.
Not shown here is the electrical power generation plant located on the plantation. This plant will
produce electricity from a generating plant using natural gas derived from a gas pipeline in the same
trench made for the water line from the desalination plant.
Pilot Plantation 8,300 Acres Shares Sold Price Capital Raised
Expenses and Profit from
8,000 Acres forest + 300
Commercial & Residential 1,400,000 $100 $140,000,000
Expense Category Number Rate Years Dollars
Staff (Acres per worker = 200) 40 $50,000 8 $16,000,000
Water 8000 $1,720 8 $110,080,000
Seedlings 8000 $800 1 $6,400,000
Fertilizer 8000 $230 8 $14,720,000
Equipment 8000 $300 8 $19,200,000
Miscellaneous 8000 $100 8 $6,400,000
$50 million Bank Loan @ 7% $50,000,000 7% 8 $28,000,000
Total 8 year costs $181,600,000
Depreciation of Equipment 20 $960,000
Lumber Sales After 8 years 8000 $8,000 8 $512,000,000
Fees residential & Commercial 300 $30,000 8 $72,000,000
Total Revenue $584,000,000
VAT 10% $58,400,000
Earnings after 8 years $343,040,000
Profit Tax 30% $102,912,000
Earnings after Tax $240,128,000
Earnings Per Share $171.52
Value Per Share after 8 years (12 X) $2,058.24
12
Once the pilot plantation has been started, there will be other plantations created which will use the
same fresh water company that supplied the pilot plantation Table 04 shows some projections of the
future plantations supported by the same water company:
Table 04 Projections of future plantations
The electricity will be generated on the plantation using natural gas @ $4.28 per Mcf
Table 05 People assumed living on the pilot plantation
COST OF POWER FOR THE DESALINATION PLANTS
There are many ways of generating the power for desalination plants including coal, oil, wind
and natural gas. We are trying to reduce the carbon footprint of these plants. We would like to
use wind power, but the location may not be suitable for this, so we will assume natural gas
for this analysis.
Assumptions: A metric cubic meter of desalinated water requires 3.2 kWh to produce. A kWh
requires .00798 Mcf (1,000 cubic feet) of natural gas. The cost of natural gas today is $4.28
per Mcf. Putting all these numbers together with the assumed desalination plants proposed
we get these numbers:
Size and revenue from plantations served by the original water company
Acres Forest Per Acre Lumber Sales R&C Revenue
Total 8 yr
Revenue
12X Share
Value
Pilot 8,300 8,000 $8,000 $531,200,000 $72,000,000 $603,200,000 $2,058.24
2nd Plant 16,600 16,000 $8,000 $1,062,400,000 $144,000,000 $1,206,400,000 $6,295.68
3rd Plant 33,200 32,400 $8,000 $2,124,800,000 $192,000,000 $2,316,800,000 $8,310.43
4th Plant 44,000 42,000 $8,000 $2,816,000,000 $480,000,000 $3,296,000,000 $12,046.56
5th Plant 83,000 80,000 $8,000 $5,312,000,000 $720,000,000 $6,032,000,000 $22,094.40
Pilot Plantation
Residents and
Electricity Usage People Households KWH/Year
@ 100 Month
Paid by
Households
Woodsmen 40 30 395,280 $36,000
Wives 100 0 - $0
Children 90 0 - $0
Teachers 12 4 52,704 $4,800
Police & Fire 15 6 79,056 $7,200
Medical 12 6 79,056 $7,200
Commercial 120 70 922,320 $84,000
Roads & Pipelines 10 6 79,056 $7,200
Water Company 4 6 79,056 $7,200
Construction 10 6 79,056 $7,200
TOTAL 413 134 1,765,584 $160,800
13
Table 06 Running Costs of future desalination plants ad $4.28 per mcf
We are assuming that there will be an electrical power plant built at the plantation. This will receive its
power from a natural gas pipe laid along with the pipeline that delivers the water (more later). Sales of
electricity will be another revenue generator for the plantation owners.
What if the cost of natural gas goes up? This will raise the costs of the desalination plant and the
electricity at the plantation. We checked with the US Energy Information Agency. They predict that gas
prices will rise from $4.38 to $5.40 by 2030. At these higher prices, how will this affect the water and the
plantations? We made the assumption that the water company, which is already highly profitable,
would continue to honor its contact to supply water at $0.002 per gallon. On that basis, the higher price
of natural gas would reduce their profits, but keep the plantations supplied with fresh water at the same
price. Why? Because soon everyone will realize that converting the deserts to forests is the name of the
game. If anything keeps the plantations from being profitable, the entire scheme will collapse.
TABLE 07 RUNNING COSTS FOR THE DESALINATION PLANTS AT GAS PRICES OF $5.40
WHO SHOULD PAY WHOM?
What should the plantation owners pay to the government for the use of public desert lands to
make profits? That’s the wrong question. The question should be: What do the Australian
people owe the pioneers who will convert the outback to profitable forests and farmland? If
you look at the situation, the plantation owners will gradually increase the size of usable
Australian land by converting about 80% of the 339 million acres of desert into profitable tax
paying forest and farmland with homes for more than two million people.
The situation is not unlike what happened in the United States from 1849 to 1900. Before 1849
Running Costs for the Desalination Plants 2013 prices $4.28
Acres M3D KWh
MCF Nat
Gas
Daily cost of
Natural Gas Per Year Cost
Pilot 8,300 74,028 236,890 1,890.38 $8,090.82 $2,953,150
2nd Plant 16,600 148,056 473,779 3,780.76 $16,181.64 $5,906,300
3rd Plant 33,200 296,000 947,200 7,558.66 $32,351.05 $11,808,132
4th Plant 44,000 396,000 1,267,200 10,112.26 $43,280.46 $15,797,366
5th Plant 83,000 714,530 2,286,496 18,246.24 $78,093.90 $28,504,273
Running Costs for the Desalination Plants in 2030 prices $5.40
Acres M3D KWh
MCF Nat
Gas
Daily cost of
Natural Gas Per Year Cost
Pilot 8,300 74,028 236,890 1,890.38 $10,208.05 $3,725,937
2nd Plant 16,600 148,056 473,779 3,780.76 $20,416.09 $7,451,874
3rd Plant 33,200 296,000 947,200 7,558.66 $40,816.74 $14,898,111
4th Plant 44,000 396,000 1,267,200 10,112.26 $54,606.18 $19,931,257
5th Plant 83,000 714,530 2,286,496 18,246.24 $98,529.69 $35,963,335
14
most of the land west of the Mississippi –half of the country—was uninhabited land. Most
Easterners didn’t want to live there. Life was hard. There were few towns, and no roads.
Over a period of time the settlers who went west created towns, roads, and farmland. What
was the result of all this hardship and struggle? The opening of the West. The pioneers opened
the land for millions of people who today represent half of the wealth of America; wealth that
would not exist today without the work of these pioneers who opened up the land for the
generations that followed.
What the pioneers in the plantations in the Western deserts will be doing is exactly what the
early pioneers of Australia and the United States did. They will open the land for further
development. Life and wealth will be better for everyone. So, what do we want to charge them
for opening up the west to profitable settlement? Nothing. We want to thank them for doing
future generations a tremendous favor.
The desalination plants and the plantations will pay the standard 10% VAT plus the 30%
corporate profits tax.. Australia will provide desert land which the settlers will convert to highly
profitable forests – at no cost to Australia. Looking at the VAT and profits tax revenue to
Australia from the first 8 years of Desalination and Plantations, the revenue to the government
will be $180,913,094 from the plantation and the desalination plant. That is $180.9 million
from land that is not giving the government a cent today. Looking towards the future, the five
plantations and the desalination plants will provide $5 Billion dollars in tax revenue from
today’s desert property that today pays nothing.
Table 08 VAT revenue from plantations and desalination plants
DESALINATION BY REVERSE OSMOSIS
Osmosis is a natural phenomenon in which a liquid - water, in this case - passes through a semi-
permeable membrane from a relatively dilute solution toward a more concentrated solution.
# VAT and Profits Tax Over 40 Years From Desalination and Plantations
Year Desal VAT Desal Profit Plantation VAT
Plantation
Profit Total
1 8 $4,128,000 $15,473,094 $58,400,000 $102,912,000 $180,913,094
2 16 $4,128,000 $46,607,760 $116,800,000 $314,784,000 $482,319,760
3 24 $9,700,800 $124,331,443 $226,560,000 $415,521,600 $776,113,843
4 32 $135,398,400 $244,953,713 $316,800,000 $602,328,000 $1,299,480,113
5 40 $245,478,400 $410,346,988 $584,000,000 $1,104,720,000 $2,344,545,388
Total $398,833,600 $841,712,999 $1,302,560,000 $2,540,265,600 $5,083,372,199
15
This flow produces a measurable pressure, called osmotic pressure. If pressure is applied to the
more concentrated solution, and if that pressure exceeds the osmotic pressure, water flows
through the membrane in the opposite direction -- from the more concentrated solution
toward the dilute solution. This process, called reverse osmosis, or RO, removes up to 98% of
dissolved minerals, and virtually 100% of colloidal and suspended matter. RO produces high
quality water at low cost compared to other purifications processes.
Figure 06 Reverse Osmosis
The membrane must be physically strong to stand up to high osmotic pressure - in the case of sea water,
2500 kg/m. Most membranes are made of cellulose acetate or polyamid composites cast into a thin film,
either as a sheet or fine hollow fibers. The membrane is constructed into a cartridge called a reverse
osmosis module.
Figure 07 Reverse Osmosis Module
The incoming sea water is filtered to remove suspended particles and then pressurized with a pump to
about 300 psi. This exceeds the water’s osmotic pressure. The high pressure water forces itself through
the module leaving dissolved salts and other water contaminates behind. These impurities are drained
and returned to the ocean using carefully controlled paths to avoid contaminating the ocean for the sea
life living there.
The system proposed for Australia is universal throughout the world. All reverse osmosis systems work
the same way. Under pressure, seawater is forced through a semi-permeable membrane that lets the
water flow through and keeps the salt and other impurities from getting through.
Desalinating seawater involves some processes that could impact marine life. However, those impacts
can be avoided or minimized by implementing environmental safeguards at every phase of the project
from planning its location to operating it in a manner that results in acceptable water quality and brine
loading at the discharge. For example, intake of seawater can entrain marine life, but screens placed at
intake locations at power plants and industrial facilities have successfully demonstrated that this type of
impact can be significantly reduced.
16
Figure 08 Desalination Plant in Perth Australia
The cost of a desalination plant depends on the amount of water output that you need. To start the
Australian project we will begin with a small pilot plant that costs $96 million dollars and produces 19
million gallons of water per day – enough for 8300 acres.
Figure 09 Cost calculator for desalination plants (Credit DesalData.com)
LAYING THE PIPELINE FOR WATER DELIVERY
The desalination plants must be close to the ocean. The plantations must be in the desert.
17
They are not necessarily close to each other. A typical plantation will be from 40 to 80 miles
from the shore. In with the water pipeline will be a natural gas pipeline. The natural gas will be
used to provide electricity for the residents and businesses in the plantation.
A private contractor will build the pipelines. The 40 mile route may pass through areas of sand
and rock. A trenching machine built by Trencor of Texas could be used. This machine is powered
by two diesel engines and weighs over 200 tons. It cuts a 2 meter wide trench into the sand or
rock using a chain-driven belt armed with a series of hardened steel teeth. This method avoids
the use of explosives. The trench formed has a neat vertical edge. The spoil produced is already
pulverized to small fines and laid in a bank along the side of the trench making it ideal for
backfilling the trench and burying the pipeline. It is possible to achieve a half mile a day from the
one machine.
Figure 11 Desalination Plant and Pipeline
Figure 22 Desal plant and pipeline
In the trench, the pipeline lies on a bed of backfilled padding material covered to a depth of
600mm. A berm of granular caliche standing a meter above the surface will run along the entire
length of the line to add further protection and identify its position.
The water pipe should be 900 mm. Flow velocity 1.5 meters/sec. The pump efficiency 85%. The
pumping cost $4,377 per day. Source: Ben Makabret Ben@Ada-Tech.com.
There will be unmanned valve stations along the route to isolate the line into segments.
Monitoring and control using solar powered valve stations can be achieved using fiber optic
cable laid along the length of the pipeline in its own buried conduit to provide communications
for the water control system.
The line will be subdivided at the plantation to provide service to various forest owners with
water meters with electronic accounting of the use of water by each user. In the trench would
.
18
also be a natural gas pipeline to enable the plantation to generate electric service for the
plantation and its residents and commercial properties.
Table 09 Pumping Costs for Water
WHY THE DESERTS?
Why create tree plantations in the Australian deserts? Clearly there are drawbacks to planting
trees there. There is not enough water, requiring expensive desalination plants. If you plant
trees elsewhere nature will provide the water through rainfall at no cost. There are very few
people currently in the deserts. Currently mining companies have to fly workers in week by
week since families do not want to live in arid desert areas. However, there are good reasons
for opening up the desert areas for tree plantations.
1) The land, today, except for the mining areas and national parks, is basically unused. It is
a major part of Australia that could provide billions of dollars of revenue and very
desirable places to live.
2) The land would be, basically, free. Anywhere else in Australia the land will be more
expensive to purchase.
3) While there is little water, there is lots of sun which is needed for trees.
4) Looking towards the future, opening up the desert can convert Australia into a major
economic and environmental power in the world. It is like acquiring a whole new
country of 529,000 square miles -- a country bigger than France, Spain, Sweden,
Germany, Finland, Norway, Poland, Italy, New Zealand, United Kingdom, Hungary,
Portugal and Austria or 100 others.
Figure 12 Great Sandy Desert before and after the pilot plantation
Plant Number Acres Gallons Used Pumping Cost
Pilot 8,300 7,138,000,000 $1,597,605
2nd Plant 16,600 14,276,000,000 $3,195,210
3rd Plant 33,200 28,552,000,000 $6,390,420
4th Plant 44,000 37,840,000,000 $8,469,231
5th Plant 83,000 71,380,000,000 $15,976,050
Total 185,100 159,186,000,000 $35,628,516
19
HOW THE TOWNS SHOULD INTERFACE WITH THE
FORESTS
As already noted, for the plantations to be a success, we have to make them attractive to people. We
want thousands of people to migrate there. To make this happen, we have to design the plantations to
be attractive places to live. One method is to integrate the towns with the forests. Here is an illustration
of the way this can be done:
Figure 13 Integration of Forests and Towns
The profits from the desalination plants will occur only if the plantations are successful in
20
growing trees and selling the lumber. As a result of the profits from the desalination plants, two
things will undoubtedly happen in Australia:
First: Other plantations and desalination plants will be started elsewhere. The deserts are vast.
There is plenty of room for more plantations.
Second: The residents of the plantations may produce other industries besides growing and
selling timber. We cannot predict what they will be, but experience in the world shows that
when young settlers arrive in a new area they develop new and unexpected industries. The
plantations may become the Silicon Valleys of Australia, or the Research Triangles.
What will these forests do for Australia? The people investing in the plantations and
desalination plants will generate and gain wealth. In terms of tax revenue, the VAT could
generate billions of dollars per year. But the most exciting thing is that the plantations would
provide jobs and great places to live for 2 million or more people. Once these plantations get
started, they would provide a spirit of adventure for the average Australian similar to the spirit
that activated Americans once gold was discovered in California. “Go west, young man” cried
Horace Greeley in 1865, and millions did. “Go west, young man” will be the headlines in the
Sydney papers and television stations. If you don’t like your job, you can shove it, go west and
make more.
WHY PAULOWNIA TREES?
There are many types of tree that might thrive in the deserts of Australia. We suggest
Paulownia for several reasons. They include rapid growth that in just one year attains a height
of 10-18 feet and within 6-10 years become a fully grown shade tree that would normally take
over 20 years to fully mature. Paulownia Trees have high carbon absorbing rate at 48 lbs. per
tree, or 13 tons of CO2 in each acre per year. When you cut down any of these fast growing
trees, they are able to regenerate from the stump very fast, resuming growth immediately.
Other benefits include, fire resistance at 477 degrees Celsius flash point. They take less years to
harvest and do not twist or crack.
Paulownia is about 2/3 the weight of the lightest commercial wood grown in the US. It weighs
an average of 14 to 19 lbs. per cubic foot. Paulownia is about 1/3 the weight of Oak (44 lbs.
p/cubic ft) and half the weight of Pine (30 lbs. p/cubic ft).
Paulownia has one of the highest strength to weight ratios of any wood. The strength modus of
rupture MOR (psi) of Paulownia is 5740. Paulownia holds nails and screws well and does not
require pilot holes to be drilled. Both yellow poplar and white pine split before Paulownia does.
Flat head screws can be driven flush with the surface. Plantation grown Paulownia is mostly
knot free, making it very consistent.
Paulownia has been widely used in the orient for fine furniture, musical instruments, carvings
and decorative finishes for over 1000 years. It can be peeled for veneer in 1/16 inch thickness
and has been sliced at 1/32 inch.
Intricate patterns can be cut with a jig saw or band saw without splitting. Paulownia has been
used by carvers in the US. Furniture, doors and windows can be made with close tolerances. All
21
normal finishing materials can be applied and it bonds well with glue.
Air-drying takes as little as 30 days. Boards can be kiln dried at high temperatures in as little as
24 hours to 10% to 12% moisture content with no warping. Reported shrinkage from green to
oven-dry is only 2.2% radial and 4.0% tangential.
Paulownia remains stable during changes in humidity and experiences little shrinkage or
expansion compared to most other woods. It is highly durable and resists decay under non-
ground contact conditions. The wood is insect resistant.
Paulownia is a very good insulator. Paulownia log homes are said to have twice the R factor as
pine or oak logs. This temperature resistance serves to give the wood a high fire resistance.
Ignition temperature is approximately 400 deg. C. which is almost twice many conventional
American hard and soft woods.
Paulownia has a light blond appearance and resembles White Ash. It stains well with a variety
of colors and can be made to mimic other woods. Once planed a silky luster is revealed. The
feel is also very silky.
Source: http://www.paulowniasupply.com/paulownia_lumber_characteristics.htm
Figure 14 Eight Year Old Paulownia tree
22
REVENUE PER ACRE FROM PAULOWNIA TREES
There are no definitive answers to the yield, since Paulownia trees are grown all over the
world, including Australia, and sold in varying markets. For this report we are assuming that
Paulownias are planted 200 trees to the acre and harvested every eight years and sold at the
best price possible, which we are assuming at $64,000 for an acre of trees which works out to
$8,000 per acre per year. Here are some figures from around the world:
California: It is estimated that for each acre of Paulownia trees planted an average yield of
30,000 board feet of lumber can be expected every 7-10 years. With an average price of $3.00
per board foot, the estimated return on 1 acre of Paulownia trees is $90,000 every 7-10 years.
http://www.primevalgardens.com/Environment.html
California: The tree can be harvested in five years at 45-50 feet in height yielding a gross profit
of about $30,000 per acre per year.
http://paulowniamp.files.wordpress.com/2010/05/california-paulownia.pdf
Lebanon: Zard said 250 acres can produce 50,000 trees, worth $15 million-$25 million after 10
years "and the beauty of it is when cut down those trees they simply grow back again (no need
to replant) at a faster rate this time because the roots are already well established."
http://www.upi.com/Top_News/Analysis/Outside-View/2013/02/12/Outside-View-Restoring-
Lebanon-to-the-forest-business/UPI-84611360645380/#ixzz2S9zj0gYo
Tennessee: What about timber price? Growers report that Paulownia stumpage prices in 2004 were
running from $2 to $10 per board-foot. The Smith’s estimate is a conservative $2 to $3 per
board-foot, or a return of $12,000 to $18,000 per acre for the 35-year rotation.
https://utextension.tennessee.edu/publications/Documents/PB1465.pdf
UK: - The Empress's growth rate has an expected average yield of 30,000 board feet of saw
timber per acre every 7-10 years. The Empress (Paulownia) also provides valuable spindle poles,
cuttings, and cultures exponentially increasing harvests during its growth cycles. At $3.00 per
board foot, 30,000 board feet would equal $90,000 of cash value every 7-10 years per acre.
http://ecosustainablevillage.com.ip01-web23.net/fast_growing_trees.htm
Based on these reports, we have estimated the revenue for the Australian plantations at $8,000 per
acre per year which is lower than any of the estimates that we can find.
THE WORLD MARKET FOR AUSTRALIAN LUMBER
Lumber is actively traded throughout the world. The drivers: China’s demand for high-grade logs used to
make dimensional lumber, and the EU/U.S. push for biomass power (wood chips and wood pellets,
made from lower-grade round wood and waste wood, for residential, commercial, and industrial
23
applications, including space heating, electricity generation, and co-firing with coal in coal-fired power
plants).
Already, 60% of the logs that are produced in the world go to China. A major exporter is neighboring
Russia–specifically, Siberia, home to the world’s largest forest, for the time being. It is slated for
extinction in 20-30 years because of illegal logging–about a third of all logs exported to China are cut
illegally–which is controlled by Russian organized crime.
Demand for wood from certified sustainable sources will increase dramatically over the next two-to-
three years, analysts say. That rules out most African and South American suppliers, which means that
wood from Canada and the United States will rise in value. An upturn in the hard-hit North American
dimensional lumber markets will further drive demand for wood.
Figure 15 Major suppliers of love to China Source: http://news.mongabay.com/2011/0505-
china_wood_imports.html
According to the FAO, demand for forest products will continue to grow as world population
and incomes grow. The most recent FAO projections estimate that by 2030 global consumption
of industrial round wood will rise by 60 percent over current levels, to around 2 400 million m3.
Substantial rises are also likely in the consumption of paper and paperboard products.
Will the world’s forest resources be able to cope? Until the early 1990s, expert assessments
were pessimistic, but most experts today no longer foresee a crisis in the supply of wood.
Projections of wood consumption are lower now, partly because of lower world population
growth. In addition, there have been improvements in forest management and in harvesting
and processing technologies, increases in plantation establishment, and an expansion of the
role of trees outside forests.
Figure 16 Value of logs and timber imports into China. Source: http://news.mongabay.com/2011/0505-
china_wood_imports.html
24
For the next decade it is clear that there will be a growing market for Australian lumber in China, at
least. Prices will not fall as demand increases.
Changes in the conditions of trade are unlikely to be dramatic, as most significant tariff barriers
have already been reduced to moderate levels or completely removed – though eco-labeling
and environmental regulations will doubtless increase. However, there will be major shifts in
the directions of international trade, as developing countries increase their per capita
consumption of industrial wood. In some of the richer countries, per capita consumption is
currently at least tenfold that of many developing countries.
AUSTRALIA’S NEED FOR INCREASED WOOD
PRODUCTION
Australia’s business community and government have long recognized the need to increase
production of wood and wood products. In 2010 the Victorian Association of Forest Industries
issued a 10 point development plan. The association noted:
“Australia is facing shortages of wood for domestic use, particularly a deficit in saw logs.
Without increased domestic production, and with a growing population, this shortage will have
to be met from imports, potentially increasing the current $2.1 billion trade deficit in wood
products.
“The Australia trade deficit in wood products is largely caused by paper and paper product
imports. Future shortages of domestic wood supply appear inevitable, particularly for sawn
timber products. Most new plantation activity has been aimed at pulpwood (woodchip)
production. Like agricultural commodities, woodchips provide valuable export income, regional
employment and investment, but more long-rotation saw log investment is needed to meet
domestic demand.”
Figure 17 Demand and Supply of Wood in Australia (Source: Victorian Association of Forest Industrles)
25
HOW THE DESERT CAN BE CONVERTED TO FOREST
For many years, Australia has wanted to have a greater domestic source of lumber. Legislation
was passed to encourage domestic wood production. In addition, Australia has been in the
forefront of those nations who want to help preserve the future of the planet by reducing the
increase in CO2 in the atmosphere. This project of converting the deserts of Australia into
productive forests meets most of Australian timber and environmental goals.
The first step would be for Australia to pass legislation stating a national goal of making
productive use of desert land with four objectives:
a. Increasing the amount of domestically produced marketable timber.
b. Assisting in reducing the level of CO2 in the atmosphere.
c. Providing jobs for millions of Australian citizens
d. Increasing the GDP of Australia through planting trees and selling lumber in ways that
do not require increased government spending.
Once this legislation is passed, the second step would be to conduct a land survey of the
Western Australian Deserts with the goals of:
1) Determining where forests could be created in the deserts.
2) Dividing the land into manageable plantations for forest communities.
3) Determining where the desalination plants for each tract should be located.
4) Determining where the roads and pipelines should be located for maximum efficiency.
5) Publishing reports for the public providing all this information in detail.
6) Using Compulsory Acquisition to take title to all the desert land that can be converted
into forests so that it can be sold or leased to tree plantations.
7) Setting up a branch of the Western Australian government whose mission is to get the
26
deserts converted into profitable forests by selling or leasing the desert land to private
plantations that have the resources and ability and commit themselves to make
productive use of the land. This government agency will insure that those who buy or
lease the land will achieve specified goals of planting, maintenance, and harvesting
timber.
The process will take decades. But they will be exciting decades with profits for those
who build plantations and desalination plants and healthy forest living for millions.
DECISIONS TO BE MADE
Review of the information in this paper makes it clear that:
1) Australia can convert its massive deserts into profitable forests at no cost to the government.
2) The conversion will be very profitable for Australia and open up 559 square miles of highly
desirable places for millions to live and work.
3) The conversions will eventually double the national income of Australia.
4) There is a current and future demand for the wood from Australia’s forests.
5) The conversion will provide worldwide benefits by capturing billions of tons of CO2 in lumber –
thus solving a worldwide atmospheric problem that would otherwise be a burden on future
generations.
6) This solution does not require new technology. Desalination is well developed and in wide use
worldwide. Modern methods of tree planting and harvesting require no new techniques.
7) The time to act is now: survey the deserts, determine where the plantations and desalination
plants should be built, acquire the property through Compulsory Acquisition and lease or sell it
to responsible plantations.
8) Needed is government support, and voluntary actions by responsible investors in desalination
and plantations.
APPENDIX
HOW THIS PAPER CAME TO BE WRITTEN
My original idea was to create a partial solution to the climate change problem. From my research it
became obvious that almost all of the writers on the subject were researchers paid by government
grants who conceived their solutions to CO2 buildup as a problem that had to be solved by
governmental action. In general, they proposed one or both of two methods: Cap and Trade, or Carbon
Dioxide Capture and Sequestration. Both methods involve regulations, legislation and high costs to be
incurred by businesses which were to be passed on to consumers. These costs would reduce the
national income and the level of living of the people of the areas where these expensive solutions were
mandated by government laws and regulations. From my research I was convinced that a partial
27
solution to the problem would be extensive planting of trees – particularly in new areas (such as
deserts) where there are no trees today. Rather than having governments spend money planting trees
(at the expense of taxpayers), I thought that private persons planting the trees and selling the lumber
from trees could be profitable. That being so, the government would not have to spend any money at
all. Instead governments could make it easy for and encourage private individuals to plant the trees,
and sell the lumber at a profit - paying taxes to the government from their profits. To make sure that
the tree plantations met the CO2 sequestration objectives, the government would have to play a role in
the process: maintaining law and order, deciding where the trees would be planted, where the water
would come from and how the water could be produced.
I first focused on the Sahara Desert – the largest in the world. After research, I concluded that the
present political situation in the many countries of the Sahara is such that creating desalination plants
and planting trees there would not be a success. In general, law and order does not prevail in these
areas today. Investors would not be willing to invest in an area where they could not be sure that the
trees would not be chopped down for firewood, or that the water and pipelines would not be stolen.
Australia, on the other hand, would be ideal for such a project. Law and order prevails. The government
is concerned about climate change, and would be likely to encourage private investment to create
forests in the desert. That does not mean that getting this project underway will be easy. Many people
will be concerned at the creation of desalination plants designed to water trees – rather than to feed
people. But the environmental benefits will appeal to many Australians. The profits to be gained will
also appeal to those who look for a bright economic future for Australia.
ENVIRONMENTAL IMPLICATIONS OF THE FORESTS
There is no question that the level of carbon dioxide in the world atmosphere is growing and will
continue to grow. The levels of CO2 reported by the Mauna Loa observatory in Hawaii grew from 315
molecules of CO2 per million in 1960 to 396 today – a growth of more than 25% in the last 80 years.
Figure 18 CO2 in the atmosphere
28
The world’s air is 78% Nitrogen and 21% Oxygen with tiny amounts of other gasses -- only 0.039% is
CO2. Why is that a problem? Scientists say it is a problem because CO2 is a “greenhouse gas” meaning
that it traps heat from the sun which is being reflected back into space (just as the glass in a greenhouse
keeps the heat from escaping). The greenhouse gasses are water vapor, carbon dioxide, methane,
nitrous oxide, and ozone. They all trap some of the escaping heat. This is good. Without them the
temperature of the earth might be -19 C degrees instead of what it is now -- an average +14 C degrees
today.
Water vapor is the most powerful of all the greenhouse gasses. It has the most control over the
temperature of the earth. When it gets hot, more water evaporates (mainly from the huge oceans)
leading to clouds. Clouds block the rays of the sun and can lead to rain, and snow. Through this method
water vapor has kept the earth at a livable temperature for millions of years.
The CO2 buildup recently is worth worrying about. The way the atmosphere works, when coal, oil or
natural gas is burned, CO2 is released. It does not matter if the burning takes place in China or Italy, the
CO2 quickly affects everyone’s atmosphere including Australia. For this reason, many nations including
the US and Australia have taken steps to reduce the CO2 put into the atmosphere. The main methods of
CO2 reduction have been Cap and Trade and Carbon Capture and Storage (CSS).
As discussed later in this paper, both of these methods are expensive. Billions of dollars has been spent
and will continue to be spent in the attempt to reduce the amount of CO2 in the atmosphere using
these two methods. In spite of all the spending, the level of CO2 in the atmosphere continues to rise and
will keep rising. Why? Because the burning of coal, oil and natural gas has become essential to
maintaining and increasing our modern way of life: electricity, transportation, heating and air
conditioning. Chinese want automobiles and electricity. Indians do too. Almost everyone wants the type
of lifestyle that Australians and Americans have. Cap and Trade and CSS in Australia and Europe will
reduce the amount of CO2 that these areas add to the atmosphere, but will never compensate for the
CO2 that will come from China, India and the rest of the world.
There is one thing that can make a difference: Forests in Australia. Every acre of Paulownia trees grown
there will capture 13 tons of CO2 every year and turn it into lumber. Eventually, when 80% of the
Australian desert is converted to forests some time later in this century, four billion tons of CO2 per year
will be captured from the atmosphere and converted into permanent wood products. The really great
thing about this method of solving the CO2 problem is that it will be profitable! No government will
have to spend any money. No industry will have to convert to more expensive methods of producing
electricity or products to reduce the CO2 emissions. The nightmare of CO2 regulations will be over.
THE WRONG WAY TO PLANT TREES IN THE DESERT
An article in Climate Change (August 2009) by Leonard Ornstein, Igor Aleinov, and David
Rind was entitled: “Irrigated afforestation of the Sahara and Australian Outback to end
global warming”. They began the article by stating that: ”Each year, irrigated Saharan- and
Australian-desert forests could sequester amounts of atmospheric CO2 at least equal to that
from burning fossil fuels.”
How will this be paid for? They suggested adding about $1 to the per-gallon pump-price to
29
cover the irrigation costs from using reverse osmosis (RO), desalinated, sea water. They
suggested that this technology “was economically competitive with the currently favored,
untested, power-plant Carbon Capture (and deep underground, or under-ocean) Sequestration
(CCS).”
The bulk of their article concerns wind and weather flows around the world. They did not deal
with the political and economic problems: how do you get the nations of the world to add $1
to the pump price of their gasoline and contribute the revenue to a multi-national body that
would be producing the fresh water and planting the trees in Africa and Australia. They
explained the gasoline tax as being practical because, “The capital costs of the forests will
exceed the revenues from any reasonable carbon tax and traded carbon credits. And in the
Sahara, the necessary foreign capital-windfall would be spread across eight to nine
underdeveloped nations. The political distribution will be difficult. Even for an Australian
forest, the conflicts between concerned interests (indigenous residents, ranchers, farmers,
conservationists, foreign investors, etc.) may be substantial.”
Like most climate change enthusiasts, they assumed that their solution would be implemented using
taxes and government spending by developed nations. Missing from the article:
 The political problems of building forests in a dozen different countries where law and
order may not be sufficient to protect the trees, desalination plants, pipelines and
water.
 Any consideration of the possibility that the project might be conducted as a privately
financed profit making enterprise, under which there would be no need for increased
gasoline taxes or any taxes at all.
They concluded that: “Such multi-trillion-dollar projects provide lots of motivation for
scientifically creative entrepreneurs—as well as for swindlers. International mechanisms for
monitoring and managing (without mangling or strangling) such projects will be essential. This
may be the most difficult hurdle…. These capital costs of mitigation will be borne mainly by the
citizens of the developed world. They must be weighed, not only against those of CCS, but as a
kind of preemptive disaster relief – or repair of the ‘commons’—to avoid the future, and as yet
not easily estimated costs of vast coastal inundations, desertification of crop- and range-lands,
drying up of water supplies; more intense tropical storms; the acidification of the oceans and
loss of biodiversity. The integrated costs of coping with such changes could approach those of
recovery following an asteroid impact or a nuclear war.
“These are ecumenical, ethical, altruistic issues. How we deal with them depends upon how
much value ordinary people (not economists or politicians) place on the welfare of their
descendants; self versus children, grand-children, etc. The results of economic and policy
calculations are meaningless unless we agree upon the magnitude to assign to this value.”
The type of reasoning in this article is in the mainstream of the “Climate Change” community.
For many years they have been funded by major government grants. Their solutions all require
increased government regulations, taxes and spending. Their proposals assume that any
solution will be carried out and paid for by the developed nations operating from a sense of
guilt that they are rich and the other nations are poor.
30
In the US the GAO reported in 2011 that annual federal climate spending has increased from
$4.6 billion in 2003 to $8.8 billion in 2010, amounting to $106.7 billion over that period. The
money was spent for:
1) Technology to reduce greenhouse gas emissions,
2) Science to understand climate changes,
3) International assistance for developing countries, and
4) Wildlife adaptation to respond to actual or expected changes.
The EPA is issuing new regulations based on the agency’s Endangerment Finding proclaiming
CO2 to be a pollutant. The Small Business Administration estimates that compliance with these
regulations will cost the U.S. economy more than $1.75 trillion per year — about 12%-14% of
GDP.
In April of 2013 the World Economic Forum announced that the world must spend an extra
$700 billion a year to curb its addiction to fossil fuels. The Green Growth Action Alliance, which
compiled the study on behalf of the WEF, said the extra spending was needed to promote other
forms of energy generation and greater efficiency in sectors including building, industry and
transport.
CONCLUSIONS ON CARBON DIOXIDE SPENDING
All over the world, developed nations are being pushed into spending billions of dollars on cap and trade
and carbon dioxide capture and storage. All these efforts are based on one central idea: there is a
worldwide problem. The underdeveloped world is not able to deal with it. We are all living in the same
world with the same atmosphere. Therefore it is considered incumbent on the developed world like the
US, Europe, Japan and Australia to spend billions on a futile effort to reduce the use of fossil fuels or to
capture and store CO2 in some way. Nations that do this will double their cost of electricity, and the
cost of making most products. They will reduce their citizen’s level of living. They will build up huge
taxes and huge debts. But, realistically, this is not necessary. There is a better way – a way that does not
cost billions of dollars. It creates billions of dollars in revenue. Australia can lead the way.
Australia can show the world that by converting deserts to forests, billions of tons of CO2 can be
absorbed from the world atmosphere, and converted into solid lumber which – if it is not burned – will
reduce the CO2 in everyone’s atmosphere – and make a huge profit!
So, there are three reasons for converting the deserts to forests: 1) Help to solve the world CO2
problem. 2) Improve Australia’s national income. 3) Give Australians a whole new country to live in and
enjoy.
WILL THE SAHARA NATIONS ADOPT FORESTATION?
As already noted, a similar conversion of deserts to forests is impossible in the Sahara today. Since the
“Arab Spring” most of the nations of the Sahara have new governments that are unable, at present, to
31
control their people and territory sufficiently to create an environment which would encourage foreign
investment. This situation may not last forever. Once Australia has shown the way, the world will take
notice of the tremendous profits that can come from desalination and plantations. It will take Australia
decades to complete the job. During those decades it is certainly possible that the political problems in
one or more of these countries may be resolved so that they can emulate the Australian example. Just
as Turkey, Saudi Arabia and the Gulf states have become responsible stewards of private investment, it
is possible that in the decades to come one or more of Algeria, Chad, Egypt, Libya, Mali, Mauritania ,
Morocco, Niger, Sudan, or Tunisia may emerge as stable, democratic nations which welcome, encourage
and support private enterprise. If and when this happens, the world C02 crisis may be ended forever at
no cost to anyone, and profits for all.
FINANCIAL TABLES FOR PLANTATIONS
Table 10 2nd
Plantation financial plan
2nd Plantation 16,600 Acres Shares Sold Price Capital Raised
Expenses and Profit from
16000 Acres 1,400,000 $100 $140,000,000
Expense Category Number Rate Years Dollars
Staff (Acres per worker = 200) 80 $50,000 8 $32,000,000
Water 16000 $1,720 8 $220,160,000
Seedlings 16000 $800 1 $12,800,000
Fertilizer 16000 $230 8 $29,440,000
Equipment 16000 $300 8 $38,400,000
Miscellaneous 16000 $100 8 $12,800,000
$50 million Bank Loan @ 7% $50,000,000 7% 8 $28,000,000
Total 8 year costs $335,200,000
Depreciation of Equipment 20 $1,920,000
Lumber Sales After 8 years 16000 $8,000 8 $1,024,000,000
Fees residential & Commercial 600 $30,000 8 $144,000,000
Total Revenue $1,168,000,000
VAT 10% $116,800,000
Earnings after 8 years $1,049,280,000
Profit Tax 30% $314,784,000
Net Earnings After Tax $734,496,000
Earnings Per Share $524.64
Value Per Share after 8 years (12 X) $6,295.68
32
Table 11 3rd
Plantation Financial Plan
Table 12 4th
Plantation Financial Plan
3rd Plantation 33,200 Acres Shares Sold Price Capital Raised
Expenses and Profit from
32,400 Acres 1,400,000 $100 $140,000,000
Expense Category Number Rate Years Dollars
Staff (Acres per worker = 200) 162 $50,000 8 $64,800,000
Water 32,400 $1,720 8 $445,824,000
Seedlings 32,400 $800 1 $25,920,000
Fertilizer 32,400 $230 8 $59,616,000
Equipment 32,400 $300 8 $77,760,000
Miscellaneous 32,400 $100 8 $25,920,000
$50 million Bank Loan @ 7% $50,000,000 7% 8 $28,000,000
Total 8 year costs $650,080,000
Depreciation of Equipment 20 $3,888,000
Lumber Sales After 8 years 32,400 $8,000 8 $2,073,600,000
Fees residential & Commercial 800 $30,000 8 $192,000,000
Total Revenue $2,265,600,000
VAT 10% $226,560,000
Earnings after 8 years $1,385,072,000
Profit Tax 30% $415,521,600
Earnings After Tax $969,550,400
Earnings Per Share $692.54
Value Per Share after 8 years (12 X) $8,310.43
33
Table 13 5th
Plantation Financial Plan
4th Plantation 44,000 Acres Shares Sold Price Capital Raised
Expenses and Profit from
42,000 Acres 1,400,000 $100 $140,000,000
Expense Category Number Rate Years Dollars
Staff (Acres per worker = 200) 220 $50,000 8 $88,000,000
Water 42,000 $1,720 8 $577,920,000
Seedlings 42,000 $800 1 $33,600,000
Fertilizer 42,000 $230 8 $77,280,000
Equipment 42,000 $300 8 $100,800,000
Miscellaneous 42,000 $100 8 $33,600,000
$50 million Bank Loan @ 7% $50,000,000 7% 8 $28,000,000
Total 8 year costs $838,400,000
Depreciation of Equipment 20 $5,040,000
Lumber Sales After 8 years 42,000 $8,000 8 $2,688,000,000
Fees residential & Commercial 2000 $30,000 8 $480,000,000
Total Revenue $3,168,000,000
VAT 10% $316,800,000
Earnings after 8 years $2,007,760,000
Profit Tax 30% $602,328,000
Earnings after Tax $1,405,432,000
Earnings Per Share $1,003.88
Value Per Share after 8 years (12 X) $12,046.56
34
FINANCIAL TABLES FOR DESALINATION PLANTS
Note: At the beginning, there will be one water company that builds five increasingly large plants using the same
original capital over a period of 40 to 50 years. The water company will have lasting contracts to supply water to
plantations of increasing size which are constructed to use this water.
Table 14 2nd
Desalination Plant Financial Plan
5th Plantation 83,000 Acres Shares Sold Price Capital Raised
Expenses and Profit from
83,000 Acres 1,400,000 $100 $140,000,000
Expense Category Number Rate Years Dollars
Staff (Acres per worker = 200) 400 $50,000 8 $160,000,000
Water 80,000 $1,720 8 $1,100,800,000
Seedlings 80,000 $800 1 $64,000,000
Fertilizer 80,000 $230 8 $147,200,000
Equipment 80,000 $300 8 $192,000,000
Miscellaneous 80,000 $100 8 $64,000,000
$50 million Bank Loan @ 7% $50,000,000 7% 8 $28,000,000
Total 8 year costs $1,564,000,000
Depreciation of Equipment 20 $9,600,000
Lumber Sales After 8 years 80,000 $8,000 8 $5,120,000,000
Fees residential & Commercial 3000 $30,000 8 $720,000,000
Total Revenue $5,840,000,000
VAT 10% $584,000,000
Earnings after 8 years $3,682,400,000
Profit Tax 30% $1,104,720,000
Earnings after Tax $2,577,680,000
Earnings Per Share $1,841.20
Value Per Share after 8 years (12 X) $22,094.40
35
Table14 3rd
Desalination Plant Financial Plan
2 Second Desal Plant 8 year results Supports: 16,600 Acres
Costs Each/Per Year Years Cost/Revenue
Business Loan $100,000,000 @ 6% $6,000,000 8 $48,000,000
Cost to Build Plant + Pipelines $327,600,000 1 $327,600,000
Water Sales Pilot $13,760,000 8 $110,080,000
Water Sales 2nd Plant $27,520,000 8 $220,160,000
VAT $41,280,000 10.00% $4,128,000
Running Costs $5,906,300 8 $47,250,400
Pumping Costs $3,195,210 8 $25,561,680
Maintenance & Staff $2,000,000 8 $16,000,000
Net Revenue 2nd Plant $19,613,700 8 $127,219,920
Net Revenue Pilot Plant $13,760,000 8 $62,829,600
Depreciation of capital equipment $327,600,000 20 $16,380,000
Gross Earnings $173,669,520
Profit Tax 30.00% $52,100,856
Net Earnings $121,568,664
Earnings per share 1,050,000 $116
Stock Value (12 X Earnings) $1,389.36
3 Third Desal Plant 8 year results Supports: 43,000 Acres
Costs Each/Per Year Years Cost/Revenue
Business Loan $200,000,000 @ 6% $12,000,000 8 $96,000,000
Cost to Build Plant + Pipelines $325,600,000 1 $325,600,000
Water Sales Pilot $13,760,000 8 $110,080,000
Water Sales 2nd Plant $27,520,000 8 $220,160,000
Water Sales 3rd Plant $55,728,000 8 $445,824,000
VAT $97,008,000 10.00% $9,700,800
Running Costs $11,808,132 8 $94,465,056
Pumping Costs $6,390,420 8 $51,123,360
Maintenance & Staff $3,500,000 8 $28,000,000
Net Revenue 3rd Plant $40,419,868 8 $300,235,584
Net Revenue 2nd Plant $19,613,700 8 $156,909,600
Net Revenue from pilot plant $13,760,000 8 $62,829,600
Depreciation of capital equipment $653,200,000 20 $32,660,000
Gross Earnings $487,314,784
Profit Tax 30.00% $146,194,435
Net Earnings $341,120,349
Earnings per share 1,050,000 $325
Stock Value (12 X Earnings) $3,898.52
36
Table 15 4th
Desalination Financial Plan
Table 16 5th
Desalination Financial Plan
4 Fourth Desal Plant 8 year results Supports: 42,000 Acres
Costs Each/Per Year Years Cost/Revenue
Business Loan $200,000,000 @ 5% $12,000,000 8 $96,000,000
Cost to Build Plant + Pipelines $401,000,000 1 $401,000,000
Water Sales Pilot $13,760,000 8 $110,080,000
Water Sales 2nd Plant $27,520,000 8 $220,160,000
Water Sales 3rd Plant $55,728,000 8 $445,824,000
Water Sales 4th Plant $72,240,000 8 $577,920,000
VAT $1,353,984,000 10% $135,398,400
Running Costs $15,797,366 8 $126,378,928
Pumping Cost $8,469,231 8 $67,753,851
Maintenance and Staff $4,600,000 8 $36,800,000
Net Revenue 4th Plant $346,987,221
Net Revenue 3rd Plant $300,235,584
Net Revenue 2nd Plant $156,909,600
Net Revenue from pilot plant $62,829,600
Depreciation of capital equipment $1,054,200,000 20 $52,710,000
Gross Earnings $814,252,005
Profit Tax 30.00% $244,275,602
Net Earnings $569,976,404
Earnings per share 1,050,000 $543
Stock Value (12 X Earnings) $6,514.02
37
REFERENCES
1. http://www.saudiaramcoworld.com/issue/196003/trees.in.the.desert.htm
2. http://www.jpost.com/Green-Israel/People-and-The-Environment/Growing-and-Planting-Trees-in-the-Desert
3 .
http://pipelinesinternational.com/news/pipeline_construction_companies_handling_the_heat_in_desert_terrain/0415
15/
4. http://www.finetrees.com/faq/how-much-water-do-trees-need
5. Proctor, Noble S.; Lynch, Patrick J. (1993). Manual of Ornithology. Yale University Press. ISBN 0300076193
6. Pacific Pump and Power Pumps and Generators www.pacificpumpandpower.com
7. Clatterbuck, Wayne and Hodges, Donald Tree crops for Marginal Farmland University of Tennessee 2004
8. http://www.lenntech.com/processes/desalination/general/desalination-key-issue.htm
5 Fifth Desal Plant 8 year results Supports 83,000 Acres
Costs Each/Per Year Years Cost/Revenue
Business Loan $200,000,000 @ 6% $12,000,000 8 $96,000,000
Cost to Build Plant + Pipelines $719,530,000 1 $719,530,000
Water Sales Pilot $13,760,000 8 $110,080,000
Water Sales 2nd Plant $27,520,000 8 $220,160,000
Water Sales 3rd Plant $55,728,000 8 $445,824,000
Water Sales 4th Plant $72,240,000 8 $577,920,000
Water Sales 5th Plant $137,600,000 8 $1,100,800,000
VAT $2,454,784,000 10% $245,478,400
Running Costs $28,504,273 8 $228,034,184
Pumping Cost $15,976,050 8 $127,808,400
Maintenance and Staff $5,000,000 8 $40,000,000
Net Revenue 5th Plant $104,095,727 8 $739,957,416
Net Revenue 4th Plant $346,987,221
Net Revenue 3rd Plant $300,235,584
Net Revenue 2nd Plant $156,909,600
Net Revenue from pilot plant $62,829,600
Depreciation of capital equipment $1,773,730,000 20 $88,686,500
Gross Earnings $1,272,754,521
Profit Tax 30.00% $381,826,356
Net Earnings $890,928,165
Earnings per share 1,050,000 $849
Stock Value (12 X Earnings) $10,182.04
38
9. "A fresh start for Yuma desalting plant" Los Angeles Times, May 1, 2010
10. Anita Kelleher How can everyone have sufficient clean water without Conflict? Journal of Futures Studies June
2012 16(4): 3-20
11. Tamim Younos The Economics of Desalination Journal of Contemporary Water Research and Education Issue
132 Pages 39-45 December 2005
12. http://pipeliner.com.au/news/water_pipielines_quenching_australias_thirst/001031/
13. http://pipeliner.com.au/news/keeping_pipelines_on_the_level_dr_bassem_youssef/082209/
14. Desalination without brine discharge Nichol-Andre Berdelle PROTOTYPE-CREATION.DE
15. Timber Industry Action Plan Department of Primary Industries December 2001 customer
service@dpi.vic.gov.au
16. 10,000 gal/day Container Desalination Equipment Water Siyuan Group Co Ltd
17. http://www.primevalgardens.com/environment.html
18. Sedeer EK-Showk The Paulownia Tree An Alternative for sustainable Forestry
http://www.cropdevelopment.org
19. Alan Durning Cap and Trade 101 July 2009 Sightline Institute
20. T. J. Blom Carbon Dioxide in Greenhouses December 2002 http://omafra.gov.on.ca/english/crops/facts/00-
077.htm
21. Jeremy David The cost of Carbon Capture MIT USDE Award DE-FG02-99ER62748
22. Leonard Ornstein Irrigated Afforestation of the Sahara and Australian Outback to end global warming. Climate
Change (2009) 97:409-437 DOI 10.1007/s10584-009-9626-y
23. Carbon Capture and Storage Wikipedia April 2013
24. Desalination and Industrial Water Treatment Saltworks http://saltworkstech.com/
25. Tom Nesbit of Forest Research Water Use by Trees April 2005 Forestry Commission Edinburgh UK
26. Roy M Sachs Maximum Biomass Yields on Prime Agricultural Land California Agriculture November-
December 1988
27. Ashkelon Seawater Reverse Osmosis Plant 2006 http://www.water-technology.net/projects/israel/
28. David Thompson Plantations and Wood Supply http://www.plantations2020.com.au
29. Lori Marsh Virginia Tech Pumping Water from Remote Locations for Livestock Watering.
30. "Desalination" (definition), The American Heritage Science Dictionary, Houghton Mifflin Company, via
dictionary.com..
31. "Australia Aids China In Water Management Project." People's Daily Online, 2001-08-03, via
english.people.com.cn. .
32. Fischetti, Mark (September 2007). "Fresh from the Sea". Scientific American 297 (3): 118–119.
doi:10.1038/scientificamerican0907-118. PMID 17784633.
33. "Finding Water in Mogadishu"IPS news item 2008
34. "Energy Efficient Reverse Osmosis Desalination Process", p343 Table 1, International Journal of
Environmental Science and Development, Vol. 3, No. 4, August 2012
35. "Analysis of the Energy Intensity of Water Supplies for West Basin Municipal Water District", Table on p4,
Robert C. Wilkinson Ph.D, March 2007
36. "U.S.Electricity Consumption for Water Supply & Treatment", p1-4 Table 1-1, Electric Power Research
Institute (EPRI) Water & Sustainability (Volume 4), 2000
37. "Seawater Desalination", p12 et seq, Menachem Elimelech, 2012
38. "Optimizing Lower Energy Seawater Desalination", p6 figure 1.2, Stephen Dundorf at the IDA World Congress
November 2009
39. "Membrane Desalination Power Usage Put In Perspective" , American Membrane Technology
Association(AMTA) April 2009
40. "ENERGY REQUIREMENTS OF DESALINATION PROCESSES", Encyclopedia of Desalination and Water
Resources (DESWARE),
41. Lisa Henthorne (November 2009). "The Current State of Desalination". International Desalination Association.
42. Opportunities aplenty | H2O Middle East. H2ome.net (2012-02-06).
43. Shoaiba Desalination Plant. Water Technology.
44. Fritzmann, C; Lowenberg, J; Wintgens, T; Melin, T (2007). "State-of-the-art of reverse osmosis desalination".
Desalination 216: 1–76. doi:10.1016/j.desal.2006.12.009.
45. Osman A. Hamed (2005). "Overview of hybrid desalination systems – current status and future prospects".
Desalination 186: 207–214. doi:10.1016/j.desal.2005.03.095.
39
46. B.M. Misra and J. Kupitz (2004). "The role of nuclear desalination in meeting potable water needs in water
scarce areas in the next decades". Desalination 166: 1–9. doi:10.1016/j.desal.2004.06.053.
47. Nuclear Desalination.
48. Heinz Ludwig (2004). "Hybrid systems in seawater desalination – practical design aspects, present status and
development perspectives". Desalination 164: 1–18. doi:10.1016/S0011-9164(04)00151-1.
50. Tom Harris (2002-08-29) How Aircraft Carriers Work. Howstuffworks.com.
51. "Nuclear Desalination". World Nuclear Association. January 2010.
52. Barlow, Maude, and Tony Clarke, "Who Owns Water?" The Nation, 2002-09-02, via thenation.com.
53. Yuan Zhou and Richard S.J. Tol. "Evaluating the costs of desalination and water transport." (Working paper).
Hamburg University. 2004-12-09.
54. Desalination is the Solution to Water Shortages, redOrbit, May 2, 2008
55. Sitbon, Shirli. "French-run water plant launched in Israel," European Jewish Press, via ejpress.org, 2005-12-28.
56. "Black & Veatch-Designed Desalination Plant Wins Global Water Distinction," (Press release). Black & Veatch
Ltd., via edie.net, 2006-05-04.
57. Perth Seawater Desalination Plant, Seawater Reverse Osmosis (SWRO), Kwinana. Water Technology.
58. "Sydney desalination plant to double in size," ABC News (Australian Broadcasting Corporation), via abc.net.au,
2007-06-25.
59. Australia Turns to Desalination by Michael Sullivan and PX Pressure Exchanger energy recovery devices from
Energy Recovery Inc. An Environmentally Green Plant Design. Morning Edition, National Public Radio, June 18,
2007
60. Fact sheets, Sydney Water http://sydneywaternews.com.au/tag/factsheets-2/
61. Water prices to rise and desalination plant set for Port Stanvac|Adelaide Now. News.com.au (2007-12-04).
62. Desalination plant for Adelaide. ministers.sa.gov.au. December 5, 2007
63. Bernard Humphreys AdelaideNow readers mostly back desalination plant. AdelaideNow. December 6, 2007
64. Kranhold, Kathryn. (2008-01-17) Water, Water, Everywhere... – WSJ.com. Online.wsj.com. 35. Desalination
gets a serious look – Friday, March 21, 2008|2 a.m.. Las Vegas Sun. 36. Desalination: A Component of the Master
Water Plan . tampabaywater.org
65. Hydro-Alchemy, Forbes, May 9, 2008
66. The Arid West—Where Water Is Scarce – Desalination—a Growing Watersupply Source, Library Index
67. Heather Cooley, Peter H. Gleick, and Gary Wolff DESALINATION, WITH A GRAIN OF SALT. A California
Perspective, Pacific Institute for Studies in Development, Environment, and Security, June 2006 ISBN 1-893790-13-
4
68. Australia Turns to Desalination Amid Water Shortage. NPR.
69. Lattemann, Sabine; Höpner, Thomas (2008). "Environmental impact and impact assessment of seawater
desalination". Desalination 220: 1. doi:10.1016/j.desal.2007.03.009.
70. Desalination without brine discharge – Integrated Biotectural System, by Nicol-André Berdellé, 02.20.2011
71. Gleick, Peter H., Dana Haasz, Christine Henges-Jeck, Veena Srinivasan, Gary Wolff, Katherine Kao Cushing,
and Amardip Mann. (November 2003.) "Waste not, want not: The potential for urban water conservation in
California." (Website). Pacific Institute.

More Related Content

Similar to 38. australia deserts-converted-into-forests-july-5(1)

Livestock summary of key points 40-c
Livestock   summary of key points 40-cLivestock   summary of key points 40-c
Livestock summary of key points 40-c
Paul Mahony
 
Chapter 8 restoring the earth
Chapter 8 restoring the earthChapter 8 restoring the earth
Chapter 8 restoring the earth
Start Loving
 
Deforestation by Saul Mayordomo, Adrian george perez and Jose miguel perez hita
Deforestation by Saul Mayordomo, Adrian george perez and Jose miguel perez hita Deforestation by Saul Mayordomo, Adrian george perez and Jose miguel perez hita
Deforestation by Saul Mayordomo, Adrian george perez and Jose miguel perez hita
Antonio Saorín Pérez-muelas
 

Similar to 38. australia deserts-converted-into-forests-july-5(1) (20)

Gas versus Wind as an Energy Source - Teika
Gas versus Wind as an Energy Source - TeikaGas versus Wind as an Energy Source - Teika
Gas versus Wind as an Energy Source - Teika
 
FoE FREdome - can trees make it rain?
FoE FREdome - can trees make it rain?FoE FREdome - can trees make it rain?
FoE FREdome - can trees make it rain?
 
Livestock summary of key points 40-c
Livestock   summary of key points 40-cLivestock   summary of key points 40-c
Livestock summary of key points 40-c
 
Essay On Deforestation
Essay On DeforestationEssay On Deforestation
Essay On Deforestation
 
Chapter 8 restoring the earth
Chapter 8 restoring the earthChapter 8 restoring the earth
Chapter 8 restoring the earth
 
Forestry technologies for adaptationto climate change.pptx
Forestry technologies for adaptationto climate change.pptxForestry technologies for adaptationto climate change.pptx
Forestry technologies for adaptationto climate change.pptx
 
GW Group Technical forestry report Teak Costa Rica
GW Group Technical forestry report Teak Costa Rica GW Group Technical forestry report Teak Costa Rica
GW Group Technical forestry report Teak Costa Rica
 
Friendly Forest Newsletter produced for Teagasc
Friendly Forest Newsletter  produced for TeagascFriendly Forest Newsletter  produced for Teagasc
Friendly Forest Newsletter produced for Teagasc
 
Friendly forest
Friendly forestFriendly forest
Friendly forest
 
Friendly forest
Friendly forestFriendly forest
Friendly forest
 
A n d forestry
A n d forestryA n d forestry
A n d forestry
 
How Many Ways can you make a Difference by Ashleigh Lane and Stephanie Murphy
How Many Ways can you make a Difference  by Ashleigh Lane and Stephanie MurphyHow Many Ways can you make a Difference  by Ashleigh Lane and Stephanie Murphy
How Many Ways can you make a Difference by Ashleigh Lane and Stephanie Murphy
 
Deforestation & conservation efforts farrukh
Deforestation & conservation efforts farrukhDeforestation & conservation efforts farrukh
Deforestation & conservation efforts farrukh
 
Deforestation
DeforestationDeforestation
Deforestation
 
Bio Wiki
Bio WikiBio Wiki
Bio Wiki
 
Deforestation by Saul Mayordomo, Adrian george perez and Jose miguel perez hita
Deforestation by Saul Mayordomo, Adrian george perez and Jose miguel perez hita Deforestation by Saul Mayordomo, Adrian george perez and Jose miguel perez hita
Deforestation by Saul Mayordomo, Adrian george perez and Jose miguel perez hita
 
Babu12
Babu12Babu12
Babu12
 
Deforestation Powerpoint[1]
Deforestation Powerpoint[1]Deforestation Powerpoint[1]
Deforestation Powerpoint[1]
 
Deforestation
Deforestation Deforestation
Deforestation
 
Adapting Grazing Systems To A Changing Climate
Adapting Grazing Systems To A Changing ClimateAdapting Grazing Systems To A Changing Climate
Adapting Grazing Systems To A Changing Climate
 

Recently uploaded

Spellings Wk 3 English CAPS CARES Please Practise
Spellings Wk 3 English CAPS CARES Please PractiseSpellings Wk 3 English CAPS CARES Please Practise
Spellings Wk 3 English CAPS CARES Please Practise
AnaAcapella
 
Jual Obat Aborsi Hongkong ( Asli No.1 ) 085657271886 Obat Penggugur Kandungan...
Jual Obat Aborsi Hongkong ( Asli No.1 ) 085657271886 Obat Penggugur Kandungan...Jual Obat Aborsi Hongkong ( Asli No.1 ) 085657271886 Obat Penggugur Kandungan...
Jual Obat Aborsi Hongkong ( Asli No.1 ) 085657271886 Obat Penggugur Kandungan...
ZurliaSoop
 
The basics of sentences session 3pptx.pptx
The basics of sentences session 3pptx.pptxThe basics of sentences session 3pptx.pptx
The basics of sentences session 3pptx.pptx
heathfieldcps1
 

Recently uploaded (20)

How to Manage Global Discount in Odoo 17 POS
How to Manage Global Discount in Odoo 17 POSHow to Manage Global Discount in Odoo 17 POS
How to Manage Global Discount in Odoo 17 POS
 
Sociology 101 Demonstration of Learning Exhibit
Sociology 101 Demonstration of Learning ExhibitSociology 101 Demonstration of Learning Exhibit
Sociology 101 Demonstration of Learning Exhibit
 
ICT Role in 21st Century Education & its Challenges.pptx
ICT Role in 21st Century Education & its Challenges.pptxICT Role in 21st Century Education & its Challenges.pptx
ICT Role in 21st Century Education & its Challenges.pptx
 
This PowerPoint helps students to consider the concept of infinity.
This PowerPoint helps students to consider the concept of infinity.This PowerPoint helps students to consider the concept of infinity.
This PowerPoint helps students to consider the concept of infinity.
 
FSB Advising Checklist - Orientation 2024
FSB Advising Checklist - Orientation 2024FSB Advising Checklist - Orientation 2024
FSB Advising Checklist - Orientation 2024
 
Spatium Project Simulation student brief
Spatium Project Simulation student briefSpatium Project Simulation student brief
Spatium Project Simulation student brief
 
Application orientated numerical on hev.ppt
Application orientated numerical on hev.pptApplication orientated numerical on hev.ppt
Application orientated numerical on hev.ppt
 
How to Create and Manage Wizard in Odoo 17
How to Create and Manage Wizard in Odoo 17How to Create and Manage Wizard in Odoo 17
How to Create and Manage Wizard in Odoo 17
 
Introduction to Nonprofit Accounting: The Basics
Introduction to Nonprofit Accounting: The BasicsIntroduction to Nonprofit Accounting: The Basics
Introduction to Nonprofit Accounting: The Basics
 
Single or Multiple melodic lines structure
Single or Multiple melodic lines structureSingle or Multiple melodic lines structure
Single or Multiple melodic lines structure
 
Spellings Wk 3 English CAPS CARES Please Practise
Spellings Wk 3 English CAPS CARES Please PractiseSpellings Wk 3 English CAPS CARES Please Practise
Spellings Wk 3 English CAPS CARES Please Practise
 
Jual Obat Aborsi Hongkong ( Asli No.1 ) 085657271886 Obat Penggugur Kandungan...
Jual Obat Aborsi Hongkong ( Asli No.1 ) 085657271886 Obat Penggugur Kandungan...Jual Obat Aborsi Hongkong ( Asli No.1 ) 085657271886 Obat Penggugur Kandungan...
Jual Obat Aborsi Hongkong ( Asli No.1 ) 085657271886 Obat Penggugur Kandungan...
 
How to setup Pycharm environment for Odoo 17.pptx
How to setup Pycharm environment for Odoo 17.pptxHow to setup Pycharm environment for Odoo 17.pptx
How to setup Pycharm environment for Odoo 17.pptx
 
Sensory_Experience_and_Emotional_Resonance_in_Gabriel_Okaras_The_Piano_and_Th...
Sensory_Experience_and_Emotional_Resonance_in_Gabriel_Okaras_The_Piano_and_Th...Sensory_Experience_and_Emotional_Resonance_in_Gabriel_Okaras_The_Piano_and_Th...
Sensory_Experience_and_Emotional_Resonance_in_Gabriel_Okaras_The_Piano_and_Th...
 
The basics of sentences session 3pptx.pptx
The basics of sentences session 3pptx.pptxThe basics of sentences session 3pptx.pptx
The basics of sentences session 3pptx.pptx
 
Food safety_Challenges food safety laboratories_.pdf
Food safety_Challenges food safety laboratories_.pdfFood safety_Challenges food safety laboratories_.pdf
Food safety_Challenges food safety laboratories_.pdf
 
Unit-V; Pricing (Pharma Marketing Management).pptx
Unit-V; Pricing (Pharma Marketing Management).pptxUnit-V; Pricing (Pharma Marketing Management).pptx
Unit-V; Pricing (Pharma Marketing Management).pptx
 
Jamworks pilot and AI at Jisc (20/03/2024)
Jamworks pilot and AI at Jisc (20/03/2024)Jamworks pilot and AI at Jisc (20/03/2024)
Jamworks pilot and AI at Jisc (20/03/2024)
 
REMIFENTANIL: An Ultra short acting opioid.pptx
REMIFENTANIL: An Ultra short acting opioid.pptxREMIFENTANIL: An Ultra short acting opioid.pptx
REMIFENTANIL: An Ultra short acting opioid.pptx
 
Google Gemini An AI Revolution in Education.pptx
Google Gemini An AI Revolution in Education.pptxGoogle Gemini An AI Revolution in Education.pptx
Google Gemini An AI Revolution in Education.pptx
 

38. australia deserts-converted-into-forests-july-5(1)

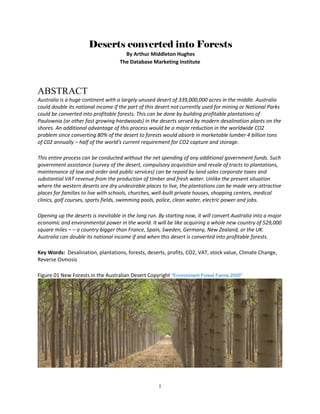
  • 1. 1 Deserts converted into Forests By Arthur Middleton Hughes The Database Marketing Institute ABSTRACT Australia is a huge continent with a largely unused desert of 339,000,000 acres in the middle. Australia could double its national income if the part of this desert not currently used for mining or National Parks could be converted into profitable forests. This can be done by building profitable plantations of Paulownia (or other fast growing hardwoods) in the deserts served by modern desalination plants on the shores. An additional advantage of this process would be a major reduction in the worldwide CO2 problem since converting 80% of the desert to forests would absorb in marketable lumber 4 billion tons of C02 annually – half of the world’s current requirement for CO2 capture and storage. This entire process can be conducted without the net spending of any additional government funds. Such government assistance (survey of the desert, compulsory acquisition and resale of tracts to plantations, maintenance of law and order and public services) can be repaid by land sales corporate taxes and substantial VAT revenue from the production of timber and fresh water. Unlike the present situation where the western deserts are dry undesirable places to live, the plantations can be made very attractive places for families to live with schools, churches, well-built private houses, shopping centers, medical clinics, golf courses, sports fields, swimming pools, police, clean water, electric power and jobs. Opening up the deserts is inevitable in the long run. By starting now, it will convert Australia into a major economic and environmental power in the world. It will be like acquiring a whole new country of 529,000 square miles – – a country bigger than France, Spain, Sweden, Germany, New Zealand, or the UK. Australia can double its national income if and when this desert is converted into profitable forests. Key Words: Desalination, plantations, forests, deserts, profits, CO2, VAT, stock value, Climate Change, Reverse Osmosis Figure 01 New Forests in the Australian Desert Copyright "Environment Forest Farms 2005"
  • 2. 2 CONTENTS ABSTRACT................................................................................................................................................... 1 INTRODUCTION .......................................................................................................................................... 3 THE GEOGRAPHY OF AUSTRALIA ........................................................................................................... 3 LOCATION OF THE PLANTATIONS........................................................................................................... 4 MINING AREAS IN AUSTRALIA ................................................................................................................ 5 NATIONAL PARKS ...................................................................................................................................... 6 HOW A PILOT PLANTATION COULD BE SET UP ..................................................................................... 8 HOW TREE PLANTATIONS WILL BE FINANCED..................................................................................... 9 THE ROLE OF THE WESTERN AUSTRALIAN GOVERNMENT .............................................................. 10 COST OF POWER FOR THE DESALINATION PLANTS ........................................................................... 12 WHO SHOULD PAY WHOM? .................................................................................................................... 13 DESALINATION BY REVERSE OSMOSIS................................................................................................ 14 LAYING THE PIPELINE FOR WATER DELIVERY ..........................................................................................16 WHY THE DESERTS?................................................................................................................................. 18 HOW THE TOWNS SHOULD INTERFACE WITH THE FORESTS............................................................ 19 WHY PAULOWNIA TREES?...................................................................................................................... 20 THE WORLD MARKET FOR AUSTRALIAN LUMBER ............................................................................ 22 AUSTRALIA’S NEED FOR INCREASED WOOD PRODUCTION ............................................................. 24 HOW THE DESERT CAN BE CONVERTED TO FOREST.......................................................................... 25 DECISIONS TO BE MADE ......................................................................................................................... 26 APPENDIX.................................................................................................................................................. 26 HOW THIS PAPER CAME TO BE WRITTEN............................................................................................. 26 ENVIRONMENTAL IMPLICATIONS OF THE FORESTS.......................................................................... 27 THE WRONG WAY TO PLANT TREES IN THE DESERT.......................................................................................28 CONCLUSIONS ON CARBON DIOXIDE SPENDING ............................................................................... 30
  • 3. 3 WILL THE SAHARA NATIONS ADOPT FORESTATION?........................................................................ 30 FINANCIAL TABLES FOR PLANTATIONS.............................................................................................................31 FINANCIAL TABLES FOR DESALINATION PLANTS.............................................................................................34 REFERENCES............................................................................................................................................. 37 INTRODUCTION As economics works, any available resource, if it is profitable, will eventually be developed by entrepreneurs. This is true of coal, oil, natural gas, or real estate. As you can see by reading this paper, the undeveloped deserts of Australia are an available resource which can be very profitable for someone. They are not developed today because they are hot, dry and less desirable than the land along the coasts. Once the coastland has all been developed Australians will see the deserts in a new light. They will plant trees on them to make money. When will that happen? Ten years, twenty years, thirty years from now? Who knows? All we know is that it will happen. So why not right away? The purpose of this paper is to point out that there is profit to be made. If you are an entrepreneur you could be richer than you are now by creating a desalination plant or building a plantation in the desert. The facts are available. It is up to someone to take action. THE GEOGRAPHY OF AUSTRALIA Most of Australia's interior is dry and waterless. The very low average annual rainfall means interior rivers are often dry and lakes empty. Flood events drastically alter the dry environment in which the ecology of central Australia has had to adapt to the boom and bust cycle. Figure 02 Map of the Forests of Australia Source: Forests Australia - Fast Forest Factsadl.brs.gov.au
  • 4. 4 Australia’s forests are around the edges. The center of Australia is dry desert. There are 1,882,431,500 acres in total with 339,000,000 (17.5%) of them desert. The desert area is so dry that few people want to live there. The few workers (chiefly miners) who work there have to be flown in every week or two. The mining companies in general have not constructed the type of living facilities such as housing, restaurants, shopping, sports facilities, etc. that would encourage families to locate there. This central desert area is vast. It is bigger than most of the countries of the world. Making this desert area a livable place would change the entire geography of Australia. Where would the water come from to change the deserts into forests? Desalination of the sea water. There are 15,000 desalination plants around the world. The most efficient ones are producing fresh water at 1/5 of a cent per gallon. To grow trees in a forest they need 960,000 gallons of water per acre per year. (http://www.forestry.gov.uk/pdf/fcin065.pdf/$FILE/fcin065.pdf ) There is some, but very little rainfall in the Western Australia desert --that’s why it’s a desert. To be on the safe side, we would have to add about 860,000 gallons of water per year to each acre to grow trees in the desert. At the rate of 1/5 of a cent per gallon, 860,000 gallons of water will cost $1,720.00 per acre per year. That sounds like a lot, but perhaps not when you look at what you can grow for that amount of money. One possible type of tree to be grown in the deserts would be Paulownia trees which are grown successfully all over the world including Australia. Many case studies report that you can make $8,000 or more per acre per year by selling the lumber from these trees. Currently, there is a shortage of wood in Australia. We are importing wood from abroad. The government would very much like to see more grown domestically. LOCATION OF THE PLANTATIONS This essay proposes starting with a pilot tree plantation of 8,300 acres in the desert with a small desalination plant located nearby on the shore to provide water. They would be connected by a water line and natural gas line buried in the ground. Where should the pilot plant be located? There are several considerations for the location: 1) The plantation should be relatively close to the shore to keep the pipeline as short as possible. 2) The pilot plant should have an easy access to paved road to get the lumber to market. 3) The plantation and the pipeline should not interfere with any indigenous heritage areas (see below). 4) They should not interfere with any mining area (see below). 5) They should not interfere with any National Park (see below). 6) It should be located in an area relatively free from brush fires.
  • 5. 5 The outback is vast: 339 million acres. There are very few people who live there. The total population of Outback Australia declined from 700,000 in 1996 to 690,000 in 2006. That’s one person for every 491 acres. 17% of the total population is indigenous. Besides these indigenous people, the other 573,000 live in mining areas and national parks. In general, the deserts are flat. The extent and intensity of forest fires in Australia vary with latitude and season of rainfall. In northern Australia, where conditions are generally humid, low-intensity fires often burn across large areas. Hot, dry and windy summers in south-eastern Australia often lead to intense bushfires that are difficult to control. Those fires can cause loss of human life and can destroy assets such as trees, livestock, buildings, fences, bridges and power lines. Bushfires in southern Australia lead to soil erosion and degrade stream water quality. The resulting natural regrowth reduces water yields for decades. Australia deserts are also occasionally home to dust storms which swirl the sand high into the air. The plantations which we propose will change the forest fire situation in their vicinity. In general, new growth well-watered and well-maintained trees do not catch fire easily. What burns easily are dry materials in old-growth forests. This material will not be present in the new plantations proposed in this essay. MINING AREAS IN AUSTRALIA As can be seen from the map in Figure 03, there are millions of acres suitable for plantations that are not occupied by mining companies. Figure 03 Mining Areas of Australia Showing a Possible Pilot Plantation Source: Google.
  • 6. 6 Other than agriculture and tourism, the main economic activity in this vast and sparsely settled area is mining. Owing to the complete absence of mountain building and glaciation since the Permian (in many areas since the Cambrian) ages, the outback is extremely rich in iron, aluminum, manganese and uranium ores, and also contains major deposits of gold, nickel, iron, lead and zinc ores. Because of its size, the value of mining is considerable. Major mines and mining areas in the outback include opals at Coober Pedy, Lightning Ridge and White Cliffs, metals at Broken Hill, Tennant Creek, Olympic Dam and the remote Challenger Mine. Oil and gas are extracted in the Cooper Basin around Moomba. In Western Australia the Argyle diamond mine in the Kimberley (Western Australia) is the world's biggest producer of natural diamonds and contributes approximately one-third of the world's natural supply. The Pilbara region's economy is dominated by mining and petroleum industries Most of Australia's iron ore is also mined in the Pilbara and it also has one of the world's major manganese mines. The plantations proposed in this paper will not disturb these mining areas in any way. As the plantations grow, they will make it easier to develop the mining areas. Miner’s families will eventually want to settle in the new towns that will be created by plantations that are near to the mining areas. They will use the housing, shopping centers, schools, hospitals and recreational facilities. Mine operators will find it much easier to attract workers who will stay at the mines, with their families living nearby in highly civilized towns. NATIONAL PARKS Australia has over 500 national parks. Over 69 million acres of land are designated as national parkland, accounting for almost four per cent of Australia's land areas. In addition, a further six per cent of Australia is protected and includes state forests, nature parks and conservation reserves. National parks are usually large areas of land that are protected because they have unspoiled landscapes and a diverse number of native plants and animals. This means that commercial activities such as farming or tree plantations are prohibited and human activity is strictly monitored. As can be seen in Figure 04, there is plenty of space for tree plantations that will not interfere with National Parks or state forests – and will, in fact, make access to the parks easier for Australians than it is now. Figure 04 Australian National Parks Source: Australian National Park Service
  • 7. 7 Aboriginal sacred sites are areas or places in the Australian landscape of significant Aboriginal Australian meaning within the context of the localized indigenous belief system, known as The Dreaming, which has its origins in Dreamtime. Sites sacred to Aboriginal people are part of Australia’s cultural heritage, connecting the land with the cultural values, spiritual beliefs and kin-based relationships of the local people. There are so few such sites that it should not be difficult to find dozens of sites for plantations that do not interfere with such sacred sites. Farming in Australia Agriculture is an important sector for the Australian economy, generating up to $43 billion in gross value each year. Farming employs around 370,000 people across Australia. Although agriculture is not as extensive as at its peak in the mid -1970s, farms still take up around sixty per cent of all the land in Australia. There are no known farms in the desert area where the new plantations are to be located. Main Roads There are few paved roads in the desert areas. Close to Perth, however, there are roads that can be used to access the planned pilot plantation. Figure 05 Roads near the proposed pilot plantation
  • 8. 8 HOW A PILOT PLANTATION COULD BE SET UP The deserts can be converted in to forests, one plantation at a time. A group of entrepreneurs can build a desalination plant to serve a group of foresters who want to create a plantation. The government can determine the locations for the desalination plant and the plantation. The two would be linked by a contract to produce and sell fresh water at $0.002 per gallon in quantities sufficient to grow trees on the 8000 acre plantation and provide water for the 300 acre residential and commercial section. A pilot desalination plant to do this can be started by selling securities at $100 each. Table 01 is a financial picture for the desalination plant: Table 01 Financial Plan for the Pilot Desalination Plant Pilot Plantation
  • 9. 9 It would take a couple of years to hold the hearings and get all the permits to build the plant. This plant would be built at the same time that another group of investors is getting organized to start a plantation of 8,300 acres to be serviced by this desalination plant. As table 02 shows, after about ten years, the original investors who paid $100 each for their shares in the desalination company would find their shares were worth $398 each. If they hang on to them, they will be worth far more. I assume that the desalination company will build at least four more plants in the future, each serving larger and larger plantations using the accumulated cash from the previous plants. Table 02 shows the growth in value of the original $100 shares as a result of building these new desalination plants. Table 02 Cost of Desalination Plants and Stock Value HOW TREE PLANTATIONS WILL BE FINANCED Those starting a tree plantation have to be able to wait for five to eight years until they harvest their first crop. This is normal for any farmer or tree planter. But in the Australian deserts, there is a new wrinkle. They have to pay thousands of dollars for water for those years until their Financial Plan for the Pilot Desalination Plant 8 year results Supports: 8,300 Acres Sale of shares of stock 1,050,000 $100 each $105,000,000 Costs Per Year Years Cost/Revenue Cost to build Desalination Plant & Pipeline $97,236,400 1 $97,236,400 Water Sales Pilot Plant $13,760,000 8 $110,080,000 VAT 10% 8 $11,008,000 Running Costs $2,953,150 8 $23,625,200 Pumping Costs $1,597,605 8 $12,780,840 Maintenance & Staff $1,000,000 8 $8,000,000 Net Revenue Pilot Plant $6,833,245 8 $54,665,960 Depreciation of capital equipment $97,236,400 20 $4,861,820 Gross Earnings $49,804,140 Profit tax 30.00% $14,941,242 Net Earnings $34,862,898 Net Earnings Per Share 1,050,000 $33.20 Stock Value (12 X Earnings) $398.43 Cost of Plant, and Annual Revenue of Desal Plant and $100 Stock Value Plant Number Acres Gal Per Acre / year Gallons per year Plant Cost Water Sale / Year Stock Value 1 8,300 860,000 7,138,000,000 $96,236,400 $13,760,000 $398.43 2 16,600 860,000 14,276,000,000 $177,667,200 $27,520,000 $1,389.36 3 43,000 860,000 36,980,000,000 $421,300,000 $13,760,000 $3,898.52 4 62,000 860,000 53,320,000,000 $552,680,000 $72,240,000 $6,514.02 5 83,000 860,000 71,380,000,000 $740.561,000 $137,600,000 $10,182.04
  • 10. 10 crop can be harvested. The waiting is very expensive. It requires any plantation to have millions of dollars on hand at the beginning. Few tree planters have that kind of money. There are a few large tree plantation companies, such as Weyerhaeuser who could afford this. But we cannot base the conversion of Australian deserts on one or two companies. To solve this problem, we must introduce a unique financing method not customary in the forestry business: selling stock based on the success of future harvesting of trees. To explain how this can come about we must explore the surveying of the desert. THE ROLE OF THE WESTERN AUSTRALIAN GOVERNMENT To start with, the Australian Bureau of Agriculture and Resource Economics (ABARE) can survey the western deserts to lay out suitable areas for plantations and rural communities. They will acquire ownership through Compulsory Acquisition. They will make the plantation tracts available to qualified buyers who:  Have sufficient funds to pay for 8 years of water and other expenses before they can harvest the trees  Are experienced foresters  Have a good record  Agree to plant trees that will meet ABARE standards  Have capital sufficient to pay for water and other expenses for 8 years until the trees are harvested.  Sign papers agreeing to the above. Who can qualify to acquire a plantation? These requirements are so strict that few Australian firms will be able to, or will want to agree to them. There will be only two types of firms that will qualify for plantations: A. Large experienced forestry corporations that have access to millions of dollars of capital or borrowed money B. Corporations formed expressly to meet these requirements which combine financial resources and experienced foresters. For these we will assume that they sell shares of stock to finance their acquisition of the property. For the purpose of this study, we will assume that there will be at least one “B” type plantation that will be set up to acquire a plantation of at least 8,300 acres. The financial picture for such an 8,300 acre plantation looks like Table 03. Table 03 Financial Plan for a Pilot Plantation of 8300 acres.
  • 11. 11 As you can see, the return to the investors is very substantial. This plan is based on a long term contract for water with the desalination plant at $0.002 per gallon and the assumption that after the trees are grown the lumber will be sold for $512,000,000. As you will see later on, Paulownia trees are very valuable. Once cut down, the stumps regrow automatically, reaching ten or fifteen feet the first year. The new tree relies on the extensive root system created in the first eight years. Each investor who paid $100 will find his share worth $2,058 after eight years. There should be no difficulty in raising capital with this possible future revenue. The plantation will keep on producing trees year after year. Table 03 introduces some new features of the plantations. There will be people – workers, families, businessmen, teachers, policemen, doctors and nurses and children on the plantations. They will live in houses, and work in stores and offices. They will receive free water, but will have to pay for their homes and offices and electricity. The Residential and Commercial (R&C) aspects of the plantations are shown here. The plantation will receive revenue from selling lumber and also from constructing houses and offices and selling or renting them plus electricity to the plantation residents. From the beginning the residents of the plantations will have the internet with WIFI. Not shown here is the electrical power generation plant located on the plantation. This plant will produce electricity from a generating plant using natural gas derived from a gas pipeline in the same trench made for the water line from the desalination plant. Pilot Plantation 8,300 Acres Shares Sold Price Capital Raised Expenses and Profit from 8,000 Acres forest + 300 Commercial & Residential 1,400,000 $100 $140,000,000 Expense Category Number Rate Years Dollars Staff (Acres per worker = 200) 40 $50,000 8 $16,000,000 Water 8000 $1,720 8 $110,080,000 Seedlings 8000 $800 1 $6,400,000 Fertilizer 8000 $230 8 $14,720,000 Equipment 8000 $300 8 $19,200,000 Miscellaneous 8000 $100 8 $6,400,000 $50 million Bank Loan @ 7% $50,000,000 7% 8 $28,000,000 Total 8 year costs $181,600,000 Depreciation of Equipment 20 $960,000 Lumber Sales After 8 years 8000 $8,000 8 $512,000,000 Fees residential & Commercial 300 $30,000 8 $72,000,000 Total Revenue $584,000,000 VAT 10% $58,400,000 Earnings after 8 years $343,040,000 Profit Tax 30% $102,912,000 Earnings after Tax $240,128,000 Earnings Per Share $171.52 Value Per Share after 8 years (12 X) $2,058.24
  • 12. 12 Once the pilot plantation has been started, there will be other plantations created which will use the same fresh water company that supplied the pilot plantation Table 04 shows some projections of the future plantations supported by the same water company: Table 04 Projections of future plantations The electricity will be generated on the plantation using natural gas @ $4.28 per Mcf Table 05 People assumed living on the pilot plantation COST OF POWER FOR THE DESALINATION PLANTS There are many ways of generating the power for desalination plants including coal, oil, wind and natural gas. We are trying to reduce the carbon footprint of these plants. We would like to use wind power, but the location may not be suitable for this, so we will assume natural gas for this analysis. Assumptions: A metric cubic meter of desalinated water requires 3.2 kWh to produce. A kWh requires .00798 Mcf (1,000 cubic feet) of natural gas. The cost of natural gas today is $4.28 per Mcf. Putting all these numbers together with the assumed desalination plants proposed we get these numbers: Size and revenue from plantations served by the original water company Acres Forest Per Acre Lumber Sales R&C Revenue Total 8 yr Revenue 12X Share Value Pilot 8,300 8,000 $8,000 $531,200,000 $72,000,000 $603,200,000 $2,058.24 2nd Plant 16,600 16,000 $8,000 $1,062,400,000 $144,000,000 $1,206,400,000 $6,295.68 3rd Plant 33,200 32,400 $8,000 $2,124,800,000 $192,000,000 $2,316,800,000 $8,310.43 4th Plant 44,000 42,000 $8,000 $2,816,000,000 $480,000,000 $3,296,000,000 $12,046.56 5th Plant 83,000 80,000 $8,000 $5,312,000,000 $720,000,000 $6,032,000,000 $22,094.40 Pilot Plantation Residents and Electricity Usage People Households KWH/Year @ 100 Month Paid by Households Woodsmen 40 30 395,280 $36,000 Wives 100 0 - $0 Children 90 0 - $0 Teachers 12 4 52,704 $4,800 Police & Fire 15 6 79,056 $7,200 Medical 12 6 79,056 $7,200 Commercial 120 70 922,320 $84,000 Roads & Pipelines 10 6 79,056 $7,200 Water Company 4 6 79,056 $7,200 Construction 10 6 79,056 $7,200 TOTAL 413 134 1,765,584 $160,800
  • 13. 13 Table 06 Running Costs of future desalination plants ad $4.28 per mcf We are assuming that there will be an electrical power plant built at the plantation. This will receive its power from a natural gas pipe laid along with the pipeline that delivers the water (more later). Sales of electricity will be another revenue generator for the plantation owners. What if the cost of natural gas goes up? This will raise the costs of the desalination plant and the electricity at the plantation. We checked with the US Energy Information Agency. They predict that gas prices will rise from $4.38 to $5.40 by 2030. At these higher prices, how will this affect the water and the plantations? We made the assumption that the water company, which is already highly profitable, would continue to honor its contact to supply water at $0.002 per gallon. On that basis, the higher price of natural gas would reduce their profits, but keep the plantations supplied with fresh water at the same price. Why? Because soon everyone will realize that converting the deserts to forests is the name of the game. If anything keeps the plantations from being profitable, the entire scheme will collapse. TABLE 07 RUNNING COSTS FOR THE DESALINATION PLANTS AT GAS PRICES OF $5.40 WHO SHOULD PAY WHOM? What should the plantation owners pay to the government for the use of public desert lands to make profits? That’s the wrong question. The question should be: What do the Australian people owe the pioneers who will convert the outback to profitable forests and farmland? If you look at the situation, the plantation owners will gradually increase the size of usable Australian land by converting about 80% of the 339 million acres of desert into profitable tax paying forest and farmland with homes for more than two million people. The situation is not unlike what happened in the United States from 1849 to 1900. Before 1849 Running Costs for the Desalination Plants 2013 prices $4.28 Acres M3D KWh MCF Nat Gas Daily cost of Natural Gas Per Year Cost Pilot 8,300 74,028 236,890 1,890.38 $8,090.82 $2,953,150 2nd Plant 16,600 148,056 473,779 3,780.76 $16,181.64 $5,906,300 3rd Plant 33,200 296,000 947,200 7,558.66 $32,351.05 $11,808,132 4th Plant 44,000 396,000 1,267,200 10,112.26 $43,280.46 $15,797,366 5th Plant 83,000 714,530 2,286,496 18,246.24 $78,093.90 $28,504,273 Running Costs for the Desalination Plants in 2030 prices $5.40 Acres M3D KWh MCF Nat Gas Daily cost of Natural Gas Per Year Cost Pilot 8,300 74,028 236,890 1,890.38 $10,208.05 $3,725,937 2nd Plant 16,600 148,056 473,779 3,780.76 $20,416.09 $7,451,874 3rd Plant 33,200 296,000 947,200 7,558.66 $40,816.74 $14,898,111 4th Plant 44,000 396,000 1,267,200 10,112.26 $54,606.18 $19,931,257 5th Plant 83,000 714,530 2,286,496 18,246.24 $98,529.69 $35,963,335
  • 14. 14 most of the land west of the Mississippi –half of the country—was uninhabited land. Most Easterners didn’t want to live there. Life was hard. There were few towns, and no roads. Over a period of time the settlers who went west created towns, roads, and farmland. What was the result of all this hardship and struggle? The opening of the West. The pioneers opened the land for millions of people who today represent half of the wealth of America; wealth that would not exist today without the work of these pioneers who opened up the land for the generations that followed. What the pioneers in the plantations in the Western deserts will be doing is exactly what the early pioneers of Australia and the United States did. They will open the land for further development. Life and wealth will be better for everyone. So, what do we want to charge them for opening up the west to profitable settlement? Nothing. We want to thank them for doing future generations a tremendous favor. The desalination plants and the plantations will pay the standard 10% VAT plus the 30% corporate profits tax.. Australia will provide desert land which the settlers will convert to highly profitable forests – at no cost to Australia. Looking at the VAT and profits tax revenue to Australia from the first 8 years of Desalination and Plantations, the revenue to the government will be $180,913,094 from the plantation and the desalination plant. That is $180.9 million from land that is not giving the government a cent today. Looking towards the future, the five plantations and the desalination plants will provide $5 Billion dollars in tax revenue from today’s desert property that today pays nothing. Table 08 VAT revenue from plantations and desalination plants DESALINATION BY REVERSE OSMOSIS Osmosis is a natural phenomenon in which a liquid - water, in this case - passes through a semi- permeable membrane from a relatively dilute solution toward a more concentrated solution. # VAT and Profits Tax Over 40 Years From Desalination and Plantations Year Desal VAT Desal Profit Plantation VAT Plantation Profit Total 1 8 $4,128,000 $15,473,094 $58,400,000 $102,912,000 $180,913,094 2 16 $4,128,000 $46,607,760 $116,800,000 $314,784,000 $482,319,760 3 24 $9,700,800 $124,331,443 $226,560,000 $415,521,600 $776,113,843 4 32 $135,398,400 $244,953,713 $316,800,000 $602,328,000 $1,299,480,113 5 40 $245,478,400 $410,346,988 $584,000,000 $1,104,720,000 $2,344,545,388 Total $398,833,600 $841,712,999 $1,302,560,000 $2,540,265,600 $5,083,372,199
  • 15. 15 This flow produces a measurable pressure, called osmotic pressure. If pressure is applied to the more concentrated solution, and if that pressure exceeds the osmotic pressure, water flows through the membrane in the opposite direction -- from the more concentrated solution toward the dilute solution. This process, called reverse osmosis, or RO, removes up to 98% of dissolved minerals, and virtually 100% of colloidal and suspended matter. RO produces high quality water at low cost compared to other purifications processes. Figure 06 Reverse Osmosis The membrane must be physically strong to stand up to high osmotic pressure - in the case of sea water, 2500 kg/m. Most membranes are made of cellulose acetate or polyamid composites cast into a thin film, either as a sheet or fine hollow fibers. The membrane is constructed into a cartridge called a reverse osmosis module. Figure 07 Reverse Osmosis Module The incoming sea water is filtered to remove suspended particles and then pressurized with a pump to about 300 psi. This exceeds the water’s osmotic pressure. The high pressure water forces itself through the module leaving dissolved salts and other water contaminates behind. These impurities are drained and returned to the ocean using carefully controlled paths to avoid contaminating the ocean for the sea life living there. The system proposed for Australia is universal throughout the world. All reverse osmosis systems work the same way. Under pressure, seawater is forced through a semi-permeable membrane that lets the water flow through and keeps the salt and other impurities from getting through. Desalinating seawater involves some processes that could impact marine life. However, those impacts can be avoided or minimized by implementing environmental safeguards at every phase of the project from planning its location to operating it in a manner that results in acceptable water quality and brine loading at the discharge. For example, intake of seawater can entrain marine life, but screens placed at intake locations at power plants and industrial facilities have successfully demonstrated that this type of impact can be significantly reduced.
  • 16. 16 Figure 08 Desalination Plant in Perth Australia The cost of a desalination plant depends on the amount of water output that you need. To start the Australian project we will begin with a small pilot plant that costs $96 million dollars and produces 19 million gallons of water per day – enough for 8300 acres. Figure 09 Cost calculator for desalination plants (Credit DesalData.com) LAYING THE PIPELINE FOR WATER DELIVERY The desalination plants must be close to the ocean. The plantations must be in the desert.
  • 17. 17 They are not necessarily close to each other. A typical plantation will be from 40 to 80 miles from the shore. In with the water pipeline will be a natural gas pipeline. The natural gas will be used to provide electricity for the residents and businesses in the plantation. A private contractor will build the pipelines. The 40 mile route may pass through areas of sand and rock. A trenching machine built by Trencor of Texas could be used. This machine is powered by two diesel engines and weighs over 200 tons. It cuts a 2 meter wide trench into the sand or rock using a chain-driven belt armed with a series of hardened steel teeth. This method avoids the use of explosives. The trench formed has a neat vertical edge. The spoil produced is already pulverized to small fines and laid in a bank along the side of the trench making it ideal for backfilling the trench and burying the pipeline. It is possible to achieve a half mile a day from the one machine. Figure 11 Desalination Plant and Pipeline Figure 22 Desal plant and pipeline In the trench, the pipeline lies on a bed of backfilled padding material covered to a depth of 600mm. A berm of granular caliche standing a meter above the surface will run along the entire length of the line to add further protection and identify its position. The water pipe should be 900 mm. Flow velocity 1.5 meters/sec. The pump efficiency 85%. The pumping cost $4,377 per day. Source: Ben Makabret Ben@Ada-Tech.com. There will be unmanned valve stations along the route to isolate the line into segments. Monitoring and control using solar powered valve stations can be achieved using fiber optic cable laid along the length of the pipeline in its own buried conduit to provide communications for the water control system. The line will be subdivided at the plantation to provide service to various forest owners with water meters with electronic accounting of the use of water by each user. In the trench would .
  • 18. 18 also be a natural gas pipeline to enable the plantation to generate electric service for the plantation and its residents and commercial properties. Table 09 Pumping Costs for Water WHY THE DESERTS? Why create tree plantations in the Australian deserts? Clearly there are drawbacks to planting trees there. There is not enough water, requiring expensive desalination plants. If you plant trees elsewhere nature will provide the water through rainfall at no cost. There are very few people currently in the deserts. Currently mining companies have to fly workers in week by week since families do not want to live in arid desert areas. However, there are good reasons for opening up the desert areas for tree plantations. 1) The land, today, except for the mining areas and national parks, is basically unused. It is a major part of Australia that could provide billions of dollars of revenue and very desirable places to live. 2) The land would be, basically, free. Anywhere else in Australia the land will be more expensive to purchase. 3) While there is little water, there is lots of sun which is needed for trees. 4) Looking towards the future, opening up the desert can convert Australia into a major economic and environmental power in the world. It is like acquiring a whole new country of 529,000 square miles -- a country bigger than France, Spain, Sweden, Germany, Finland, Norway, Poland, Italy, New Zealand, United Kingdom, Hungary, Portugal and Austria or 100 others. Figure 12 Great Sandy Desert before and after the pilot plantation Plant Number Acres Gallons Used Pumping Cost Pilot 8,300 7,138,000,000 $1,597,605 2nd Plant 16,600 14,276,000,000 $3,195,210 3rd Plant 33,200 28,552,000,000 $6,390,420 4th Plant 44,000 37,840,000,000 $8,469,231 5th Plant 83,000 71,380,000,000 $15,976,050 Total 185,100 159,186,000,000 $35,628,516
  • 19. 19 HOW THE TOWNS SHOULD INTERFACE WITH THE FORESTS As already noted, for the plantations to be a success, we have to make them attractive to people. We want thousands of people to migrate there. To make this happen, we have to design the plantations to be attractive places to live. One method is to integrate the towns with the forests. Here is an illustration of the way this can be done: Figure 13 Integration of Forests and Towns The profits from the desalination plants will occur only if the plantations are successful in
  • 20. 20 growing trees and selling the lumber. As a result of the profits from the desalination plants, two things will undoubtedly happen in Australia: First: Other plantations and desalination plants will be started elsewhere. The deserts are vast. There is plenty of room for more plantations. Second: The residents of the plantations may produce other industries besides growing and selling timber. We cannot predict what they will be, but experience in the world shows that when young settlers arrive in a new area they develop new and unexpected industries. The plantations may become the Silicon Valleys of Australia, or the Research Triangles. What will these forests do for Australia? The people investing in the plantations and desalination plants will generate and gain wealth. In terms of tax revenue, the VAT could generate billions of dollars per year. But the most exciting thing is that the plantations would provide jobs and great places to live for 2 million or more people. Once these plantations get started, they would provide a spirit of adventure for the average Australian similar to the spirit that activated Americans once gold was discovered in California. “Go west, young man” cried Horace Greeley in 1865, and millions did. “Go west, young man” will be the headlines in the Sydney papers and television stations. If you don’t like your job, you can shove it, go west and make more. WHY PAULOWNIA TREES? There are many types of tree that might thrive in the deserts of Australia. We suggest Paulownia for several reasons. They include rapid growth that in just one year attains a height of 10-18 feet and within 6-10 years become a fully grown shade tree that would normally take over 20 years to fully mature. Paulownia Trees have high carbon absorbing rate at 48 lbs. per tree, or 13 tons of CO2 in each acre per year. When you cut down any of these fast growing trees, they are able to regenerate from the stump very fast, resuming growth immediately. Other benefits include, fire resistance at 477 degrees Celsius flash point. They take less years to harvest and do not twist or crack. Paulownia is about 2/3 the weight of the lightest commercial wood grown in the US. It weighs an average of 14 to 19 lbs. per cubic foot. Paulownia is about 1/3 the weight of Oak (44 lbs. p/cubic ft) and half the weight of Pine (30 lbs. p/cubic ft). Paulownia has one of the highest strength to weight ratios of any wood. The strength modus of rupture MOR (psi) of Paulownia is 5740. Paulownia holds nails and screws well and does not require pilot holes to be drilled. Both yellow poplar and white pine split before Paulownia does. Flat head screws can be driven flush with the surface. Plantation grown Paulownia is mostly knot free, making it very consistent. Paulownia has been widely used in the orient for fine furniture, musical instruments, carvings and decorative finishes for over 1000 years. It can be peeled for veneer in 1/16 inch thickness and has been sliced at 1/32 inch. Intricate patterns can be cut with a jig saw or band saw without splitting. Paulownia has been used by carvers in the US. Furniture, doors and windows can be made with close tolerances. All
  • 21. 21 normal finishing materials can be applied and it bonds well with glue. Air-drying takes as little as 30 days. Boards can be kiln dried at high temperatures in as little as 24 hours to 10% to 12% moisture content with no warping. Reported shrinkage from green to oven-dry is only 2.2% radial and 4.0% tangential. Paulownia remains stable during changes in humidity and experiences little shrinkage or expansion compared to most other woods. It is highly durable and resists decay under non- ground contact conditions. The wood is insect resistant. Paulownia is a very good insulator. Paulownia log homes are said to have twice the R factor as pine or oak logs. This temperature resistance serves to give the wood a high fire resistance. Ignition temperature is approximately 400 deg. C. which is almost twice many conventional American hard and soft woods. Paulownia has a light blond appearance and resembles White Ash. It stains well with a variety of colors and can be made to mimic other woods. Once planed a silky luster is revealed. The feel is also very silky. Source: http://www.paulowniasupply.com/paulownia_lumber_characteristics.htm Figure 14 Eight Year Old Paulownia tree
  • 22. 22 REVENUE PER ACRE FROM PAULOWNIA TREES There are no definitive answers to the yield, since Paulownia trees are grown all over the world, including Australia, and sold in varying markets. For this report we are assuming that Paulownias are planted 200 trees to the acre and harvested every eight years and sold at the best price possible, which we are assuming at $64,000 for an acre of trees which works out to $8,000 per acre per year. Here are some figures from around the world: California: It is estimated that for each acre of Paulownia trees planted an average yield of 30,000 board feet of lumber can be expected every 7-10 years. With an average price of $3.00 per board foot, the estimated return on 1 acre of Paulownia trees is $90,000 every 7-10 years. http://www.primevalgardens.com/Environment.html California: The tree can be harvested in five years at 45-50 feet in height yielding a gross profit of about $30,000 per acre per year. http://paulowniamp.files.wordpress.com/2010/05/california-paulownia.pdf Lebanon: Zard said 250 acres can produce 50,000 trees, worth $15 million-$25 million after 10 years "and the beauty of it is when cut down those trees they simply grow back again (no need to replant) at a faster rate this time because the roots are already well established." http://www.upi.com/Top_News/Analysis/Outside-View/2013/02/12/Outside-View-Restoring- Lebanon-to-the-forest-business/UPI-84611360645380/#ixzz2S9zj0gYo Tennessee: What about timber price? Growers report that Paulownia stumpage prices in 2004 were running from $2 to $10 per board-foot. The Smith’s estimate is a conservative $2 to $3 per board-foot, or a return of $12,000 to $18,000 per acre for the 35-year rotation. https://utextension.tennessee.edu/publications/Documents/PB1465.pdf UK: - The Empress's growth rate has an expected average yield of 30,000 board feet of saw timber per acre every 7-10 years. The Empress (Paulownia) also provides valuable spindle poles, cuttings, and cultures exponentially increasing harvests during its growth cycles. At $3.00 per board foot, 30,000 board feet would equal $90,000 of cash value every 7-10 years per acre. http://ecosustainablevillage.com.ip01-web23.net/fast_growing_trees.htm Based on these reports, we have estimated the revenue for the Australian plantations at $8,000 per acre per year which is lower than any of the estimates that we can find. THE WORLD MARKET FOR AUSTRALIAN LUMBER Lumber is actively traded throughout the world. The drivers: China’s demand for high-grade logs used to make dimensional lumber, and the EU/U.S. push for biomass power (wood chips and wood pellets, made from lower-grade round wood and waste wood, for residential, commercial, and industrial
  • 23. 23 applications, including space heating, electricity generation, and co-firing with coal in coal-fired power plants). Already, 60% of the logs that are produced in the world go to China. A major exporter is neighboring Russia–specifically, Siberia, home to the world’s largest forest, for the time being. It is slated for extinction in 20-30 years because of illegal logging–about a third of all logs exported to China are cut illegally–which is controlled by Russian organized crime. Demand for wood from certified sustainable sources will increase dramatically over the next two-to- three years, analysts say. That rules out most African and South American suppliers, which means that wood from Canada and the United States will rise in value. An upturn in the hard-hit North American dimensional lumber markets will further drive demand for wood. Figure 15 Major suppliers of love to China Source: http://news.mongabay.com/2011/0505- china_wood_imports.html According to the FAO, demand for forest products will continue to grow as world population and incomes grow. The most recent FAO projections estimate that by 2030 global consumption of industrial round wood will rise by 60 percent over current levels, to around 2 400 million m3. Substantial rises are also likely in the consumption of paper and paperboard products. Will the world’s forest resources be able to cope? Until the early 1990s, expert assessments were pessimistic, but most experts today no longer foresee a crisis in the supply of wood. Projections of wood consumption are lower now, partly because of lower world population growth. In addition, there have been improvements in forest management and in harvesting and processing technologies, increases in plantation establishment, and an expansion of the role of trees outside forests. Figure 16 Value of logs and timber imports into China. Source: http://news.mongabay.com/2011/0505- china_wood_imports.html
  • 24. 24 For the next decade it is clear that there will be a growing market for Australian lumber in China, at least. Prices will not fall as demand increases. Changes in the conditions of trade are unlikely to be dramatic, as most significant tariff barriers have already been reduced to moderate levels or completely removed – though eco-labeling and environmental regulations will doubtless increase. However, there will be major shifts in the directions of international trade, as developing countries increase their per capita consumption of industrial wood. In some of the richer countries, per capita consumption is currently at least tenfold that of many developing countries. AUSTRALIA’S NEED FOR INCREASED WOOD PRODUCTION Australia’s business community and government have long recognized the need to increase production of wood and wood products. In 2010 the Victorian Association of Forest Industries issued a 10 point development plan. The association noted: “Australia is facing shortages of wood for domestic use, particularly a deficit in saw logs. Without increased domestic production, and with a growing population, this shortage will have to be met from imports, potentially increasing the current $2.1 billion trade deficit in wood products. “The Australia trade deficit in wood products is largely caused by paper and paper product imports. Future shortages of domestic wood supply appear inevitable, particularly for sawn timber products. Most new plantation activity has been aimed at pulpwood (woodchip) production. Like agricultural commodities, woodchips provide valuable export income, regional employment and investment, but more long-rotation saw log investment is needed to meet domestic demand.” Figure 17 Demand and Supply of Wood in Australia (Source: Victorian Association of Forest Industrles)
  • 25. 25 HOW THE DESERT CAN BE CONVERTED TO FOREST For many years, Australia has wanted to have a greater domestic source of lumber. Legislation was passed to encourage domestic wood production. In addition, Australia has been in the forefront of those nations who want to help preserve the future of the planet by reducing the increase in CO2 in the atmosphere. This project of converting the deserts of Australia into productive forests meets most of Australian timber and environmental goals. The first step would be for Australia to pass legislation stating a national goal of making productive use of desert land with four objectives: a. Increasing the amount of domestically produced marketable timber. b. Assisting in reducing the level of CO2 in the atmosphere. c. Providing jobs for millions of Australian citizens d. Increasing the GDP of Australia through planting trees and selling lumber in ways that do not require increased government spending. Once this legislation is passed, the second step would be to conduct a land survey of the Western Australian Deserts with the goals of: 1) Determining where forests could be created in the deserts. 2) Dividing the land into manageable plantations for forest communities. 3) Determining where the desalination plants for each tract should be located. 4) Determining where the roads and pipelines should be located for maximum efficiency. 5) Publishing reports for the public providing all this information in detail. 6) Using Compulsory Acquisition to take title to all the desert land that can be converted into forests so that it can be sold or leased to tree plantations. 7) Setting up a branch of the Western Australian government whose mission is to get the
  • 26. 26 deserts converted into profitable forests by selling or leasing the desert land to private plantations that have the resources and ability and commit themselves to make productive use of the land. This government agency will insure that those who buy or lease the land will achieve specified goals of planting, maintenance, and harvesting timber. The process will take decades. But they will be exciting decades with profits for those who build plantations and desalination plants and healthy forest living for millions. DECISIONS TO BE MADE Review of the information in this paper makes it clear that: 1) Australia can convert its massive deserts into profitable forests at no cost to the government. 2) The conversion will be very profitable for Australia and open up 559 square miles of highly desirable places for millions to live and work. 3) The conversions will eventually double the national income of Australia. 4) There is a current and future demand for the wood from Australia’s forests. 5) The conversion will provide worldwide benefits by capturing billions of tons of CO2 in lumber – thus solving a worldwide atmospheric problem that would otherwise be a burden on future generations. 6) This solution does not require new technology. Desalination is well developed and in wide use worldwide. Modern methods of tree planting and harvesting require no new techniques. 7) The time to act is now: survey the deserts, determine where the plantations and desalination plants should be built, acquire the property through Compulsory Acquisition and lease or sell it to responsible plantations. 8) Needed is government support, and voluntary actions by responsible investors in desalination and plantations. APPENDIX HOW THIS PAPER CAME TO BE WRITTEN My original idea was to create a partial solution to the climate change problem. From my research it became obvious that almost all of the writers on the subject were researchers paid by government grants who conceived their solutions to CO2 buildup as a problem that had to be solved by governmental action. In general, they proposed one or both of two methods: Cap and Trade, or Carbon Dioxide Capture and Sequestration. Both methods involve regulations, legislation and high costs to be incurred by businesses which were to be passed on to consumers. These costs would reduce the national income and the level of living of the people of the areas where these expensive solutions were mandated by government laws and regulations. From my research I was convinced that a partial
  • 27. 27 solution to the problem would be extensive planting of trees – particularly in new areas (such as deserts) where there are no trees today. Rather than having governments spend money planting trees (at the expense of taxpayers), I thought that private persons planting the trees and selling the lumber from trees could be profitable. That being so, the government would not have to spend any money at all. Instead governments could make it easy for and encourage private individuals to plant the trees, and sell the lumber at a profit - paying taxes to the government from their profits. To make sure that the tree plantations met the CO2 sequestration objectives, the government would have to play a role in the process: maintaining law and order, deciding where the trees would be planted, where the water would come from and how the water could be produced. I first focused on the Sahara Desert – the largest in the world. After research, I concluded that the present political situation in the many countries of the Sahara is such that creating desalination plants and planting trees there would not be a success. In general, law and order does not prevail in these areas today. Investors would not be willing to invest in an area where they could not be sure that the trees would not be chopped down for firewood, or that the water and pipelines would not be stolen. Australia, on the other hand, would be ideal for such a project. Law and order prevails. The government is concerned about climate change, and would be likely to encourage private investment to create forests in the desert. That does not mean that getting this project underway will be easy. Many people will be concerned at the creation of desalination plants designed to water trees – rather than to feed people. But the environmental benefits will appeal to many Australians. The profits to be gained will also appeal to those who look for a bright economic future for Australia. ENVIRONMENTAL IMPLICATIONS OF THE FORESTS There is no question that the level of carbon dioxide in the world atmosphere is growing and will continue to grow. The levels of CO2 reported by the Mauna Loa observatory in Hawaii grew from 315 molecules of CO2 per million in 1960 to 396 today – a growth of more than 25% in the last 80 years. Figure 18 CO2 in the atmosphere
  • 28. 28 The world’s air is 78% Nitrogen and 21% Oxygen with tiny amounts of other gasses -- only 0.039% is CO2. Why is that a problem? Scientists say it is a problem because CO2 is a “greenhouse gas” meaning that it traps heat from the sun which is being reflected back into space (just as the glass in a greenhouse keeps the heat from escaping). The greenhouse gasses are water vapor, carbon dioxide, methane, nitrous oxide, and ozone. They all trap some of the escaping heat. This is good. Without them the temperature of the earth might be -19 C degrees instead of what it is now -- an average +14 C degrees today. Water vapor is the most powerful of all the greenhouse gasses. It has the most control over the temperature of the earth. When it gets hot, more water evaporates (mainly from the huge oceans) leading to clouds. Clouds block the rays of the sun and can lead to rain, and snow. Through this method water vapor has kept the earth at a livable temperature for millions of years. The CO2 buildup recently is worth worrying about. The way the atmosphere works, when coal, oil or natural gas is burned, CO2 is released. It does not matter if the burning takes place in China or Italy, the CO2 quickly affects everyone’s atmosphere including Australia. For this reason, many nations including the US and Australia have taken steps to reduce the CO2 put into the atmosphere. The main methods of CO2 reduction have been Cap and Trade and Carbon Capture and Storage (CSS). As discussed later in this paper, both of these methods are expensive. Billions of dollars has been spent and will continue to be spent in the attempt to reduce the amount of CO2 in the atmosphere using these two methods. In spite of all the spending, the level of CO2 in the atmosphere continues to rise and will keep rising. Why? Because the burning of coal, oil and natural gas has become essential to maintaining and increasing our modern way of life: electricity, transportation, heating and air conditioning. Chinese want automobiles and electricity. Indians do too. Almost everyone wants the type of lifestyle that Australians and Americans have. Cap and Trade and CSS in Australia and Europe will reduce the amount of CO2 that these areas add to the atmosphere, but will never compensate for the CO2 that will come from China, India and the rest of the world. There is one thing that can make a difference: Forests in Australia. Every acre of Paulownia trees grown there will capture 13 tons of CO2 every year and turn it into lumber. Eventually, when 80% of the Australian desert is converted to forests some time later in this century, four billion tons of CO2 per year will be captured from the atmosphere and converted into permanent wood products. The really great thing about this method of solving the CO2 problem is that it will be profitable! No government will have to spend any money. No industry will have to convert to more expensive methods of producing electricity or products to reduce the CO2 emissions. The nightmare of CO2 regulations will be over. THE WRONG WAY TO PLANT TREES IN THE DESERT An article in Climate Change (August 2009) by Leonard Ornstein, Igor Aleinov, and David Rind was entitled: “Irrigated afforestation of the Sahara and Australian Outback to end global warming”. They began the article by stating that: ”Each year, irrigated Saharan- and Australian-desert forests could sequester amounts of atmospheric CO2 at least equal to that from burning fossil fuels.” How will this be paid for? They suggested adding about $1 to the per-gallon pump-price to
  • 29. 29 cover the irrigation costs from using reverse osmosis (RO), desalinated, sea water. They suggested that this technology “was economically competitive with the currently favored, untested, power-plant Carbon Capture (and deep underground, or under-ocean) Sequestration (CCS).” The bulk of their article concerns wind and weather flows around the world. They did not deal with the political and economic problems: how do you get the nations of the world to add $1 to the pump price of their gasoline and contribute the revenue to a multi-national body that would be producing the fresh water and planting the trees in Africa and Australia. They explained the gasoline tax as being practical because, “The capital costs of the forests will exceed the revenues from any reasonable carbon tax and traded carbon credits. And in the Sahara, the necessary foreign capital-windfall would be spread across eight to nine underdeveloped nations. The political distribution will be difficult. Even for an Australian forest, the conflicts between concerned interests (indigenous residents, ranchers, farmers, conservationists, foreign investors, etc.) may be substantial.” Like most climate change enthusiasts, they assumed that their solution would be implemented using taxes and government spending by developed nations. Missing from the article:  The political problems of building forests in a dozen different countries where law and order may not be sufficient to protect the trees, desalination plants, pipelines and water.  Any consideration of the possibility that the project might be conducted as a privately financed profit making enterprise, under which there would be no need for increased gasoline taxes or any taxes at all. They concluded that: “Such multi-trillion-dollar projects provide lots of motivation for scientifically creative entrepreneurs—as well as for swindlers. International mechanisms for monitoring and managing (without mangling or strangling) such projects will be essential. This may be the most difficult hurdle…. These capital costs of mitigation will be borne mainly by the citizens of the developed world. They must be weighed, not only against those of CCS, but as a kind of preemptive disaster relief – or repair of the ‘commons’—to avoid the future, and as yet not easily estimated costs of vast coastal inundations, desertification of crop- and range-lands, drying up of water supplies; more intense tropical storms; the acidification of the oceans and loss of biodiversity. The integrated costs of coping with such changes could approach those of recovery following an asteroid impact or a nuclear war. “These are ecumenical, ethical, altruistic issues. How we deal with them depends upon how much value ordinary people (not economists or politicians) place on the welfare of their descendants; self versus children, grand-children, etc. The results of economic and policy calculations are meaningless unless we agree upon the magnitude to assign to this value.” The type of reasoning in this article is in the mainstream of the “Climate Change” community. For many years they have been funded by major government grants. Their solutions all require increased government regulations, taxes and spending. Their proposals assume that any solution will be carried out and paid for by the developed nations operating from a sense of guilt that they are rich and the other nations are poor.
  • 30. 30 In the US the GAO reported in 2011 that annual federal climate spending has increased from $4.6 billion in 2003 to $8.8 billion in 2010, amounting to $106.7 billion over that period. The money was spent for: 1) Technology to reduce greenhouse gas emissions, 2) Science to understand climate changes, 3) International assistance for developing countries, and 4) Wildlife adaptation to respond to actual or expected changes. The EPA is issuing new regulations based on the agency’s Endangerment Finding proclaiming CO2 to be a pollutant. The Small Business Administration estimates that compliance with these regulations will cost the U.S. economy more than $1.75 trillion per year — about 12%-14% of GDP. In April of 2013 the World Economic Forum announced that the world must spend an extra $700 billion a year to curb its addiction to fossil fuels. The Green Growth Action Alliance, which compiled the study on behalf of the WEF, said the extra spending was needed to promote other forms of energy generation and greater efficiency in sectors including building, industry and transport. CONCLUSIONS ON CARBON DIOXIDE SPENDING All over the world, developed nations are being pushed into spending billions of dollars on cap and trade and carbon dioxide capture and storage. All these efforts are based on one central idea: there is a worldwide problem. The underdeveloped world is not able to deal with it. We are all living in the same world with the same atmosphere. Therefore it is considered incumbent on the developed world like the US, Europe, Japan and Australia to spend billions on a futile effort to reduce the use of fossil fuels or to capture and store CO2 in some way. Nations that do this will double their cost of electricity, and the cost of making most products. They will reduce their citizen’s level of living. They will build up huge taxes and huge debts. But, realistically, this is not necessary. There is a better way – a way that does not cost billions of dollars. It creates billions of dollars in revenue. Australia can lead the way. Australia can show the world that by converting deserts to forests, billions of tons of CO2 can be absorbed from the world atmosphere, and converted into solid lumber which – if it is not burned – will reduce the CO2 in everyone’s atmosphere – and make a huge profit! So, there are three reasons for converting the deserts to forests: 1) Help to solve the world CO2 problem. 2) Improve Australia’s national income. 3) Give Australians a whole new country to live in and enjoy. WILL THE SAHARA NATIONS ADOPT FORESTATION? As already noted, a similar conversion of deserts to forests is impossible in the Sahara today. Since the “Arab Spring” most of the nations of the Sahara have new governments that are unable, at present, to
  • 31. 31 control their people and territory sufficiently to create an environment which would encourage foreign investment. This situation may not last forever. Once Australia has shown the way, the world will take notice of the tremendous profits that can come from desalination and plantations. It will take Australia decades to complete the job. During those decades it is certainly possible that the political problems in one or more of these countries may be resolved so that they can emulate the Australian example. Just as Turkey, Saudi Arabia and the Gulf states have become responsible stewards of private investment, it is possible that in the decades to come one or more of Algeria, Chad, Egypt, Libya, Mali, Mauritania , Morocco, Niger, Sudan, or Tunisia may emerge as stable, democratic nations which welcome, encourage and support private enterprise. If and when this happens, the world C02 crisis may be ended forever at no cost to anyone, and profits for all. FINANCIAL TABLES FOR PLANTATIONS Table 10 2nd Plantation financial plan 2nd Plantation 16,600 Acres Shares Sold Price Capital Raised Expenses and Profit from 16000 Acres 1,400,000 $100 $140,000,000 Expense Category Number Rate Years Dollars Staff (Acres per worker = 200) 80 $50,000 8 $32,000,000 Water 16000 $1,720 8 $220,160,000 Seedlings 16000 $800 1 $12,800,000 Fertilizer 16000 $230 8 $29,440,000 Equipment 16000 $300 8 $38,400,000 Miscellaneous 16000 $100 8 $12,800,000 $50 million Bank Loan @ 7% $50,000,000 7% 8 $28,000,000 Total 8 year costs $335,200,000 Depreciation of Equipment 20 $1,920,000 Lumber Sales After 8 years 16000 $8,000 8 $1,024,000,000 Fees residential & Commercial 600 $30,000 8 $144,000,000 Total Revenue $1,168,000,000 VAT 10% $116,800,000 Earnings after 8 years $1,049,280,000 Profit Tax 30% $314,784,000 Net Earnings After Tax $734,496,000 Earnings Per Share $524.64 Value Per Share after 8 years (12 X) $6,295.68
  • 32. 32 Table 11 3rd Plantation Financial Plan Table 12 4th Plantation Financial Plan 3rd Plantation 33,200 Acres Shares Sold Price Capital Raised Expenses and Profit from 32,400 Acres 1,400,000 $100 $140,000,000 Expense Category Number Rate Years Dollars Staff (Acres per worker = 200) 162 $50,000 8 $64,800,000 Water 32,400 $1,720 8 $445,824,000 Seedlings 32,400 $800 1 $25,920,000 Fertilizer 32,400 $230 8 $59,616,000 Equipment 32,400 $300 8 $77,760,000 Miscellaneous 32,400 $100 8 $25,920,000 $50 million Bank Loan @ 7% $50,000,000 7% 8 $28,000,000 Total 8 year costs $650,080,000 Depreciation of Equipment 20 $3,888,000 Lumber Sales After 8 years 32,400 $8,000 8 $2,073,600,000 Fees residential & Commercial 800 $30,000 8 $192,000,000 Total Revenue $2,265,600,000 VAT 10% $226,560,000 Earnings after 8 years $1,385,072,000 Profit Tax 30% $415,521,600 Earnings After Tax $969,550,400 Earnings Per Share $692.54 Value Per Share after 8 years (12 X) $8,310.43
  • 33. 33 Table 13 5th Plantation Financial Plan 4th Plantation 44,000 Acres Shares Sold Price Capital Raised Expenses and Profit from 42,000 Acres 1,400,000 $100 $140,000,000 Expense Category Number Rate Years Dollars Staff (Acres per worker = 200) 220 $50,000 8 $88,000,000 Water 42,000 $1,720 8 $577,920,000 Seedlings 42,000 $800 1 $33,600,000 Fertilizer 42,000 $230 8 $77,280,000 Equipment 42,000 $300 8 $100,800,000 Miscellaneous 42,000 $100 8 $33,600,000 $50 million Bank Loan @ 7% $50,000,000 7% 8 $28,000,000 Total 8 year costs $838,400,000 Depreciation of Equipment 20 $5,040,000 Lumber Sales After 8 years 42,000 $8,000 8 $2,688,000,000 Fees residential & Commercial 2000 $30,000 8 $480,000,000 Total Revenue $3,168,000,000 VAT 10% $316,800,000 Earnings after 8 years $2,007,760,000 Profit Tax 30% $602,328,000 Earnings after Tax $1,405,432,000 Earnings Per Share $1,003.88 Value Per Share after 8 years (12 X) $12,046.56
  • 34. 34 FINANCIAL TABLES FOR DESALINATION PLANTS Note: At the beginning, there will be one water company that builds five increasingly large plants using the same original capital over a period of 40 to 50 years. The water company will have lasting contracts to supply water to plantations of increasing size which are constructed to use this water. Table 14 2nd Desalination Plant Financial Plan 5th Plantation 83,000 Acres Shares Sold Price Capital Raised Expenses and Profit from 83,000 Acres 1,400,000 $100 $140,000,000 Expense Category Number Rate Years Dollars Staff (Acres per worker = 200) 400 $50,000 8 $160,000,000 Water 80,000 $1,720 8 $1,100,800,000 Seedlings 80,000 $800 1 $64,000,000 Fertilizer 80,000 $230 8 $147,200,000 Equipment 80,000 $300 8 $192,000,000 Miscellaneous 80,000 $100 8 $64,000,000 $50 million Bank Loan @ 7% $50,000,000 7% 8 $28,000,000 Total 8 year costs $1,564,000,000 Depreciation of Equipment 20 $9,600,000 Lumber Sales After 8 years 80,000 $8,000 8 $5,120,000,000 Fees residential & Commercial 3000 $30,000 8 $720,000,000 Total Revenue $5,840,000,000 VAT 10% $584,000,000 Earnings after 8 years $3,682,400,000 Profit Tax 30% $1,104,720,000 Earnings after Tax $2,577,680,000 Earnings Per Share $1,841.20 Value Per Share after 8 years (12 X) $22,094.40
  • 35. 35 Table14 3rd Desalination Plant Financial Plan 2 Second Desal Plant 8 year results Supports: 16,600 Acres Costs Each/Per Year Years Cost/Revenue Business Loan $100,000,000 @ 6% $6,000,000 8 $48,000,000 Cost to Build Plant + Pipelines $327,600,000 1 $327,600,000 Water Sales Pilot $13,760,000 8 $110,080,000 Water Sales 2nd Plant $27,520,000 8 $220,160,000 VAT $41,280,000 10.00% $4,128,000 Running Costs $5,906,300 8 $47,250,400 Pumping Costs $3,195,210 8 $25,561,680 Maintenance & Staff $2,000,000 8 $16,000,000 Net Revenue 2nd Plant $19,613,700 8 $127,219,920 Net Revenue Pilot Plant $13,760,000 8 $62,829,600 Depreciation of capital equipment $327,600,000 20 $16,380,000 Gross Earnings $173,669,520 Profit Tax 30.00% $52,100,856 Net Earnings $121,568,664 Earnings per share 1,050,000 $116 Stock Value (12 X Earnings) $1,389.36 3 Third Desal Plant 8 year results Supports: 43,000 Acres Costs Each/Per Year Years Cost/Revenue Business Loan $200,000,000 @ 6% $12,000,000 8 $96,000,000 Cost to Build Plant + Pipelines $325,600,000 1 $325,600,000 Water Sales Pilot $13,760,000 8 $110,080,000 Water Sales 2nd Plant $27,520,000 8 $220,160,000 Water Sales 3rd Plant $55,728,000 8 $445,824,000 VAT $97,008,000 10.00% $9,700,800 Running Costs $11,808,132 8 $94,465,056 Pumping Costs $6,390,420 8 $51,123,360 Maintenance & Staff $3,500,000 8 $28,000,000 Net Revenue 3rd Plant $40,419,868 8 $300,235,584 Net Revenue 2nd Plant $19,613,700 8 $156,909,600 Net Revenue from pilot plant $13,760,000 8 $62,829,600 Depreciation of capital equipment $653,200,000 20 $32,660,000 Gross Earnings $487,314,784 Profit Tax 30.00% $146,194,435 Net Earnings $341,120,349 Earnings per share 1,050,000 $325 Stock Value (12 X Earnings) $3,898.52
  • 36. 36 Table 15 4th Desalination Financial Plan Table 16 5th Desalination Financial Plan 4 Fourth Desal Plant 8 year results Supports: 42,000 Acres Costs Each/Per Year Years Cost/Revenue Business Loan $200,000,000 @ 5% $12,000,000 8 $96,000,000 Cost to Build Plant + Pipelines $401,000,000 1 $401,000,000 Water Sales Pilot $13,760,000 8 $110,080,000 Water Sales 2nd Plant $27,520,000 8 $220,160,000 Water Sales 3rd Plant $55,728,000 8 $445,824,000 Water Sales 4th Plant $72,240,000 8 $577,920,000 VAT $1,353,984,000 10% $135,398,400 Running Costs $15,797,366 8 $126,378,928 Pumping Cost $8,469,231 8 $67,753,851 Maintenance and Staff $4,600,000 8 $36,800,000 Net Revenue 4th Plant $346,987,221 Net Revenue 3rd Plant $300,235,584 Net Revenue 2nd Plant $156,909,600 Net Revenue from pilot plant $62,829,600 Depreciation of capital equipment $1,054,200,000 20 $52,710,000 Gross Earnings $814,252,005 Profit Tax 30.00% $244,275,602 Net Earnings $569,976,404 Earnings per share 1,050,000 $543 Stock Value (12 X Earnings) $6,514.02
  • 37. 37 REFERENCES 1. http://www.saudiaramcoworld.com/issue/196003/trees.in.the.desert.htm 2. http://www.jpost.com/Green-Israel/People-and-The-Environment/Growing-and-Planting-Trees-in-the-Desert 3 . http://pipelinesinternational.com/news/pipeline_construction_companies_handling_the_heat_in_desert_terrain/0415 15/ 4. http://www.finetrees.com/faq/how-much-water-do-trees-need 5. Proctor, Noble S.; Lynch, Patrick J. (1993). Manual of Ornithology. Yale University Press. ISBN 0300076193 6. Pacific Pump and Power Pumps and Generators www.pacificpumpandpower.com 7. Clatterbuck, Wayne and Hodges, Donald Tree crops for Marginal Farmland University of Tennessee 2004 8. http://www.lenntech.com/processes/desalination/general/desalination-key-issue.htm 5 Fifth Desal Plant 8 year results Supports 83,000 Acres Costs Each/Per Year Years Cost/Revenue Business Loan $200,000,000 @ 6% $12,000,000 8 $96,000,000 Cost to Build Plant + Pipelines $719,530,000 1 $719,530,000 Water Sales Pilot $13,760,000 8 $110,080,000 Water Sales 2nd Plant $27,520,000 8 $220,160,000 Water Sales 3rd Plant $55,728,000 8 $445,824,000 Water Sales 4th Plant $72,240,000 8 $577,920,000 Water Sales 5th Plant $137,600,000 8 $1,100,800,000 VAT $2,454,784,000 10% $245,478,400 Running Costs $28,504,273 8 $228,034,184 Pumping Cost $15,976,050 8 $127,808,400 Maintenance and Staff $5,000,000 8 $40,000,000 Net Revenue 5th Plant $104,095,727 8 $739,957,416 Net Revenue 4th Plant $346,987,221 Net Revenue 3rd Plant $300,235,584 Net Revenue 2nd Plant $156,909,600 Net Revenue from pilot plant $62,829,600 Depreciation of capital equipment $1,773,730,000 20 $88,686,500 Gross Earnings $1,272,754,521 Profit Tax 30.00% $381,826,356 Net Earnings $890,928,165 Earnings per share 1,050,000 $849 Stock Value (12 X Earnings) $10,182.04
  • 38. 38 9. "A fresh start for Yuma desalting plant" Los Angeles Times, May 1, 2010 10. Anita Kelleher How can everyone have sufficient clean water without Conflict? Journal of Futures Studies June 2012 16(4): 3-20 11. Tamim Younos The Economics of Desalination Journal of Contemporary Water Research and Education Issue 132 Pages 39-45 December 2005 12. http://pipeliner.com.au/news/water_pipielines_quenching_australias_thirst/001031/ 13. http://pipeliner.com.au/news/keeping_pipelines_on_the_level_dr_bassem_youssef/082209/ 14. Desalination without brine discharge Nichol-Andre Berdelle PROTOTYPE-CREATION.DE 15. Timber Industry Action Plan Department of Primary Industries December 2001 customer service@dpi.vic.gov.au 16. 10,000 gal/day Container Desalination Equipment Water Siyuan Group Co Ltd 17. http://www.primevalgardens.com/environment.html 18. Sedeer EK-Showk The Paulownia Tree An Alternative for sustainable Forestry http://www.cropdevelopment.org 19. Alan Durning Cap and Trade 101 July 2009 Sightline Institute 20. T. J. Blom Carbon Dioxide in Greenhouses December 2002 http://omafra.gov.on.ca/english/crops/facts/00- 077.htm 21. Jeremy David The cost of Carbon Capture MIT USDE Award DE-FG02-99ER62748 22. Leonard Ornstein Irrigated Afforestation of the Sahara and Australian Outback to end global warming. Climate Change (2009) 97:409-437 DOI 10.1007/s10584-009-9626-y 23. Carbon Capture and Storage Wikipedia April 2013 24. Desalination and Industrial Water Treatment Saltworks http://saltworkstech.com/ 25. Tom Nesbit of Forest Research Water Use by Trees April 2005 Forestry Commission Edinburgh UK 26. Roy M Sachs Maximum Biomass Yields on Prime Agricultural Land California Agriculture November- December 1988 27. Ashkelon Seawater Reverse Osmosis Plant 2006 http://www.water-technology.net/projects/israel/ 28. David Thompson Plantations and Wood Supply http://www.plantations2020.com.au 29. Lori Marsh Virginia Tech Pumping Water from Remote Locations for Livestock Watering. 30. "Desalination" (definition), The American Heritage Science Dictionary, Houghton Mifflin Company, via dictionary.com.. 31. "Australia Aids China In Water Management Project." People's Daily Online, 2001-08-03, via english.people.com.cn. . 32. Fischetti, Mark (September 2007). "Fresh from the Sea". Scientific American 297 (3): 118–119. doi:10.1038/scientificamerican0907-118. PMID 17784633. 33. "Finding Water in Mogadishu"IPS news item 2008 34. "Energy Efficient Reverse Osmosis Desalination Process", p343 Table 1, International Journal of Environmental Science and Development, Vol. 3, No. 4, August 2012 35. "Analysis of the Energy Intensity of Water Supplies for West Basin Municipal Water District", Table on p4, Robert C. Wilkinson Ph.D, March 2007 36. "U.S.Electricity Consumption for Water Supply & Treatment", p1-4 Table 1-1, Electric Power Research Institute (EPRI) Water & Sustainability (Volume 4), 2000 37. "Seawater Desalination", p12 et seq, Menachem Elimelech, 2012 38. "Optimizing Lower Energy Seawater Desalination", p6 figure 1.2, Stephen Dundorf at the IDA World Congress November 2009 39. "Membrane Desalination Power Usage Put In Perspective" , American Membrane Technology Association(AMTA) April 2009 40. "ENERGY REQUIREMENTS OF DESALINATION PROCESSES", Encyclopedia of Desalination and Water Resources (DESWARE), 41. Lisa Henthorne (November 2009). "The Current State of Desalination". International Desalination Association. 42. Opportunities aplenty | H2O Middle East. H2ome.net (2012-02-06). 43. Shoaiba Desalination Plant. Water Technology. 44. Fritzmann, C; Lowenberg, J; Wintgens, T; Melin, T (2007). "State-of-the-art of reverse osmosis desalination". Desalination 216: 1–76. doi:10.1016/j.desal.2006.12.009. 45. Osman A. Hamed (2005). "Overview of hybrid desalination systems – current status and future prospects". Desalination 186: 207–214. doi:10.1016/j.desal.2005.03.095.
  • 39. 39 46. B.M. Misra and J. Kupitz (2004). "The role of nuclear desalination in meeting potable water needs in water scarce areas in the next decades". Desalination 166: 1–9. doi:10.1016/j.desal.2004.06.053. 47. Nuclear Desalination. 48. Heinz Ludwig (2004). "Hybrid systems in seawater desalination – practical design aspects, present status and development perspectives". Desalination 164: 1–18. doi:10.1016/S0011-9164(04)00151-1. 50. Tom Harris (2002-08-29) How Aircraft Carriers Work. Howstuffworks.com. 51. "Nuclear Desalination". World Nuclear Association. January 2010. 52. Barlow, Maude, and Tony Clarke, "Who Owns Water?" The Nation, 2002-09-02, via thenation.com. 53. Yuan Zhou and Richard S.J. Tol. "Evaluating the costs of desalination and water transport." (Working paper). Hamburg University. 2004-12-09. 54. Desalination is the Solution to Water Shortages, redOrbit, May 2, 2008 55. Sitbon, Shirli. "French-run water plant launched in Israel," European Jewish Press, via ejpress.org, 2005-12-28. 56. "Black & Veatch-Designed Desalination Plant Wins Global Water Distinction," (Press release). Black & Veatch Ltd., via edie.net, 2006-05-04. 57. Perth Seawater Desalination Plant, Seawater Reverse Osmosis (SWRO), Kwinana. Water Technology. 58. "Sydney desalination plant to double in size," ABC News (Australian Broadcasting Corporation), via abc.net.au, 2007-06-25. 59. Australia Turns to Desalination by Michael Sullivan and PX Pressure Exchanger energy recovery devices from Energy Recovery Inc. An Environmentally Green Plant Design. Morning Edition, National Public Radio, June 18, 2007 60. Fact sheets, Sydney Water http://sydneywaternews.com.au/tag/factsheets-2/ 61. Water prices to rise and desalination plant set for Port Stanvac|Adelaide Now. News.com.au (2007-12-04). 62. Desalination plant for Adelaide. ministers.sa.gov.au. December 5, 2007 63. Bernard Humphreys AdelaideNow readers mostly back desalination plant. AdelaideNow. December 6, 2007 64. Kranhold, Kathryn. (2008-01-17) Water, Water, Everywhere... – WSJ.com. Online.wsj.com. 35. Desalination gets a serious look – Friday, March 21, 2008|2 a.m.. Las Vegas Sun. 36. Desalination: A Component of the Master Water Plan . tampabaywater.org 65. Hydro-Alchemy, Forbes, May 9, 2008 66. The Arid West—Where Water Is Scarce – Desalination—a Growing Watersupply Source, Library Index 67. Heather Cooley, Peter H. Gleick, and Gary Wolff DESALINATION, WITH A GRAIN OF SALT. A California Perspective, Pacific Institute for Studies in Development, Environment, and Security, June 2006 ISBN 1-893790-13- 4 68. Australia Turns to Desalination Amid Water Shortage. NPR. 69. Lattemann, Sabine; Höpner, Thomas (2008). "Environmental impact and impact assessment of seawater desalination". Desalination 220: 1. doi:10.1016/j.desal.2007.03.009. 70. Desalination without brine discharge – Integrated Biotectural System, by Nicol-André Berdellé, 02.20.2011 71. Gleick, Peter H., Dana Haasz, Christine Henges-Jeck, Veena Srinivasan, Gary Wolff, Katherine Kao Cushing, and Amardip Mann. (November 2003.) "Waste not, want not: The potential for urban water conservation in California." (Website). Pacific Institute.