More Related Content
Similar to FOC UURAF Final
Similar to FOC UURAF Final (20)
FOC UURAF Final
- 1. RESEARCH POSTER PRESENTATION DESIGN © 2012
www.PosterPresentations.com
Sex, physical aggression, and fear of crime have consistently
been associated with gun ownership2,4,5,6,8
However, research is less consistent in identifying moderators
that elaborate on the relationship between fear of crime and gun
ownership
While sex, physical aggression, and fear of crime have been
independently associated with gun ownership, their interactions
must be investigated to better understand which factors and in
what combination can predict gun ownership
Aim: To investigate whether sex and physical aggression
moderate the relationship between fear of crime and gun
ownership
BACKGROUND
HYPOTHESES Summary of Findings
Main Effects
A moderated logistic regression analysis revealed that fear of
crime and sex were significant predictors of gun ownership.
Interactions
However, the significant interactions between (1) fear of crime
and sex and (2) sex and physical aggression moderates these
findings.
Implications
Our results illustrate the unique role that fear of crime, sex, and
physical aggression play in the likelihood of owning a gun.
This project also demonstrates the value in analyzing predictors
and moderators of gun ownership in future research and practice.
Limitations
The current sample is quite homogenous and thus our results
may only be generalizable to individuals in similar neighborhood
contexts (e.g. those living in at risk neighborhoods).
Future research should examine other populations living in
different economic situations to determine whether these results
are robust and generalizable.
REFERENCES
1 Burt, S. A., and Donellan, M.B. Development and Validation of the Subtypes of Antisocial Behavior
Questionnaire. Aggressive Behavior, 2009. 35: p. 376-398.
2 DeFronzo, J. Fear of Crime and Handgun Ownership. Criminology, 1979. 17 (3): p. 331-339.
3 Gorman-Smith, D., P.H. Tolan and D. Henry, A developmental-ecological model of the relation of
family functioning to patters of delinquency. Journal of Quantitative Criminology, 2000. 16 (2): p. 169-
198.
4 Hauser, W., and Kleck, G. Guns and Fear: A One-Way Street? Crime and Delinquency, 2013. 59 (2): p.
271-291.
5 Hill, G.D., Howell, F.M., and Driver, E.T. Gender, Fear and Protective Handgun Ownership.
Criminology, 1985. 23 (3): p. 541-552).
6 Longmire, D.R., and Flanagan, T.J. Americans View Crime and Justice: A National Public Opinion
Survey. Thousand Oaks: SAGE Publications Inc. 1996.
7 Schiedow, A.J., et al., Family and community characteristics: Risk factors for violence exposure in
inner-city youth. Journal of Community Psychology, 2001. 29: p. 345-360.
8 Williams, J.S., and McGrath, J.H. Why People Own Guns. Journal of Communication, 1976. p.22-30.
H1: Women will have higher levels of fear of crime, lower levels
of physical aggression, and a lower incidence of gun ownership.
H2: Independently, sex and physical aggression will each
moderate the relationship between fear of crime and gun
ownership.
H3: However, the combination of physical aggression and sex
will also moderate the relationship between fear of crime and
gun ownership.
• Physical aggression will strengthen the relationship between
fear of crime and gun ownership in men, but not women.
Department of Psychology, Michigan State University
Ashlyn Lowe, Brooke Slawinski, B.A., & S. Alexandra Burt. Ph.D.
Do Sex and Physical Aggression Moderate the Relationship
Between Fear of Crime and Gun Ownership?
METHODOLOGY
Participants
N=1,729 participants living in disadvantaged neighborhoods
(poverty rates > 10.5%) across the state of Michigan
• Age: M=52.39, SD=15.69
• 66% female
• Racial/ethnic breakdown:
• Firearm ownership: 47% (Y/N)
– Rifle 33%
– Shotgun 33%
– Hand gun 25%
Measures
Physical Aggression Scale of the Subtypes of Antisocial
Behavior Questionnaire1
• Participants report on the frequency with which they
committed physically aggressive behaviors
• 11 behaviors
• Rate frequency: 1 (never) to 5 (nearly all the time)
The Fear of Crime Questionnaire3
• Participants reported on their level of fear of being the victim
of a violent crime in their neighborhood or home and how this
fear influences their behaviors
• 13 items
• Rate fear of victimization: 1 (not fearful) to 4 (very fearful), 4
questions
• Rate change in behavior: 0 (no) or 1 (yes), 9 questions
0
0.1
0.2
0.3
0.4
0.5
0.6
0.7
0.8
0.9
1
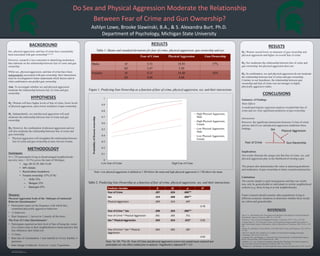
Low Fear of Crime High Fear of Crime
Probabilityoffirearmownership
High Physical Aggression,
Male
High Physical Aggression,
Female
Low Physical Aggression,
Male
Low Physical Aggression,
Female
CONCLUSIONS
H1: Women scored lower on measures of gun ownership and
physical aggression and higher on overall fear of crime.
H2: Sex moderates the relationship between fear of crime and
gun ownership, but physical aggression does not.
H3: In combination, sex and physical aggression do not moderate
the relationship between fear of crime and gun ownership.
Contrary to our hypothesis, the relationship between gun
ownership and fear of crime was not stronger in highly
physically aggressive males.
RESULTS
RESULTS
Fear of Crime Gun Ownership
Sex Physical Aggression
Predictor Variable B SE p R2
Fear of Crime .207 .024 .000**
Sex .419 .068 .000**
Physical Aggression .009 .014 .497
0.78
Fear of Crime * Sex .098 .024 .000**
Fear of Crime * Physical Aggression .001 .005 .751
Sex * Physical Aggression .033 .014 .015* 0.92
Fear of Crime * Sex * Physical
Aggression
.004 .005 .387
0.92
Table 2: Predicting Gun Ownership as a function of fear of crime, physical aggression, sex, and their interactions.
Note: *p<.05, **p<.01. Fear of Crime and physical aggression scores were grand-mean centered and
participant sex was effect coded prior to analysis. Nagelkerke’s adjusted R2=.132.
Figure 1: Predicting Gun Ownership as a function of fear of crime, physical aggression, sex, and their interactions
Note: Low physical aggression is defined as 1 SD below the mean and high physical aggression is 1 SD above the mean.
Fear of Crime Physical Aggression Gun Ownership
Males M 3.53 18.93 57%
SD 3.47 5.50
Females M 4.31 16.40 43%
SD 4.04 4.68
Table 1: Means and standard deviations for fear of crime, physical aggression, gun ownership and sex.