User and market study for milking machine
•
1 like•444 views

This is a market research project carried by me for milking machine in Gujarat.

Recommended
Recommended
More Related Content
Similar to User and market study for milking machine
Similar to User and market study for milking machine (20)
More from Anuj Verma
Recently uploaded
Recently uploaded (20)
User and market study for milking machine
- 1. 1 User and Market study for milking machine BY ANUJ VERMA (P35116) Development Internship Segment PRM 35 Submitted to SICKLE INNOVATIONS Faculty Guide: Prof. PREETI PRIYA 19-11-2015
- 2. i ACKNOWLEDGEMENT There are some events in our lives which happen as a result of culmination of the efforts, guidance and assistance of several people. This acknowledgement is an expression of gratitude to all those people who came forward whenever they were needed at the opportune time to make our lives richer by their help and inputs. I am extremely grateful to Sickle Innovations and IRMA for giving me the opportunity to work on User and Market study for milking machine project. I would like to thank my reporting officer Mr. Nitin Gupta for his continuous support and guidance and Mr. Valay Patel for his unconditional support. We sincerely thank all our respondents and villagers who helped me. This study would not have been possible without their support and patience, as well as their overtness in discussing issues and in answering our questions I take this opportunity to thank Professor Preeti Priya for providing guidance and help during the course of the project. I would like to express my gratitude to the DIS committee of IRMA for endowing me with this opportunity to learn. Anuj Verma (P35116)
- 3. ii EXECUTIVE SUMMARY Tittle : User and Market study for milking machine Organization : Sickle Innovations Reporting Officer : Mr.Nitin Gupta Faculty Guide : Prof.:Preeti Priya Participant’s Name : Anuj Verma India is the largest producer of milk in the world with 3 times contribution to cattle population and 1.5 times to milk production of USA. The penetration of milking machine in Indian dairy is quite low and the extensive reasons resulting to low product coverage are awareness paucity, misapprehension and low cost effectiveness of the product. In India, average size of cattle holding is very meagre and so owning the milking machine would not prove to be a thrifty deal. Sickle Innovation was founded with the aim to aid and assist impoverished dairy farmers. At present, Sickle innovation is in manufacturing and development work of milking machine for IDMC. IDMC aims to assist the true need of those dairy farmers, who lacks fund for availing the product. The preeminent objective of this product is to execute market and user study for milking machine coupled with determination of potential buyer’s characteristics. Qualitative and quantitative methods have been used to deduce the current market situation of product. Primary sources of data collection include questionnaire surveys, structured and semi-structured interviews, and personal observations. Qualitative study has been conducted in villages of Anand while quantitative in four districts of Gujarat, comprised of 9 villages. Quantitative analysis has been done through SPSS software. MRSI developed socio economic classification has been chosen for selection of respondents. K-means clustering technique has been used for clustering purpose and Conjoint analysis, for finding out the best suited features for various segments of customers coupled with AHP, for analysing customer priorities. Qualitative analysis assisted in determination of stumbling blocks behind low penetration of milking machine, prevalent problems in product market and customer expectations. Quantitative analysis aided in determination of buyer’s characteristics, price affordability and featured requirement of milking machine. Through our study, I recommend to conduct demonstration of milking machine and knowledge sharing about milking machine to villagers. And target those villagers who own more than 10 bovines, own more than 5 milking bovines, daily milk production is more than 40 litres, have cattle shed, water facility in cattle shed and belong to SEC’s category A.
- 4. iii Contents ACKNOWLEDGEMENT .......................................................................................................................i EXECUTIVE SUMMARY .................................................................................................................... ii LIST OF TABLES................................................................................................................................. vi LIST OF FIGURES .............................................................................................................................. vii 1. INTRODUCTION ..........................................................................................................................1 2. OBJECTIVE ...................................................................................................................................2 3. RESEARCH METHODOLOGY....................................................................................................2 3.1 Process Followed ....................................................................................................................2 3.1.1 Approach followed in village selection..................................................................................2 3.1.1.1 Why Gujarat........................................................................................................................2 3.1.1.2 Selection of districts for study in Gujarat ...........................................................................3 3.1.1.3 Selection of the parameters involved in districts selection .................................................4 3.1.1.4 Computation of scores based on selection parameters........................................................4 3.1.1.5 Selection of villages............................................................................................................5 3.2 Data Collection .............................................................................................................................5 3.2.1 Primary data collection ..........................................................................................................5 3.2.2 Secondary data collection ......................................................................................................6 4. EXPLORATORY STUDY.............................................................................................................6 4.1 Villagers of Anand district are not keeping buffalo for milking...................................................6 4.2 Number of teats used for milking .................................................................................................6 4.3 Milk quantity from all four teats...................................................................................................7 4.4 Seasonality....................................................................................................................................7 4.5 Communicable disease from machine ..........................................................................................7 4.6 Reasons behind low penetration ...................................................................................................7 4.7 Reasons behind the purchase of milking machine........................................................................7 4.8 Problems faced while using milking machine: .............................................................................8 5. DATA ANALYSIS.............................................................................................................................8 5.1 Reason for low penetration of milking machine...........................................................................8 5.1.1 Misconception........................................................................................................................9 5.1.2 Small herd size.......................................................................................................................9 5.1.3 Trading business ....................................................................................................................9 5.1.4 Others.....................................................................................................................................9 5.2 Features required in milking machine...........................................................................................9
- 5. iv 5.3 Motivations to purchase milking machine..................................................................................10 5.3.1 Scarcity of hired labour........................................................................................................10 5.3.2 Time constraints...................................................................................................................10 5.3.3 Contingency plan .................................................................................................................10 5.3.4 Availability of subsidy/trend................................................................................................11 5.4 Number of people require to handle a machine ..........................................................................11 5.5 Herd size at the time of purchase of milking machine................................................................11 5.6 Milking machine companies.......................................................................................................12 5.6.1 DeLaval................................................................................................................................12 5.6.1.1 Complaint on DeLaval......................................................................................................12 5.6.2 Vansun .................................................................................................................................12 5.7 Benefits from milking machine...................................................................................................13 5.8 Adverse effect of milking machine.............................................................................................13 5.9 Breakdown incidence in machine ...............................................................................................13 5.10 Socio Economic Classification based segmentation.................................................................13 5.10.1 Class A...............................................................................................................................14 5.10.2 Class B ...............................................................................................................................14 5.10.3 Class C ...............................................................................................................................14 5.10.4 Class D...............................................................................................................................14 5.10.5 Class E ...............................................................................................................................15 5.11 Segmentation of respondents using K-means clustering ..........................................................15 5.11.1 Cluster features ..................................................................................................................17 5.11.1.1 Cluster 1 (Raja)...............................................................................................................17 5.11.1.2 Cluster 2..........................................................................................................................19 5.11.1.3 Cluster 3..........................................................................................................................20 5.11.1.4 Cluster 4..........................................................................................................................21 5.11.2 Profiling of clusters............................................................................................................21 5.11.2.1 Cluster 1..........................................................................................................................23 5.11.2.2 Cluster 2..........................................................................................................................23 5.11.2.3 Cluster 3..........................................................................................................................23 5.11.2.4 Cluster 4..........................................................................................................................23 5.12 Cluster 1 user preference...........................................................................................................24 5.13 Suitable machine for cluster 1...................................................................................................25 5.14 Unit Economics of target segment............................................................................................26
- 6. v 6 FINDING AND DISCUSSION.........................................................................................................27 6.1 Finding from quantitative analysis..............................................................................................27 6.2 Findings from qualitative research..............................................................................................28 6.2.1 Reasons behind low penetration of milking machine ..........................................................28 6.2.2 Reasons for purchase of milking machine ...........................................................................28 6.2.3 Problems in existing machine ..............................................................................................29 6.2.4 Additional features in milking machine...............................................................................29 6.2.5 Benefits from milking machine............................................................................................29 7. RECOMMENDATIONS..................................................................................................................29 8. REFERENCES .................................................................................................................................30 9. ANNEXURE........................................................................................................................................i 9.1 Annexure 1.....................................................................................................................................i 9.2 Annexure 2................................................................................................................................... iii 9.3 Annexure 3................................................................................................................................... iv 9.4 Annexure 4................................................................................................................................. viii 9.5 Annexure 5.................................................................................................................................. xv
- 7. vi LIST OF TABLES Table 1: Bovine population in districts of Gujarat Table 2: Priority value of selection criteria Table 3: Formula to calculate total score for priority Table 4: List of selected districts, talukas and villages Table 5: Category scheme of SEC Table 6: SEC Segments profiles Table 7: Correlation table of basis variable Table 8: Coefficient of variation of basis variable Table 9: Selection of number of clusters Table 10: Respondent classification in clusters Table 11: Priority of users based on AHP Table 12: Importance value of users Table 13: Utility values of every level of attributes Table 14: Best combination of milking machine for targeted segment Table 15: Formula to calculate total yearly cost of feeding Table 16: Formula to calculate total yearly revenue without bonus Table 17: Unit economics of a bovine Table 18: Categories schemes of average herd size, average daily milk production, average number of milking cows and average number of milking buffalos Table 19: Category scheme of infrastructure index Table 20: Category scheme of number of assets own
- 8. vii LIST OF FIGURES Figure1: Reasons behind not purchase of milking machine Figure 2: Reason for purchase of milking machine Figure 3: Number of person required to handle machine Figure 4: Herd Size at the time of purchase Figure 5: Market share of milking machine Figure 6: Breakup of respondents in SEC segments Figure 7: Cluster 1 Infrastructure Facilities Figure 8: Cluster No. v/s average milking buffaloes Figure 9: Cluster No. v/s average milking cows Figure 10: Cluster No. v/s No. of assets own Figure 11: Cluster 2 Infrastructure Facilities Figure 12: Cluster 3 Infrastructure Facilities Figure 13: Cluster 4 Infrastructure Facilities Figure 14: Average daily milk production v/s Clusters Figure 15: Average herd size v/s Clusters Figure16: SEC v/s Clusters Figure 17: Average daily milk production v/s Clusters Figure 18: User preference to various attributes
- 9. 1 1. INTRODUCTION India ranks first in milk production; the country produced 132.4 million tonnes of milk in 2012-2013. 58% of water buffalo and 15% of cow population of world reside in India. However, average productivity of milk per bovine is quite low as compared to developed nations like USA and UK. During past 30 years (1982 to 2012) average productivity of milk from water buffalo has increased from 3.7kg to 6.2 kg and average productivity of milk from cow has increased from 1.9 kg to 3.9 kg per day. Factors affecting low productivity in India are nutrient deficient wet and dry cattle feed, inadequacy of veterinary doctors, inadequate infrastructure and low mechanisation. Though India is the major producer of milk but it lags behind in mechanisation in dairy sector. The mechanisation scenario is progressive at milk processing level but require promotional intervenes at milk production level. Milking machine is the equipment resulting in mechanisation at milk production level. Milking machine enables a milk producer to milk several bovines at a time with greater efficiency, quality and hygiene. The different variants of the product are operated through electricity/battery and come in stationary/portable design. At present DeLaval, Vansun, GEA and Kurtsan are the major manufacturing companies of milking machine. Penetration of milking machine is quite low in Indian dairy sector and the reasons for the same are small herd size, inadequate supply chain network and information asymmetry. IDMC is a subsidiary company of NDDB set up in 1978 aimed for providing process and project solutions under one roof with in-house equipment manufacturing and process automation facilities, which is best in class. IDMC has recently developed three types of milking systems. These systems are as good and close to nature as milk extraction by calf. Because of their high sanitation, the bacterial load in milk is minimum. But manufacturing cost of these machines are high, so not affordable to small and marginal milk producers. To build cost effective milking machine, IDMC approached Sickle Innovations which will enhance the penetration of milking machine in India. Sickle Innovations started in 2013 at IISC, Bangalore with an aim to provide farming solution with core focus on improving conventional farming practices through design interventions. Sickle Innovations is currently engages in design and development of a milking machine.
- 10. 2 The startup requires deep market insights to assess the market potential, user requirement for designing a financially viable product for both the manufacturer (IDMC) and the end consumers (Livestock owners) . 2. OBJECTIVE The various issues faced by customers are portability, time constraint and labour scarcity which demands immediate and most sought solution. Broadly the study attempted; To find out the reasons behind low penetration of milking machine in Gujarat, user requirement, characteristics of potential customers. The study also attempted to identify perceived importance of various product attributes. 3. RESEARCH METHODOLOGY 3.1 Process Followed Background research was done via multifarious online resources, government portals, census data of human and livestock, journals and research articles. Thereafter, exploratory study was conducted at Valsan village, Anand,Gujarat. Final questionnaire has been prepared on the basis of outcome and result of exploratory study. Village selection was done by using census data of livestock and human and basis of final study was village surveys and informal interviews. Qualitative research aided in developing deep understanding of the present market and user condition. SEC (Socio Economic Classification) and herd size were used for segmentation of respondents and then at last K means clustering method was used for respondent’s segmentation and conjoint analysis for finding out the user priority and suitable machine for the target segment. 3.1.1 Approach followed in village selection 3.1.1.1 Why Gujarat We have chosen Gujarat for user and market study primarily for three important reasons:
- 11. 3 Gujarat ranks 4th in milk production with 10315 metric tonne of production in 2013 coupled with 506 gm per capita availability of milk per day. Apart from Gujarat and Rajasthan no other state has shown such kind of performance in both parameters. Gujarat represents climatic variability from region to region and replicate all kind of weather situations, present in India. Sickle Innovations is based in Ahmedabad. IDMC and NDDB are located in Anand. Anand is the milk capital of India so wider opportunities have been explored through this study. 3.1.1.2 Selection of districts for study in Gujarat I divided 26 districts into three categories on the basis of number of female bovine animals. Districts of category 1 possessed high number of female bovine animals with contribution of 33% of total female bovine in Gujarat which is similar to districts of category 2 and rest contribution of number of female bovine animals was done by districts of category 3.One district representing the each cluster has been chosen so total three districts have been selected for study named as Banaskantha(Category1), Kuchchh(Category2), Surendranagar(Category3) and Anand. District Female Bovine Population District Female Bovine Population Banas Kantha 2098713 Jamnagar 601114 Sabar Kantha 1407545 Surat 569703 Panch Mahals 1388024 Patan 545852 Vadodara 1266827 Gandhinagar 476461 Dohad 1046078 Tapi 395014 Kheda 1013420 Amreli 391224 Junagadh 1005942 Ahmadabad 389806 Kachchh 910986 Navsari 342590 Rajkot 908195 Valsad 311592 Mahesana 788821 Bharuch 254114 Bhavnagar 751416 Narmada 252866 Surendranagar 740943 Porbandar 203427 Anand 651459 Dangs 102653 Table1: Bovine population in districts of Gujarat
- 12. 4 3.1.1.3 Selection of the parameters involved in districts selection We have considered the total bovine population of districts, cow/buffalo ratio and number of bovines per 1000 human population as the criteria for selection of a district in a given category. Total bovine population has been selected because it gives a indicative picture of milking machine potential. So, for our study selection of those districts, having high bovine population is of utmost importance. Use of milking machine on buffalo is a rare practice and hence choose cow/buffalo ratio as another parameter. Bovine density focuses the areas with high bovine and low or average human population as average herd size factor plays a significant role in purchasing decision of customers. To find our relative priority of these parameters ranking method was used. Number of bovines per 1000 human is critical factor in selection of district followed by total bovine population and cow/ buffalo ratio. Table 2: Priority value of selection criteria 3.1.1.4 Computation of scores based on selection parameters Contribution of each district will be divided to the total value of that factor and the resultant will be multiplied by the priority of the underlined factor, which will result in attaining the score for the mentioned factor. Similar calculation will be done for the rest two factors. Individual score for each factor will be added and resultant will be called as the total score for all parameters. From each category, district with highest total score will be selected. 1 2 3 4 5 Contribution Contribution Ratio Priority of factor Col 2 * Col 3 Total score Table 3: Formula to calculate total score for priority Parameter Total bovine population in district Cow/Buffalo ratio Number of bovines per 1000 human Sum Priority Total bovine population in district 0 1 1 33.33% Cow/Buffalo ratio 0 0.5 0.5 16.67% Number of bovines per 1000 human 1 0.5 1.5 50.00% Total 1 1.5 0.5 3
- 13. 5 3.1.1.5 Selection of villages Top 10 villages have been shortlisted on the basis of bovine population in every selected district. Same methodology has been used for village and district selection. Top three villages have been selected from each selected districts. Due to heavy rain in Banaskantha only Suigam and two villages of Anand have been surveyed. Category Districts Villages Category 1 Banaslantha, Suigam Tetoda Thawar Category 2 Kachcha Bhirandiyara Dhori Sumrasar Category 3 Surendranagar Reshamiya Dhokalva Vijaliya Anand Bedva Davol Table 4: List of selected districts, talukas and villages 3.2 Data Collection The project involved collection and scanning of primary and secondary data. 3.2.1 Primary data collection The primary data was collected through diagnostic surveys and informal interviews of individual dairy farmers. Respondents with at least 5 bovines and more than three milking bovines have been surveyed. Total 85 respondents were surveyed in four districts of Gujarat Banaskantha(12), Surendranagar(30), Anand(15) and Kuchchh(28). Purposive sampling technique is used for selection of respondents. Questionnaire is divided in the following sections. 1. First section represents the socio economic classification of respondent 2. Second section relates to basic information of respondent 3. Third section attempts to assess expenses and revenue 4. Fourth relates to infrastructure (Available infrastructure) 5. Fifth section is related to milking machine (If currently using the machine) 6. Sixth section is related to qualitative assessment on milking machine (If using milking machine then why, problems faced, cost of buying machine, satisfaction level) 7. Seventh section is related with finding out the reasons of not owing the milking machine.
- 14. 6 8. Eighth is related to hired labour. 9. Ninth is related with finding out the user preferences and suggesting them the best machine for the potential use. 3.2.2 Secondary data collection The secondary data sources included various government agencies such as NDDB, Directorate of animal husbandry (Gujarat state, Gandhinagar), 19th Cattle Census (Ministry Of Agriculture Department Of Animal Husbandry, Dairying and Fisheries Krishi Bhawan, New Delhi), Census of India 2011 and online databases such as FAO statistics, buffalopedia e.t.c. These databases acquainted us with statistics of milk production and various indigenous breed of buffalos of India respectively. 4. EXPLORATORY STUDY I went to Navali and Valasan villages of Anand district with an aim to understand the current situation of users and market. Surveys and semi structured questionnaire were carried out with eleven respondents. 4.1 Villagers of Anand district are not keeping buffalo for milking Our initial research in these villages suggested that villagers preferred to keep cow over buffalo due to following reasons. 1. Gestation period of a buffalo is 10 months while gestation period of a cow is 9 months. 2. Milking period for a buffalo ranges from 4 to 6 months while it varies from 7 to 9 months for a cow. 3. Milking a buffalo is more difficult because of their aggressive nature. 4. Failure rate of artificial insemination of buffalo is higher than cow. 5. Buffalo gives lesser milk than cow. 6. Time period require to reach at puberty is more in buffalo than cow. 4.2 Number of teats used for milking Numbers of teats used for milking depends on the milk producer. Many milk producers first feed the calf and then do the milking from all four teats, while some first do the milking from all four teats and left some milk for calf in udder, Some dairy farmers only use three or two teats for milking and left one or two teats for calf feeding while some of the
- 15. 7 milk producers used to feed calf through bottle because calf used to hit udder by his/her head which can cause harm to udder of cow/buffalo. Milk producers of this area stop milking cow/buffalo before two months of the calf birth. 4.3 Milk quantity from all four teats Generally, all the four teats give equal amount of milk. However in some cases it has been observed that front pair of teats gives lesser quantity of milk than the rear pair of teats. 4.4 Seasonality Seasonality affects the milk production. Cow/Buffalo produces least amount of milk in summer and most in winter. During spring and autumn, the milk production is almost near to winter production and primary reason behind the seasonal pattern is water and green fodder scarcity in summer. 4.5 Communicable disease from machine Mastitis disease can be spread from one cow/buffalo to other cow/buffalo through milking machine. In this disease, mammary glands of a cow/buffalo get infected and may become dysfunctional. 4.6 Reasons behind low penetration Small herd size results in less buying of milking machine and the milk producers do not find profitability in its usage and usually producers with less than five cattle/buffaloes resist themselves from its use. Very few milk producers of Valasan and Navali possesses misconception about milking machine. They think that teats may get damaged and elongated due to its continuous application. 4.7 Reasons behind the purchase of milking machine Milking requires skilled labour and nowadays people do not prefer this profession. Big dairy farmers are facing labour crisis and to overcome this problem most of them purchase it due to inadequacy of labour. We can milk a cow/buffalo within stipulated time period and if milking is not done within stipulated time period then milk can’t be taken and so machine offers the excellent remedy to this problem by taking comparatively less time for milking.
- 16. 8 In current situation, milking machine has become an excellent replacement for the labour unavailability factor. 4.8 Problems faced while using milking machine: Some milk producers own the machine and have used it two to three times only till date due to low voltage and power cuts during the milking time. These milk producers want us to design a milking machine which can work on low voltage. Milking machine has many rubber and plastic material parts. These parts need replacement after every eight months to prevent the deterioration of machine. Milking machine consumes more time for milking a buffalo and due to this reason milk producers of Valasan and Navali do not use it as teats of buffalo demands more pressure for milking than cow. 5. DATA ANALYSIS 5.1 Reason for low penetration of milking machine Low promotional activity and non-demonstration of milking machine in villages are the primary reasons which lead to huge information asymmetry. Many prospective customers have never seen the product and so are unaware of its benefits. Fragmented supply chain network of milking machine results in complicacies to the potential customers who want to purchase the product but are unable to do so due to unavailability of vendor and poor dissemination of knowledge. Other reasons for low penetration of milking machines includes the misapprehensions about the product, small herd size, trading business of cow/buffalo and others. A pie chart is depicted below which represents those respondents who do not want to purchase milking machine. 42% of respondents possess misconception about it, 29% respondents own small herd so do not feel the need to purchase, 16% of respondent involve in trading of bovines business and 13% have others reasons for not purchasing the machine.
- 17. 9 Figure1: Reasons behind not purchase of milking machine 5.1.1 Misconception Following misconceptions results in reluctance towards the use of the milking machine, damage to teats, its elongation, reddishness, swelling, bleeding and bovines may get electricity shock if liners get damage. People possess misconceptions due to information asymmetry. 5.1.2 Small herd size Individual milk producers in India own small herd size coupled with small number of milking bovines and so do not arrive on purchase decisions. 5.1.3 Trading business Some milk producers involved in the trading of cow and buffaloes which is the main source of their livelihood. Traders do not seek profitability in its purchase and so don’t feel to expand milking business. 5.1.4 Others Other reasons are issues related to electricity, cattle shed, water scarcity, lack of funds for its purchase, bovine treatment as house member don’t allow them for using the product and same milking machine can’t be used for milking both cow and buffalo. 5.2 Features required in milking machine Through this study following features have been found 42% 29% 16% 13% Myths Own small herd size Bovine trading business Others reasons
- 18. 10 1. Machine can run on the alternate source of power. Alternate source of power means machine can be operated through electricity, battery, solar cell and diesel motor. 2. Portable machine can milk two bovines at a time. 3. Machine shows the fat percentage and quantity of milk produced by every bovine. 4. Machine can run on low voltage capacity and so becomes the best suite for village people. Rest of the features are common to present machines available in the market. 5.3 Motivations to purchase milking machine Following motivations were found out by surveying those people who currently own milking machine. Figure 2: Reason for purchase of milking machine 5.3.1 Scarcity of hired labour Nowadays youths are unwilling to go into this business so scarcity of labour is created in the market and to overcome the same, people are purchasing milking machine. 5.3.2 Time constraints For some people milking is a secondary occupation and they do not spare time in milking their bovines and so directed towards the purchase of the product. 5.3.3 Contingency plan Some milk producers own big herd size and are unaware of milking by hand. The milking of their bovines are done through hiring labour and in situation of unavailability of 28% 56% 5% 11% Scarcity of hired labour Time constraints Contingency Plan Availability of subsidy/ trend
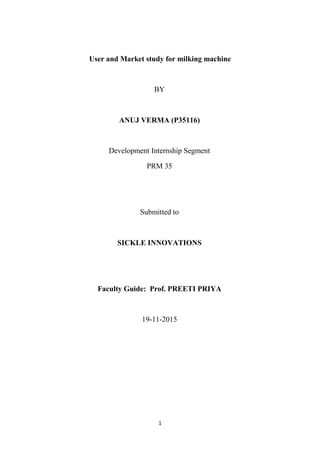
- 19. 11 the same, milking gets stopped and milking machine are being purchased to resolve this problem. 5.3.4 Availability of subsidy/trend People purchased the milking machine because of its availability on subsidy and this is becoming a trend for owning the same in villages of Anand. 5.4 Number of people require to handle a machine Through this study I found out that generally one person is required for handling the machine. Figure 3: Number of person required to handle machine 5.5 Herd size at the time of purchase of milking machine 47% of respondents purchased the milking machine when the herd size is less than or equal to 10. 33% of respondents purchased it when the herd size was greater than 10 but less than 20. 13% of respondents purchased the same when the herd size was greater than 20 but less than 30. 7% of respondents purchased it when the herd size was greater than 40. Average herd size came out to be 14 at the time of purchase. Figure 4: Herd Size at the time of purchase
- 20. 12 5.6 Milking machine companies 80% of respondents purchased the milking machine of DeLaval. Only 20% of respondents own Vansun’s milking machine and no other companies were preferred for purchase by villagers of Anand. Figure 5: Market share of milking machine 5.6.1 DeLaval Amul has tie up with DeLaval for milking machine. So, Amul is selling the milking machine in villages providing the subsidy in the range of 40 to 45% from district to district. This is becoming the primary reason for more market share of De Laval. DeLaval’s milking machine cost 59000INR with 1 year warranty in market but 26500INR subsidies has been provided in the village of Anand. 5.6.1.1 Complaint on DeLaval Following complaints have been reported:- high noise, high maintenance cost and low reselling value of milking machine. 5.6.2 Vansun Vansun has no tie up with any dairy and so market share of Vansun in Anand is only 20%. Vansun machine sells at 65000 in market with one year warranty and after getting subsidised it costs only 45000 rupees.Milk producers possess positive perception about the Vansun’s milking machine and some respondents have sold their DeLaval machine and purchased the Vansun. Reasons for the purchase of Vansun were low noise, low maintenance cost and better service provision.
- 21. 13 5.7 Benefits from milking machine Following benefits have been reported. 1. Time saving 2. Reduction in labour force. 3. Less energy requirement for milking the bovines. 4. Good quality, high fat and more quantity of milk. Due to use of milking machine, milk producers get more quantity of milk and more fat as milking machine exert optimal pressure on teats and milk whole quantity of milk from udder. 5.8 Adverse effect of milking machine No adverse effects on the bovines have been observed. Only one respondent’s cow teats were damaged due to its use. 5.9 Breakdown incidence in machine Most of the breakdown happens in liner of teat cups. Liners are made of rubber and it gets damaged every year, which needs time to time replacements. 5.10 Socio Economic Classification based segmentation MRSI classified the total population in twelve classes based on the SEC but for this study, I have clubbed similar classes into one class and total five classes have been created. A pie chart has been created for breakup of the respondents in these five classes. Figure 6: Breakup of respondents in SEC segments A 31% B 25% C 18% D 18% E 8%
- 22. 14 A B C D E A1 A2 A3 B1 B2 C1 C2 D1 D2 E1 E2 E3 Table 5: Category scheme of SEC 5.10.1 Class A 31% of respondents belong to this class, out of which 85% of respondents with more than 40 litres of milk per day, 58% of respondents own more than 5 milking bovines, 69% of respondents score more than 4 in infrastructure index, 42% of segment members already own the product, 58% of respondents own more than 10 bovines. A B C D E Produce more than 40 litres of milk per day 84.62% 57.14% 13.33% 33.33% 42.86% Own more than 10 bovines 57.69% 71.43% 46.67% 73.33% 57.14% Own more than 5 milking bovines 69.23% 66.67% 26.67% 53.33% 42.86% Score more than four in infrastructure index 69.23% 57.14% 13.33% 46.67% 28.57% Purchase intention 53.33% 68.42% 60.00% 66.67% 14.29% Already Possess product 42.31% 9.52% 0.00% 0.00% 0.00% Table 6: SEC Segments profiles 5.10.2 Class B 25% of respondents belong to this class, out of which 57% of respondents with more than 40 litres of milk per day, 67% of respondents own more than 5 milking bovines, 57% of respondents score more than 4 in infrastructure index, 9% of segment members already own product, 71% of respondents own more than 10 bovines and 68% of members shown purchase intention (Table.6). 5.10.3 Class C 17% of respondents belong to this class, out of which 13% of respondents with more than 40 litres of milk per day, 27% of respondents own more than 5 milking bovines, 13% of respondents score more than 4 in infrastructure index, 0% of segment members already own product, 46% of respondents own more than 10 bovines and 60% of members shown purchase intention (Table.6). 5.10.4 Class D 17% of respondents belong to this class, out of which 33% of respondents with more than 40 litres of milk per day, 53% of respondents own more than 5 milking bovines, 46% of
- 23. 15 respondents score more than 4 in infrastructure index, 0% of segment members already own product, 73% of respondents own more than 10 bovines and 66% of members shown purchase intention (Table.6). 5.10.5 Class E 9% of respondents belong to this class, out of which 43% of respondents with more than 40 litres of milk per day, 43% of respondents own more than 5 milking bovines, 28% of respondents score more than 4 in infrastructure index, 0% of segment members already own product, 57% of respondents own more than 10 bovines and 14% of members shown purchase intention (Table.6). Respondents belonging to class A possess more purchasing power compared to other class’s members and also some of the members already own the product. So our target customers must possess qualities of class A. 5.11 Segmentation of respondents using K-means clustering Infrastructure index, Daily milk production, No. of milking cows, No. of milking buffalos, total milking bovines and Number of assets own are the available basis variables for classification. At First, Pearson correlation is used to find out the correlation between these variables using SPSS (Table.18, Table.19, Table.20). Infrastructure Index Number of milking buffalo Number of milking cows Daily milk production Total milking bovine Number of own asset Infrastructure Index 1 -0.258 0.304 0.301 .069 0.446 Number of milking Buffalo -0.258 1 -.179 0.241 0.569 -.072 Number of milking Cows 0.304 -.179 1 0.693 0.707 .145 Daily milk production 0.301 0.241 0.693 1 0.752 0.313 Total milking bovine .069 0.569 0.707 0.752 1 .069 Number of own asset 0.446 -.072 .145 0.313 .069 1 Table 7: Correlation table of basis variable
- 24. 16 Daily milk production, number of milking cows and total milking bovine are positively correlated. So, only one variable will be selected out of these three variables. Total milking bovines and number of milking buffaloes are positively correlated. So, only one variable will be selected out of these three variables. Variable which have more coefficient of variation will be used for classification. Number of milking cows and number of milking buffalos have more coefficient of variation compared to others. So, Number of milking cows and number of milking buffalo will be used for classification. Total Milking Bovine Infrastructure Index Number of Milking Buffalo Number of Milking Cows Daily Milk Production Number of own asset Sample Size 84 84 84 84 84 84 Mean 7.3929 3.6667 4.3214 3.0714 56.6429 5.5595 Std. Deviation 5.35717 1.55489 3.85008 4.47963 46.68341 2.21904 Coefficient of variation 72.46% 42.41% 89.09% 145.85% 82.42% 39.91% Table 8: Coefficient of variation of basis variable Infrastructure index, Number of milking cows, number of milking buffalo and no. of assets owned will be used for classification. But these variables are in different scale so normalization of variables is done using Z-score. After that these variables were used for clustering the respondents. K means - clustering method is used for classification. K means- clustering is run for cluster no. 2 to cluster no. 9. VRC (variance ratio criteria) is used to decide number of clusters. We are getting minimum value at 4 number of cluster. So number of cluster is 4. Cluster number 1 has maximum number of respondent.
- 25. 17 Cluster No. Pooled VRC Omega 2 193.0361 3 83.59475 198.4385 4 172.5919 -102.086 5 159.5027 -0.87727 6 145.5362 3.034542 7 134.6043 8.608266 8 132.2806 11.57574 9 141.5327 -4.54876 10 146.236 Table 9: Selection of number of clusters Number of Respondent in each Cluster `Cluster 1 27.000 2 35.000 3 6.000 4 16.000 Table 10: Respondent classification in clusters 5.11.1 Cluster features 5.11.1.1 Cluster 1 (Raja) 32% of our respondents belong to this cluster. Respondents own more milking buffalos compare to other cluster, own less number of milking cows compare to other clusters and have adequate infrastructure and possess more assets compare to other clusters.
- 26. 18 Figure 7: Cluster 1 Infrastructure Facilities Figure 8: Cluster No. v/s average milking buffaloes 51.85% 37.04% 48.15% 14.81% 18.52% 77.78% 48.15% 62.96% 59.26% 85.19% 81.48% 22.22% 0.00% 20.00% 40.00% 60.00% 80.00% 100.00% 120.00% Cattle Shed Electricity in cattle shed Water in cattle shed Low Voltage issue Powercuts Fodder Room Yes No
- 27. 19 Figure 9: Cluster No. v/s average milking cows Figure 10: Cluster No. v/s No. of assets own 5.11.1.2 Cluster 2 42% of our respondents belong to this cluster. Respondents own less number of milking buffalos compare to other clusters, own average number of milking cows compare to other clusters and have inadequate infrastructure and possess less assets compare to other clusters (Fig.8, Fig.9, Fig10).
- 28. 20 . Figure 11: Cluster 2 Infrastructure Facilities 5.11.1.3 Cluster 3 7% of our respondents belong to this cluster. Respondents own very high number of milking buffalos as compared to other clusters and own more number of milking cows than other clusters, have inadequate infrastructure and possess less assets compare to others. But we cannot target this cluster because number of respondents is very less in this cluster (Fig.8, Fig.9, Fig.10,). Figure 12: Cluster 3 Infrastructure Facilities 25.71% 2.86% 14.29% 28.57% 45.71% 77.14% 74.29% 97.14% 85.71% 71.43% 54.29% 22.86% 0.00% 20.00% 40.00% 60.00% 80.00% 100.00% 120.00% Cattle Shed Electricity in cattle shed Water in cattle shed Low Voltage issue Powercuts Fodder Room Yes No 0.00% 33.33% 16.67% 16.67% 16.67% 66.67% 100.00% 66.67% 83.33% 83.33% 83.33% 33.33% 0.00% 20.00% 40.00% 60.00% 80.00% 100.00% 120.00% Cattle Shed Electricity in cattle shed Water in cattle shed Low Voltage issue Powercuts Fodder Room Yes No
- 29. 21 5.11.1.4 Cluster 4 19% of our respondents belong to this particular cluster and respondents own low number of milking buffalos compared to other clusters, own more number of milking cows compared to others, have adequate infrastructure and possess more assets compare to cluster 2 and 3. But we cannot target this cluster because cluster members already own milking machine (Fig.8, Fig.9, Fig.10). Figure 13: Cluster 4 Infrastructure Facilities 5.11.2 Profiling of clusters Profiling of clusters have been done using average daily milk production, socio economic classification, purchase intention, herd size and number of milking bovines. Figure 14: Average daily milk production v/s Clusters 100.00% 100.00% 93.75% 6.25% 6.25% 93.75% 6.25% 93.75% 93.75% 6.25% 0.00% 20.00% 40.00% 60.00% 80.00% 100.00% 120.00% Cattle Shed Electricity in cattle shed Water in cattle shed Low Voltage issue Powercuts Fodder Room Yes No Cluster 4 11.11% 25.93% 37.04% 7.41% 11.11% 3.70% 3.70% 25.71% 57.14% 8.57% 5.71% 2.86% 16.67% 16.67% 66.67% 6.25% 37.50% 25.00% 6.25% 25.00% 0.00% 20.00% 40.00% 60.00% 80.00% 100.00% 120.00% 10 30 50 70 90 110 More than 120 C1 C2 C3 C4
- 30. 22 Figure 15: Average herd size v/s Clusters Figure16: SEC v/s Clusters 22.22% 22.22% 29.63% 14.81% 7.41% 3.70% 48.57% 22.86% 20.00% 5.71% 2.86% 16.67% 16.67% 66.67% 37.50% 50.00% 6.25% 6.25% 0.00% 20.00% 40.00% 60.00% 80.00% 100.00% 120.00% 5 15 25 35 45 55 More than 60 bovines C1 C2 C3 C4 37.04% 3.70% 11.11% 48.15% 2.86% 11.43% 34.29% 34.29% 9.23% 16.67% 33.33% 33.33% 16.67% 87.50% 12.50% 0.00% 20.00% 40.00% 60.00% 80.00% 100.00% 120.00% 140.00% 160.00% A B C D E C1 C2 C3 C4
- 31. 23 Figure 17: Average daily milk production v/s Clusters 5.11.2.1 Cluster 1 63% of cluster members have shown the purchase intention, 89% of cluster members belong to SEC A and B and so possesses high purchase capability, 80% of members own more than 10 bovines, 74% of members own more than five milking bovines and 63% of members with 40 litre of milk production per day (Fig.14, Fig.15, Fig16, Fig.17). 5.11.2.2 Cluster 2 51% of cluster members have shown the purchase intention, 86% of cluster members belong to SEC C,D and E and so have low purchase capability, 50% of members own more than 10 bovines, 28% of members own more than five milking bovines and 17% of members with 40 litre of milk production per day (Fig.14, Fig.15, Fig16, Fig.17). 5.11.2.3 Cluster 3 66.66% of cluster members have shown the purchase intention, 50% of cluster members belong to SEC A and B, so it comprised of mix respondents , all members own more than 10 bovines, all members own more than five milking bovines with 40 litre of milk production per day (Fig.14, Fig.15, Fig16, Fig.17). 5.11.2.4 Cluster 4 Among existing user cluster, all members belong to SEC A and B with high purchase capability, 75% of members own more than 10 bovines, and 75% of members own more than
- 32. 24 five milking bovines and 94% of members with 40 litre of milk production per day (Fig.14, Fig.15, Fig16, Fig.17). So on the basis of above findings we can target cluster 1 as it resembles the properties of cluster 4. 5.12 Cluster 1 user preference This study was done to find out the user priority for important features of milking machine. This helped us in deciding the feature to be focused more while designing the machine. Through AHP (Analytical hierarchical process) method following preferences has been chosen out. Users have given highest preference to type of machine (It means movable or stationary) then time taken for milking a bovine and after that milking one or two bovine at a same time. Users have seen these features before buying a milking machine. Price has been least preferred and so they considered the price at last. Total Time taken to milk a cow Price Type of machine Milk more than one cattle at same time Priority Time taken to milk a cow 0.139082 0.27453 0.198703 0.239107 21.29% Price 0.081065 0.097425 0.131313 0.103259 10.33% Type of machine 0.397377 0.314892 0.211066 0.401318 33.12% Milk more than one cattle at same time 0.382476 0.313152 0.458918 0.256316 35.27% Table 11: Priority of users based on AHP We arrived on following outcomes after doing conjoint analysis. Users have given 1st preference to power source (Electricity, Alternate power source) to operate the machine.2nd preference has been given to type of machine (movable or stationary and 3rd to milking one or two bovines at a time. Price has been considered the least (Table.13). Type of machine Power Source Milk one or two bovine at a same time Price Importance Values 23.01% 31.21% 25.53% 20.29% Table 12: Importance value of users
- 33. 25 Figure 18: User preference to various attributes These priority and preferences will help us in designing the milking machine. To cater the target segment following priority has been taken into consideration. 5.13 Suitable machine for cluster 1 This study has been done for finding out the best milking machine according to user requirement and we arrived on the requirement part through conjoint analysis. Utilities Utility Estimate Std. Error Fac1 Stationary .663 .131 Movable 1.327 .263 Fac2 Only Electricity 1.067 .131 Alternate Source of Power 2.135 .263 Fac3 One .433 .131 Two .865 .263 Fac4 21500 -.128 .079 24500 -.255 .158 28000 -.383 .238 (Constant) .027 .374 Table 13: Utility values of every level of attributes 31.00% 26.00% 23.00% 20.00% Power source How many bovines can be milked at a time Machine type (Stationary/Movable) Price
- 34. 26 Following table shows the utilities of various levels of attributes. In type of machine attribute, movable feature has given more utility value as compared to stationary feature of machine. In power source, alternate power source has been featured as of more utility compared to only electricity feature of machine. Milking one or two bovines at a time has been compared of low utility to milking two bovines at a time. In price attribute, 21500 has max utility compared to 24500 and 28000. So for our target customer segment, best machine will have these following features. Constant Type of machine Power Source Milk one or two bovines at a same time Price Total Utility Movable Alternate Source of Power Two 21500 -.027 1.327 .2.135 0.865 -.128 4.172 Table 14: Best combination of milking machine for targeted segment Price has negative utility so if we charge 24500 and 28000 rupees for milking machine (keeping other features constant) total utility will get decrease by 0.128 and 0.255 respectively. But still the drop is not very significant so we can charge 28000 rupees. But this will not be the best combination of machine for our targeted segment. 5.14 Unit Economics of target segment Knowing unit economics of keeping one cow or one buffalo is very important. This will help us to know the profit of a dairy farmer. To calculate this all cost were asked from the dairy farmer. Farmers feed Maize, Cotton, Straw, Pigeon Pea, mineral mixture, gau dhara, and amul fodder only in milking period of bovines. Rest of the time bovines eat only green or dry grass. To calculate yearly total cost, cost of green grass and dry grass was multiplied with 365 days and daily consumption plus cost of Maize, Cotton, Straw, Pigeon Pea, mineral mixture, gau dhara, and amul fodder multiplied with milking time period and feeding quantity. Total Yearly Cost = Price*(quantity consumption per Maize, Cotton, Straw, Pigeon Pea, mineral mixture, gau dhara, and amul fodder day)*(Milking period)+365*(green grass quantity, dry grass quantity per day)*Price Table 15: Formula to calculate total yearly cost of feeding
- 35. 27 Before 2 months of ending of the milking period, cow and buffalo give half litre of milk which they usually give during initial months of milking. So for calculating the revenue per cow and buffalo, daily milk production is multiplied with total milking period of bovine minus two months plus half of the daily milk production with two months. This gives us the revenue without bonus. Amul provide bonus (it vary from dairy to dairy 9 rupees in surendranagar and kuchchh, 12 rupees in banaskantha) at every 100 rupees of pouring milk. By conservative approach we took 9 rupees as bonus amount for our respondent. Bonus is calculated for every respondent and added to revenue to calculate total revenue on a bovine of dairy farmer. Two profits are calculated pre bonus profit and post bonus profit (Table.8). Revenue = (Milk price*milk quantity per day*(milking period-months))+ (Milk price*(milk quantity per day/2)*(2 months)) Table 16: Formula to calculate total yearly revenue without bonus We got the following unit economics for target segment. Profit on one cow is 24337 INR and profit +bonus on one cow is 29507. Profit on one buffalo is 26665.45 INR and Profit + Bonus for buffalo 32132 INR. Bovine Total Cost Revenue Bonus Profit Profit+Bonus Cow 25853.57 50191.07 5169.91 24337.5 29507.41 Buffalo 34077.85 60743.31 5466.89 26665.45 32132.35 Table 17: Unit economics of a bovine 6 FINDING AND DISCUSSION 6.1 Finding from quantitative analysis From the Quantitative data analysis we find out following features of our potential customers. Customer belongs to SEC category A. Own more than 10 bovines. Acquainted with cattle shed, electricity in cattle shed, fodder room and facing no low voltage issue. Own at least 6 milking bovines. Production of at least 40 litres of milk every day.
- 36. 28 Have more than 5 bigha of land. Profit on one cow is 29507 INR and on buffalo 32132 INR. Customer has given more preference to power source over type of machine and time taken by the machine to milk a single bovine over milking single or double bovines at a time. Price factor came at end. Most sought milking machine for our target segment has following attributes. Operation of movable machine on alternate source of power can milk two bovines at a same time and costs around 21500. Our target segment is less price sensitive so price can be hiked up to 28000 INR but hiking price will result in diminished total utility of machine. Unit economics for a bovine is as follows-Yearly profit without bonus on a cow and buffalo are 24337.5 INR and 26665.45 INR respectively. Yearly profit with bonus on a cow and buffalo are 29507.41 INR and 32132.35 INR respectively. 6.2 Findings from qualitative research 6.2.1 Reasons behind low penetration of milking machine One of the most important factors behind the low penetration of milking machine is that no demonstration activity of milking machine has been conducted till now. Many people do not know how to use them and are unaware of the machine’s benefits which results in misconception in their mind about the product. They think teats may get damaged and elongated due to use of the milking machine. Due to less herd size, most of the dairy farmers do not buy milking machine. This reason coupled with number of milking cattle/buffaloes affect the selling of the milking machine. They do not find worthiness in using milking machine. Almost all those dairy farmers, who own less than five cattle/buffaloes do not purchase milking machine. Some dairy farmers were involved in the trading of bovines which generates income to them and due to this they were unwilling for making the purchase. 6.2.2 Reasons for purchase of milking machine Current owner of milking machine purchased the milking machine due to labour crunch and difficulties faced during milking the bovines. Some of the customers preferred it due to subsidy factor.
- 37. 29 6.2.3 Problems in existing machine Dairy farmers don’t confront any major problem in its operation but they seek to have a machine with less noise and low maintenance cost. 6.2.4 Additional features in milking machine Respondents desire a machine through which they can measure the quantity of milk given by each bovine, fat content determination, machine operation on alternate source of power, portability, and low voltage adaptability of the machine. 6.2.5 Benefits from milking machine Some of the benefits received by our respondents told us were saving of time, labour force reduction, less energy requirement for milking the bovines, good quality of milk and more quantity of milk. 7. RECOMMENDATIONS During development of milking machine, following attribute of machines should be considered on prior basis viz. adaptability to low voltage situation, hybrid nature of machine signifies the operation on both electricity as well as on alternate source of power, milking at least two bovines at a time and single machine can operate both cow and buffalo and portability. Target those customers who possess these characteristics- Belong to SEC A, own at least ten bovines, have decent infrastructure, daily milk production of 40 litres and own six milking bovines. There is an urgent need of collaboration with big dairy players should be taken into consideration which will result in rapid market capture and provide the established connection of partner with it. Demonstration and below line promotional activities of machine in selected villages should be initiated to resolve the doubts and misapprehensions regarding the product. A help team should be set up for creating nexus between government and dairy farmers for facilitation of govt. subsidies and schemes, veterinary and infrastructural facilities (cattle shed) to dairy farmers.
- 38. 30 8. REFERENCES 1. Ministry of Agriculture Department of Animal Husbandry, Dairying and Fisheries (2012) 19th Livestock Census (2012). Krishi Bhawan, New Delhi: Government of India. 2. Ministry of Agriculture Department of Animal Husbandry, Dairying and Fisheries (2014) State of Indian Agriculture (2014). New Delhi: Government of India. 3. Ministry of Home Affairs (2012) SRS Statistical Report (2012). New Delhi: Government of India. 4. Rao Sunitha (2015) “Tripura Farms Milk Organic Fad”The times of India”, January 15. 5. Kolf Wouter (2014) “Making small dairy farming globally competitive: myth or reality” Business Line, December 29. 6. Khan Irum (2010) “Steady growth of dairy equipment industry in India”FnB News.com, August 02. 7. NDDB Statistics, 2015. Milk Production in India. [Online] Available at: http://www.nddb.org/information/stats/milkprodindia [Accessed at: 4 July 2015]. 8. NDDB Statistics, 2015. Milk Production by States. [Online] Available at: http://www.nddb.org/sites/default/files/sites/default/files/pdfs/merged_document2- 3.pdf [Accessed at: 4 July 2015]. 9. NDDB Statistics, 2015. Per Capita Availably of Milk by States. [Online] Available at: http://www.nddb.org/information/stats/percapitavail [Accessed at: 4 July 2015]. 10. NDDB Statistics, 2015. Livestock Population in India by Species. [Online] Available at: http://www.nddb.org/information/stats/pop [Accessed at: 4 July 2015]. 11. NDDB Statistics, 2015. Milch Animal Population by States [Online] Available at: http://www.nddb.org/information/stats/milch [Accessed at: 4 July 2015]. 12. Fao Stat, 2015. Milk Production by Countries [Online] Available at: http://faostat.fao.org/site/535/default.aspx#ancor [Accessed at: 4 July 2015].
- 39. i 9. ANNEXURE 9.1 Annexure 1 Table 18: Categories schemes of average herd size, average daily milk production, average number of milking cows and average number of milking buffalos Average Herd Size Average daily milk production Average no. of milking cows Average no. of milking buffalos 5 10 2 2 15 30 5 5 25 50 8 8 35 70 11 11 45 90 14 14 55 110 17 17 More than 60 More than 120 More than 18 More than 18 Table 19: Category scheme of infrastructure index Have Cattle Shed Water in cattle shed Electricity in cattle shed Fodder room Low voltage issue Power cuts None of the above Yes 1 1 1 1 0 0 1 No 0 0 0 0 1 1 0
- 40. ii Table 20: Category scheme of number of assets own Assets Yes No Electricity Connection 1 0 Ceiling Fan 1 0 LPG Stove 1 0 Two Wheeler 1 0 Colour TV 1 0 Refrigerator 1 0 Washing Machine 1 0 Personal Computer/Laptop 1 0 Car/Jeep/Van 1 0 Air Conditioner 1 0 Owned Agriculture Land Area 1 0 Total 11
- 41. iii 9.2 Annexure 2 NDDB Questionnaire Q1. Following data with timeline (Historical to current) for Gujarat state : Penetration rate of milking machine Price of milking machine Milk price Effect on milk production due to use of milking machine Labour wage paid to labour for milking the cow Population of bovine animals in every village Milk production of every district Milk production of every village Accidental rate of milking machine Village level data on power use of farm technology ( to map tech-savvy farmers) Q2. What is the economic status of current holders of milking machine in Gujarat? (to know income level and land holding ) Q3. What is the herd size of bovine animals own by current holders of milking machine in Gujarat? Q4. Effect of following factors on penetration of milking machine: Inconsistent power supply Operating Noise Quality of milk State of the udders of cow Hygiene of machine Religious belief Price of milking machine Size of machine Handling of machine Time taken to milking a cattle Misconception about machine Repairing and maintenance of machine Machine work as vector for disease transmission in animals Space requirement for machine
- 42. iv 9.3 Annexure 3 Exploratory Study Questionnaire Basic Information Name Village Name District Name Mobile Number How many cattle you own? How many buffalo you own? Does cow give milk whole year Does buffalo give milk whole year What are the breeds you own, purchased price and pressure applied on teats? Cattle Buffalo Breed Name Pressure Price Breed Name Pressure Price If they have no buffalo then what is the reason behind this? Is there any pressure difference between cow and buffalo during milking?
- 43. v Everyday how much milk is produced and use of milk? Quantity (Per Day) Selling Price Domestic Total Revenue Morning Evening Cow Buffalo How do you milk? Manually By machine If manually then how you milk If manually, then you use which type of labour (Write down number of labours)? Hired Labour Domestic Labour Is hired labour indulges in milking only or any other purposes? Milking only (Day time) Milking only (Night time) Milking both time Agriculture Bovine Care Others If hired labour then how you pay them(please quantify this on daily basis)? Only Milk Only Money Both Per person Cost Total Labour Cost Everyday how much cattle feed is required. Required Cattle Feed/day Per Kg Cost Total Cost/day/month If you use milking machine, then you use which type of labour (No. of labour)? Hired Labour Domestic Labour If hired labour then how you pay them (please quantify this on daily basis)? Only Milk Only Money Both Per person Cost
- 44. vi Total Labour Cost Is hired labour indulges in milking or other purposes? Milking only (Day time) Milking only (Night time) Milking both time Agriculture Bovine Care Others Why do you not use machine for milking? Lack of money to purchase the machine Not enough cattle to achieve any benefit from machine Electricity problem Religious belief Misconception about machine Any Other Give us information about those individual who uses machine Name:______________________________________________ Village:____________________________________________ Contact no._________________________________________ You can do the milking of only two cows if you use a movable machine. If you use stationary machine you can do milking of more number of cows but stationary will cost more than movable.
- 45. vii So which kind of machine you want? Movable Stationary Answer these in yes/No. Yes No Power cut during milking timings Power source availability in cattle shed Any incident of damage of teats due to manual milking Problems you face on manual milking How many teats you use for milking? 2 Teats 3 Teats 4 Teats When Calf is there When no calf Quantity of milk through each teat is similar or dissimilar (FTY:- Facing Towards You)? Yes No If yes then tick the combinations Seasonality wise milk production:- Summer Spring Winter Autumn
- 46. viii Name of diseases which can be transmittable from one bovine to other due to use of contaminated machine. If you are using machine then tell us following details: Company Name For how long you are using milking machine What was the cost of milking machine How much time it takes to milk a single cow Benefit of machine Have you faced any problem Which do milking fast manual or machine Why you install the milking machine Every day, suppose we come to your doorsteps and do milking of your animals. Will you sell your milk to us? 9.4 Annexure 4 Final Study Questionnaire
- 47. ix Screening Questions:NAME Screening Question: How many total bovines (cow + buffalo) you own? Lesser than 5 In between 5 to 10 More than 10 How many milking bovines (cow + buffalo) you own? Lesser than 3 In between 3 to 8 More than 8 (If total cow + buffalo or milking cow + buffalo number are less than 5 then do not survey the respondent.) 1. Basis Variables: A. Socio-Economic Classification Items owned/ have access at home Encircle Tick Electricity Connection 01 Ceiling Fan 02 LPG Stove 03 Two Wheeler 04 Colour TV 05 Refrigerator 06 Washing Machine 07 Personal Computer/ Laptop 08 Car/Jeep/Van 09 Air Conditioner 10 Owned Agriculture Land area 11 Number of Standard 11 Owned No. of Durables (TRANSFER) Illiterate Literate but no formal schooling/ School up to 4 years School- 5 to 9 years SSC/ HSC Some College (incl a Diploma) but not Grad Graduate/ Post Graduate: General Graduate/ Post Graduate: Profession al 1 2 3 4 5 6 7 None E3 E2 E2 E2 E2 E1 D2 1 E2 E1 E1 E1 D2 D2 D2 2 E1 E1 D2 D2 D1 D1 D1 3 D2 D2 D1 D1 C2 C2 C2 4 D1 C2 C2 C1 C1 B2 B2 5 C2 C1 C1 B2 B1 B1 B1 6 C1 B2 B2 B1 A3 A3 A3 7 C1 B1 B1 A3 A3 A2 A2 8 B1 A3 A3 A3 A2 A2 A2 9+ B1 A3 A3 A2 A2 A1 A1 Sr No. Date: Pic Id: Done By: Name: Phone No: Village: ` Taluka: District:
- 48. x B. Basic Information: For this section please write exact numbers in second row of every question, also tick the range in fist row. 1. How many cows you own? 5 < No. < 10 10 <= No. < 20 20 <= No. < 30 No >= 30 2. What is the number of milking cows you own? No. < 5 5 <= No. < 10 10 <= No. < 20 More than =20 3. How many female calves you currently own? No. < 5 5 <= No. < 10 10 <= No. < 20 More than = 20 4. How many buffalos you own? 5 < No. < 10 10 <= No. < 20 20 <= No. < 30 No => 30 5. What is the number of milking buffalos you own? No. < 5 5 <= No. < 10 10 <= No. < 20 More than =20 6. How many female buffalo’s calves you currently own? No. < 5 5 <= No. < 10 10 <= No. < 20 More than =20 C. Unit Economics: 1. How many litres of cow milk produced every day? litres < 30 30 <= litres <60 60 <= litres < 90 90 <= litres < 150 150 < =litres <250 More > 250 2. How many litres of buffalo milk produced every day? litres <= 30 30 <=litres <60 60 < =litres < 90 90 < =litres < 150 150 < =litres <250 More > 250 3. What is the milking period of a cow? 6 months 7 months 8 months 9 months 10 months 11 months 4. What is the milking period of a buffalo? 3 months 4 months 5 months 6 months 7 months 8 months 5. How much milk cow produce every year? 12. Which breed of cow you own? 6. How much milk a buffalo produce every year? 13. Which breed of buffalo you own? 7. What is the selling price of one litre of cow milk? 8. What is the selling price of one litre of buffalo milk? 9. What fodder you use to feed cattle? Green grass Dry grass Amul fodder Kapas Makka Un-known Price per Kg ` Qty Per Day (Cow) Qty Per Day (Buffalo) 10. Do you measure individual cow produce milk? Yes No 10.1 If yes to (Q No. 10 then why) 11. Who is major buyer of your milk?
- 49. xi D. Infrastructure: 1. Do you have cattle shed facilities? Yes No 2. Do you have water facility in your cow shed? Yes No 3. Do you have electricity in your cow shed? (If yes in Sec A electricity question) Yes No 4. Are you facing low voltage issue? Yes No 5. Power cuts during milking time? Yes No 6. Do you have facility for keeping fodder? Yes No E. Milking Machine: 1. Do you own milking machine? (If No then go to sec no. G) Yes No 1.1 If yes (Qno.1), then reasons that motivated you to purchase milking machine? Labour force requirement Second alternative Facing time issues Future growth Any other Any other (Please Specify) 1.2 How many people you require for handling milking machine? 1 Person 2 People 3 People 1.3 Is there any reduction in labour force after installing the milking machine? Yes No 1.4 What was cattle strength when you purchased the milking machine? 10 < =Size 10 < =Size < 20 20 <= Size < 30 30 <= Size < 40 Size > 40 F. Qualitative Research on Milking Machine (if own a milking machine): 1. Company Name 2. From which vendor you purchased machine 3. For how long you are using milking machine 4. What was the cost of milking machine 5. How much time it takes to milk a single cow 6. Did you get any subsidy on machine? Yes No 6.1 If yes, then how much? 7. Did you get any warranty on machine? Yes No 8. If yes then duration of warranty 9. Benefits of machine
- 50. xii 10. Any Adverse effect on animal due to use of milking machine 11. Method of Machine Cleaning Operation 12. Maintenance of Milking machine 13. Any breakdown incident 13.1 If yes, then how many times breakdown happed, which part 13.2How you resolved the issue 13.3What other features you want in Machine 14. Any Other G. Quantitative Research on milking machine (If no to QNo. 1 of Sec E ) 1. Do you want to install milking machine in future? Yes No 1.1 If yes (QNo.1), then what will be the minimum number of cattle you require to install machine? 5 < Size 5 <= Size < 10 10 <= Size < 15 15 <= Size < 20 Size > 20 1.2 If yes to (QNo.1), What all features you want in Machine? 1.2 If no (QNo. 1) then what are the reasons? Lack of money Not enough Cattle Electricity Problem Religious Belief Misconception about machine Any Other H. Hired Labour 1. Do you use hired labour for milking? Yes No 2. If yes (Q no. 1), then hired labour is indulge in milking only or any other activity? Milking only (Day time) Milking only (Night time) Milking both time Agriculture Bovine Care Others
- 51. xiii 3. How much you pay to hired labour? No. of hired Labour Male: Female: Salary (Per Month) Milk (Per Day) 2. Conjoint Analysis: Please rate the following profile in the scale mentioned below: Suppose you are going to purchase a milking machine. One by one, we are going to show you various options available in the market. Please tell us which one will you buy, will not buy or cannot say anything. For example: A machine which has following features movable, electricity as a power source, can milk two cows and cost of machine is around 25000. I will buy this machine. Definitely will not buy Probably will not buy Not Sure Probably will buy Definitely will buy 1 2 3 4 5 Card ID Type of Machine Power Source No. of cow milk at a time Price Rating 1 Movable Alternate Source of Power One 28000 4 Stationary Only Electricity Two 28000 7 Movable Only Electricity Two 24500 6 Stationary Alternate Source of Power One 24500 9 Stationary Alternate Source of Power One 21500 3 Stationary Only Electricity One 21500 5 Stationary Alternate Source of Power Two 21500 10 Stationary Only Electricity Two 21500 8 Movable Alternate Source of Power Two 21500 2 Movable Only Electricity One 21500
- 52. xiv 3. Descriptive Variable:- How much selected variable is important than other? Like other machines milking machine too have many features. Suppose you are going to purchase a milking machine in market. We are requesting you to do a pairwise comparison of features. Like, I am going to purchase a milking machine. Similar question is asked from me to compare price with milking time and for me milking time is more important than price of machine as shown in pic 5. Equally Important Moderately Important Strongly Important Very Strongly Important Extremely Important 1 2 3 4 5 Milking Time Price Machine Type To milk one cow at a time or more To milk cow or buffalo or to milk both Milking Time Price Machine Type To milk one cow at a time or more To milk cow or buffalo or to milk both
- 53. xv 9.5 Annexure 5 Images used to made cards for conjoint analysis. Single cluster machine Alternate source of power Stationary Machine Movable machine Electricity as a source of power