2. 2
Linear Programming modelling in factory planning minimizing overtime costs
Machines
normal t overtime normal t overtime normal t overtime Total Demand
prod a 0.0 0.0 20.0 0.0 0.0 0.0 20 20
prod b 4.0 0.0 16.0 0.0 0.0 0.0 20 20
prod c 26.0 0.0 0.0 4.0 0.0 0.0 30 30
prod d 0.0 6.0 4.0 0.0 30.0 0.0 40 40
Cost mach. 30 6 40 4 30 0 110
Max cost 30 6 40 8 30 6 120
cost/hour 50
Minimize 5500
mach. running costs
LB R N
Cost` normal t overtime normal t overtime normal t overtime
prod a 0.0 0.0 1000.0 0.0 0.0 0.0
prod b 200.0 0.0 800.0 0.0 0.0 0.0
prod c 1300.0 0.0 0.0 200.0 0.0 0.0
prod d 0.0 300.0 200.0 0.0 1500.0 0.0
Total 1500 300 2000 200 1500 0
A B B
3. 3
Linear Programming Factory planning, maximizing product revenue under capacity
constraints
Considering the lack of capacity at ME for Prod D, the optimum solution that maximized
revenue was to use the free capacity at CH to assemble extra 10 and transfer them to
AMER.
Capacity CH CZ ME Total capacity
Prod A 30 15 10 55
Prod B 30 25 20 75
Prod C 150 120 80 350
Prod D 30 20 10 60
Total 240 180 120 540
Demand APAC EMEA AMER Total demand
Prod A 30 15 10 55
Prod B 30 25 20 75
Prod C 150 120 50 320
Prod D 20 20 20 60
Total 230 180 100 510
Production CH CZ ME Total production
Prod A 30 15 10 55
Prod B 30 25 20 75
Prod C 150 120 50 320
Prod D 30 20 10 60
240 180 90 510
Product cost matrix $
Prod A 1000
Prod B 750
Prod C 150
Prod D 780
MAX $ 206,050
4. 4
Queue Theory modelling analysing supply capacity and production machine
Supplier Capacity Analysis
week
Supply 1000
Demand 1250
Traffic intensity: 0.8
Average number of units in the queue: 3.20000
Probability of having to wait for service: 0.80000
Average time in the system (minutes): 0.00400
Probability that there are n units (≥ 0) in the system: n
0 0.20000
1 0.16000
2 0.12800
3 0.10240
4 0.08192
5 0.06554
Machine Capacity Analysis
Products
Interarrival
time
Service
time
Arrival
time
Start of
service
End of
service
Overall
queuing
time
Time in
the
system
1 5 9 5 5 14 0 9
2 11 13 16 16 29 0 13
3 10 12 26 29 41 3 15
4 10 12 36 41 53 5 17
5 11 9 47 53 62 6 15
6 6 12 53 62 74 9 21
7 6 11 59 74 85 15 26
8 8 14 67 85 99 18 32
Average: 7 18.5
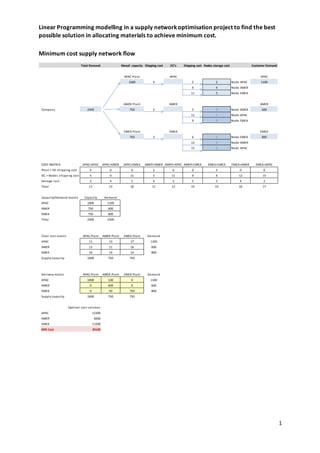
5. 5
1) Initial logistics material flow network
2) Optimized distribution network with a mini-logistics shortest path least cost strategy
with minimum flow, shortest path at least cost
HAM
ZUR
2
AMS 2
5 BER GVA
3
BRU 2 2
3 FRA 4 PAR 5
PRA
4
3 3 3
2 MUN 5
LUX MIL
POR
3 2
VIE MAD
2
2 3 ROM
2
2 BUD LIS
LJU
2 3 5
ZAG 3
BEL BUC
2
4
SAR 6
5 SOF
IST
ATH