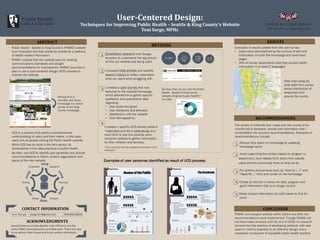
SlideShare a Scribd company logo
1 of 1
Download to read offline
RESULTS
METHODS
RECOMMENDATIONS
User-­‐‑Centered	
  Design:
Techniques	
  for	
  Improving	
  Public	
  Health	
  – Seattle	
  &	
  King	
  County’s	
  Website
Toni	
  Sarge,	
  MPHc
CONTACT	
  INFORMATION
ACKNOWLEDGMENTS
ABSTRACT
Public Health
Seattle & King County
1
2
3
5
4
• Public Health - Seattle & King County’s (PHSKC) website
is an important tool that residents access for a plethora
of health related information.
• PHSKC realized that the website was not meeting
communications standards and sought
recommendations for improvement. PHSKC launched a
plan to use a user-centered design (UCD) process to
improve the website.
• UCD is a process that seeks a comprehensive
understanding of users and their needs. In this case,
users are all people visiting the Public Health website.
• While UCD has its roots in the tech sector, its
philosophies mirror best practices in public health
• My task: use UCD to identify user personas and provide
recommendations to inform content organization and
layout of the new website.
1
3
2
4
Toni Sarge sarge.toni@gmail.com 408-892-8918
I created a specific UCD activity called a
*card sort and did a case study at a
local clinic to see how parents were
using the website to gather information
for their children and families.
*Try a card sort with the supplies in the folder on the
side panel
Examples of results yielded from the user survey:
• Users were overwhelmed by the amount of text and
information on both the homepage and lower level
pages
• 20% of survey respondents said they access health
information in at least 2 languages.
The variety of methods that I used over the course of six
months led to feedback, results and information that I
consolidated into succinct recommendations. Examples of
recommendations include:
Special	
  thanks	
  to	
  Lindsay	
  Bosslet,	
  Faon O’Connor	
  and	
  the	
  
entire	
  PHSKC	
  Communications	
  and	
  Web	
  team.	
  Thank	
  you	
  also	
  
to	
  my	
  advisor	
  Peter	
  House	
  and	
  to	
  our	
  partner	
  Anthrotech.
Qualitative research with Google
Analytics to understand the big picture
of how our website was being used.
I reviewed help emails and website
search history to better understand
what our users were struggling with.
I created a user survey that was
featured on the website homepage
which allowed me to gather specific
qualitative and quantitative data
regarding:
• User tasks and goals
• User behaviors and attitudes
• Satisfaction with the website
• User demographics
Examples of user personas identified as result of UCD process:
Research
Planning
AnalysisDesign
Testing
Evaluation
USER
Top Pages
Time
spent on
page
Number
of page
views
Jul ‘15-
Jan ‘16
Q2.How often do you visit the Public
Health - Seattle & King County
website (kingcounty.gov/health)?
(n=135)
Create an archive or library for data, program and
grant information that is no longer current
Put actions and services such as “How do I…?” and
“Apply for…” front and center on the homepage
Make contact information for staff easier to find for
users
Reduce time spent on homepage by updating
homepage layout
Avoid organizing the content based on program or
department, and instead think about how outside
users and the community think of what we do
PHSKC will compare website traffic before and after the
recommendations were implemented. Though PHSKC will
not have these answers until the end of 2016 my research
showed how the practice of developing products with real
users in mind is essential to an effective design and a
necessary component of equitable public health practice.
Moving from a
crowded, text heavy
homepage to a layout
similar to the King
County homepage.
Heat map using zip
code data from survey
shows distribution of
responses from
around the county.
CONCLUSION

More Related Content

Similar to WSPHA Poster_UCD_Oct2016_PDF

Using Data to Improve Hospital Marketing
Using Data to Improve Hospital MarketingUsing Data to Improve Hospital Marketing
Using Data to Improve Hospital MarketingAhava Leibtag
 
Core Model Workshop
Core Model WorkshopCore Model Workshop
Core Model WorkshopAre Halland
 
Data for Social Good - 由資料驅動的公益新浪潮
Data for Social Good - 由資料驅動的公益新浪潮Data for Social Good - 由資料驅動的公益新浪潮
Data for Social Good - 由資料驅動的公益新浪潮DSP智庫驅動
 
Customer service delivery master presentation
Customer service delivery master presentationCustomer service delivery master presentation
Customer service delivery master presentationEngageBusinessNetwork
 
Customer service delivery master presentation
Customer service delivery master presentationCustomer service delivery master presentation
Customer service delivery master presentationEngageBusinessNetwork
 
Customer service delivery master presentation
Customer service delivery master presentationCustomer service delivery master presentation
Customer service delivery master presentationArgent Ram Media
 
Want Easier Decision Making Just Listen to Your Users
Want Easier Decision Making Just Listen to Your Users Want Easier Decision Making Just Listen to Your Users
Want Easier Decision Making Just Listen to Your Users Mikan Associates
 
6 essential things for businesses to know about content design
6 essential things for businesses to know about content design6 essential things for businesses to know about content design
6 essential things for businesses to know about content designLizzieBruce
 
Business Analysis: Montana Dept Health & Human Services
Business  Analysis: Montana Dept Health & Human ServicesBusiness  Analysis: Montana Dept Health & Human Services
Business Analysis: Montana Dept Health & Human ServicesKim Boggio
 
FINAL Internship Abstract
FINAL Internship AbstractFINAL Internship Abstract
FINAL Internship AbstractEwelina Gwiszcz
 
Eating an elephant: how to build an integrated digital strategy one bite at a...
Eating an elephant: how to build an integrated digital strategy one bite at a...Eating an elephant: how to build an integrated digital strategy one bite at a...
Eating an elephant: how to build an integrated digital strategy one bite at a...@chrisboyer LLC
 
Understanding Online Audiences Bazley Ma Wonder Web 10 Jun09
Understanding Online Audiences Bazley Ma Wonder Web 10 Jun09Understanding Online Audiences Bazley Ma Wonder Web 10 Jun09
Understanding Online Audiences Bazley Ma Wonder Web 10 Jun09Martin Bazley
 
Yara presentation (sp) (06.2014) v2 non
Yara presentation (sp) (06.2014) v2 nonYara presentation (sp) (06.2014) v2 non
Yara presentation (sp) (06.2014) v2 nonPatricia Reynolds
 

Similar to WSPHA Poster_UCD_Oct2016_PDF (20)

Sarge_Practicum_UCD
Sarge_Practicum_UCDSarge_Practicum_UCD
Sarge_Practicum_UCD
 
Using Data to Improve Hospital Marketing
Using Data to Improve Hospital MarketingUsing Data to Improve Hospital Marketing
Using Data to Improve Hospital Marketing
 
Core Model Workshop
Core Model WorkshopCore Model Workshop
Core Model Workshop
 
Gelb Growing By Interacting
Gelb Growing By InteractingGelb Growing By Interacting
Gelb Growing By Interacting
 
A user-led approach to web content | Carla Scott | March 2015
A user-led approach to web content | Carla Scott | March 2015A user-led approach to web content | Carla Scott | March 2015
A user-led approach to web content | Carla Scott | March 2015
 
Website User Feedback
Website User FeedbackWebsite User Feedback
Website User Feedback
 
Data for Social Good - 由資料驅動的公益新浪潮
Data for Social Good - 由資料驅動的公益新浪潮Data for Social Good - 由資料驅動的公益新浪潮
Data for Social Good - 由資料驅動的公益新浪潮
 
Customer service delivery master presentation
Customer service delivery master presentationCustomer service delivery master presentation
Customer service delivery master presentation
 
Customer service delivery master presentation
Customer service delivery master presentationCustomer service delivery master presentation
Customer service delivery master presentation
 
Customer service delivery master presentation
Customer service delivery master presentationCustomer service delivery master presentation
Customer service delivery master presentation
 
nih-analytics-executive-summary
nih-analytics-executive-summarynih-analytics-executive-summary
nih-analytics-executive-summary
 
Want Easier Decision Making Just Listen to Your Users
Want Easier Decision Making Just Listen to Your Users Want Easier Decision Making Just Listen to Your Users
Want Easier Decision Making Just Listen to Your Users
 
6 essential things for businesses to know about content design
6 essential things for businesses to know about content design6 essential things for businesses to know about content design
6 essential things for businesses to know about content design
 
CALPACT Webinar: Using Infographics and Data Visualization
CALPACT Webinar:  Using Infographics and Data VisualizationCALPACT Webinar:  Using Infographics and Data Visualization
CALPACT Webinar: Using Infographics and Data Visualization
 
Business Analysis: Montana Dept Health & Human Services
Business  Analysis: Montana Dept Health & Human ServicesBusiness  Analysis: Montana Dept Health & Human Services
Business Analysis: Montana Dept Health & Human Services
 
FINAL Internship Abstract
FINAL Internship AbstractFINAL Internship Abstract
FINAL Internship Abstract
 
Using online tools to help us assess our public legal education work
Using online tools to help us assess our public legal education work Using online tools to help us assess our public legal education work
Using online tools to help us assess our public legal education work
 
Eating an elephant: how to build an integrated digital strategy one bite at a...
Eating an elephant: how to build an integrated digital strategy one bite at a...Eating an elephant: how to build an integrated digital strategy one bite at a...
Eating an elephant: how to build an integrated digital strategy one bite at a...
 
Understanding Online Audiences Bazley Ma Wonder Web 10 Jun09
Understanding Online Audiences Bazley Ma Wonder Web 10 Jun09Understanding Online Audiences Bazley Ma Wonder Web 10 Jun09
Understanding Online Audiences Bazley Ma Wonder Web 10 Jun09
 
Yara presentation (sp) (06.2014) v2 non
Yara presentation (sp) (06.2014) v2 nonYara presentation (sp) (06.2014) v2 non
Yara presentation (sp) (06.2014) v2 non
 

WSPHA Poster_UCD_Oct2016_PDF

  • 1. RESULTS METHODS RECOMMENDATIONS User-­‐‑Centered  Design: Techniques  for  Improving  Public  Health  – Seattle  &  King  County’s  Website Toni  Sarge,  MPHc CONTACT  INFORMATION ACKNOWLEDGMENTS ABSTRACT Public Health Seattle & King County 1 2 3 5 4 • Public Health - Seattle & King County’s (PHSKC) website is an important tool that residents access for a plethora of health related information. • PHSKC realized that the website was not meeting communications standards and sought recommendations for improvement. PHSKC launched a plan to use a user-centered design (UCD) process to improve the website. • UCD is a process that seeks a comprehensive understanding of users and their needs. In this case, users are all people visiting the Public Health website. • While UCD has its roots in the tech sector, its philosophies mirror best practices in public health • My task: use UCD to identify user personas and provide recommendations to inform content organization and layout of the new website. 1 3 2 4 Toni Sarge sarge.toni@gmail.com 408-892-8918 I created a specific UCD activity called a *card sort and did a case study at a local clinic to see how parents were using the website to gather information for their children and families. *Try a card sort with the supplies in the folder on the side panel Examples of results yielded from the user survey: • Users were overwhelmed by the amount of text and information on both the homepage and lower level pages • 20% of survey respondents said they access health information in at least 2 languages. The variety of methods that I used over the course of six months led to feedback, results and information that I consolidated into succinct recommendations. Examples of recommendations include: Special  thanks  to  Lindsay  Bosslet,  Faon O’Connor  and  the   entire  PHSKC  Communications  and  Web  team.  Thank  you  also   to  my  advisor  Peter  House  and  to  our  partner  Anthrotech. Qualitative research with Google Analytics to understand the big picture of how our website was being used. I reviewed help emails and website search history to better understand what our users were struggling with. I created a user survey that was featured on the website homepage which allowed me to gather specific qualitative and quantitative data regarding: • User tasks and goals • User behaviors and attitudes • Satisfaction with the website • User demographics Examples of user personas identified as result of UCD process: Research Planning AnalysisDesign Testing Evaluation USER Top Pages Time spent on page Number of page views Jul ‘15- Jan ‘16 Q2.How often do you visit the Public Health - Seattle & King County website (kingcounty.gov/health)? (n=135) Create an archive or library for data, program and grant information that is no longer current Put actions and services such as “How do I…?” and “Apply for…” front and center on the homepage Make contact information for staff easier to find for users Reduce time spent on homepage by updating homepage layout Avoid organizing the content based on program or department, and instead think about how outside users and the community think of what we do PHSKC will compare website traffic before and after the recommendations were implemented. Though PHSKC will not have these answers until the end of 2016 my research showed how the practice of developing products with real users in mind is essential to an effective design and a necessary component of equitable public health practice. Moving from a crowded, text heavy homepage to a layout similar to the King County homepage. Heat map using zip code data from survey shows distribution of responses from around the county. CONCLUSION