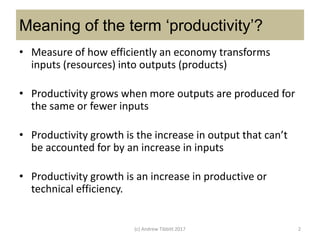
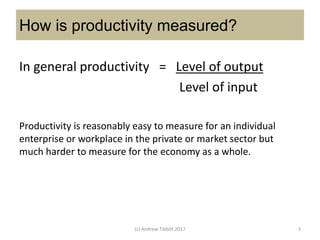
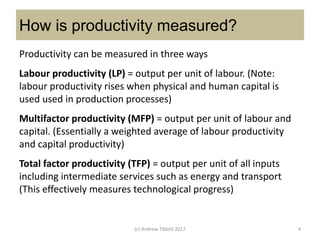
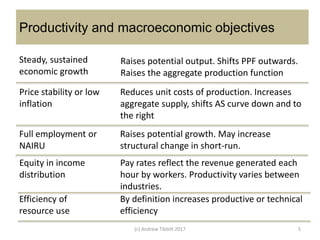
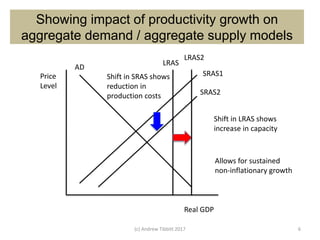
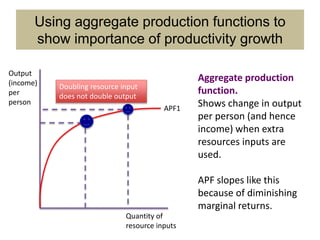
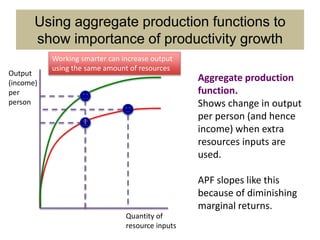
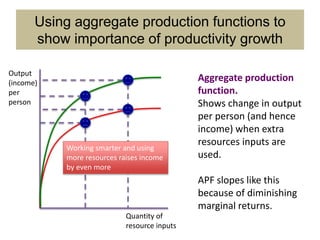
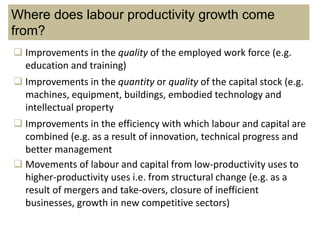
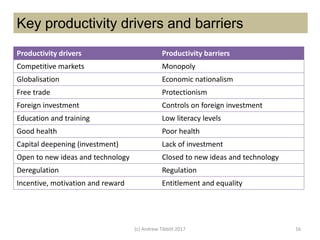
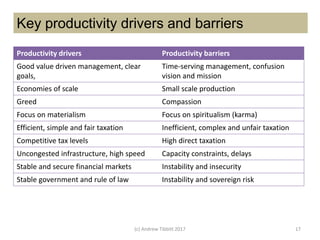
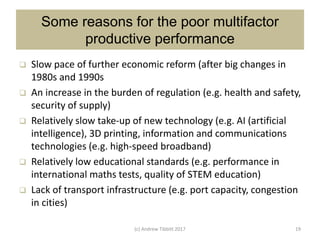
Productivity
WACE Economics – Unit 4
Slideshow 16.1
(c) Andrew Tibbitt 2017 1
Meaning of the term ‘productivity’?
• Measure of how efficiently an economy transforms
inputs (resources) into outputs (products)
• Productivity grows when more outputs are produced for
the same or fewer inputs
• Productivity growth is the increase in output that can’t
be accounted for by an increase in inputs
• Productivity growth is an increase in productive or
technical efficiency.
(c) Andrew Tibbitt 2017 2
How is productivity measured?
In general productivity = Level of output
Level of input
(c) Andrew Tibbitt 2017 3
Productivity is reasonably easy to measure for an individual
enterprise or workplace in the private or market sector but
much harder to measure for the economy as a whole.
How is productivity measured?
Productivity can be measured in three ways
Labour productivity (LP) = output per unit of labour. (Note:
labour productivity rises when physical and human capital is
used used in production processes)
Multifactor productivity (MFP) = output per unit of labour and
capital. (Essentially a weighted average of labour productivity
and capital productivity)
Total factor productivity (TFP) = output per unit of all inputs
including intermediate services such as energy and transport
(This effectively measures technological progress)
(c) Andrew Tibbitt 2017 4
Productivity and macroeconomic objectives
Steady, sustained
economic growth
Raises potential output. Shifts PPF outwards.
Raises the aggregate production function
Price stability or low
inflation
Reduces unit costs of production. Increases
aggregate supply, shifts AS curve down and to
the right
Full employment or
NAIRU
Raises potential growth. May increase
structural change in short-run.
Equity in income
distribution
Pay rates reflect the revenue generated each
hour by workers. Productivity varies between
industries.
Efficiency of
resource use
By definition increases productive or technical
efficiency
(c) Andrew Tibbitt 2017 5
Showing impact of productivity growth on
aggregate demand / aggregate supply models
(c) Andrew Tibbitt 2017 6
Price
Level
Real GDP
AD
LRAS
SRAS1
SRAS2
LRAS2
Shift in LRAS shows
increase in capacity
Shift in SRAS shows
reduction in
production costs
Allows for sustained
non-inflationary growth
Using aggregate production functions to
show importance of productivity growth
Aggregate production
function.
Shows change in output
per person (and hence
income) when extra
resources inputs are
used.
APF slopes like this
because of diminishing
marginal returns.
Output
(income)
per
person
Quantity of
resource inputs
Doubling resource input
does not double output
APF1
Aggregate production
function.
Shows change in output
per person (and hence
income) when extra
resources inputs are
used.
APF slopes like this
because of diminishing
marginal returns.
Output
(income)
per
person
Quantity of
resource inputs
Working smarter can increase output
using the same amount of resources
Using aggregate production functions to
show importance of productivity growth
Aggregate production
function.
Shows change in output
per person (and hence
income) when extra
resources inputs are
used.
APF slopes like this
because of diminishing
marginal returns.
Output
(income)
per
person
Quantity of
resource inputs
Working smarter and using
more resources raises income
by even more
Using aggregate production functions to
show importance of productivity growth
Productivity and living standards
Income (as opposed to output) is affected by changes in :
 The terms of trade (price received for exports compared to
price paid for imports)
 Labour utilisation (affected by rate of unemployment,
participation rates and level of under-employment)
 Net foreign income (outflow of incomes, dividends and profits
from foreign investment)
 Capital depreciation (spending on replacement capital)
 Productivity (efficiency of use of resources)
In the long-run productivity is the most significant factor
(c) Andrew Tibbitt 2017 10
Australia’s productivity performance
Average rates of economic cycles. Labour productivity has continued to grow at
about 2% per year, but multifactor productivity is growing at a slower rate.
(c) Andrew Tibbitt 2017 11
Australia’s productivity performance
Recently labour productivity has been growing as a result of capital deepening
(more capital per worker) rather than the quality of inputs and the way
production is organised.
(c) Andrew Tibbitt 2017 12
Productivity varies from industry to industry
Mining Multifactor productivity in mining fell during the
capacity building phase of the mining boom, due
to long lead time between investment and output.
Now capacity exists productivity will rebound.
Agriculture Multifactor productivity varies as a result of
natural events such as droughts, floods and
cyclones. Poor growing conditions reduces
agricultural output even though the level of inputs
stays much the same.
Utilities Increased emphasis on security of supply (e.g.
power in peak times and ‘drought proofing’) and
environmental sustainability (e.g. renewable
energy) has increased capital inputs without
corresponding increase in output
(c) Andrew Tibbitt 2017 13
Key drivers of productivity growth
Immediate
causes such as…
Technical change embedded in new capital
Human capital (improved education and health)
Research and development
Economies of scale
Improved management
Underlying
factors such as…
Level of competition
Trade and investment openness
Transport infrastructure
Structure of output
Fundamental
influences such
as …
Stability in macroeconomic policies and priorities
Appetite for innovation and risk
Cultural and social factors
Formal and informal ‘rules of the game’ (e.g. level
of incentives, sovereign risk)
Access to finance
(c) Andrew Tibbitt 2017 14
Where does labour productivity growth come
from?
 Improvements in the quality of the employed work force (e.g.
education and training)
 Improvements in the quantity or quality of the capital stock (e.g.
machines, equipment, buildings, embodied technology and
intellectual property
 Improvements in the efficiency with which labour and capital are
combined (e.g. as a result of innovation, technical progress and
better management
 Movements of labour and capital from low-productivity uses to
higher-productivity uses i.e. from structural change (e.g. as a
result of mergers and take-overs, closure of inefficient
businesses, growth in new competitive sectors)
(c) Andrew Tibbitt 2017 16
Key productivity drivers and barriers
Productivity drivers Productivity barriers
Competitive markets Monopoly
Globalisation Economic nationalism
Free trade Protectionism
Foreign investment Controls on foreign investment
Education and training Low literacy levels
Good health Poor health
Capital deepening (investment) Lack of investment
Open to new ideas and technology Closed to new ideas and technology
Deregulation Regulation
Incentive, motivation and reward Entitlement and equality
(c) Andrew Tibbitt 2017 17
Key productivity drivers and barriers
Productivity drivers Productivity barriers
Good value driven management, clear
goals,
Time-serving management, confusion
vision and mission
Economies of scale Small scale production
Greed Compassion
Focus on materialism Focus on spiritualism (karma)
Efficient, simple and fair taxation Inefficient, complex and unfair taxation
Competitive tax levels High direct taxation
Uncongested infrastructure, high speed Capacity constraints, delays
Stable and secure financial markets Instability and insecurity
Stable government and rule of law Instability and sovereign risk
Why does productivity rise and fall during the
economic cycle?
In recoveries
and booms
Productivity rises because:
• Business operates nearer to capacity
• Economies of scale can be achieved
In downturns
and slumps
Productivity falls because:
• Businesses operate with spare capacity
• Workers kept on to protect investment in
skills and experience
• Capital may be costly to mothball or
decommission or have little second-hand
value
(c) Andrew Tibbitt 2017 18
Some reasons for the poor multifactor
productive performance
 Slow pace of further economic reform (after big changes in
1980s and 1990s
 An increase in the burden of regulation (e.g. health and safety,
security of supply)
 Relatively slow take-up of new technology (e.g. AI (artificial
intelligence), 3D printing, information and communications
technologies (e.g. high-speed broadband)
 Relatively low educational standards (e.g. performance in
international maths tests, quality of STEM education)
 Lack of transport infrastructure (e.g. port capacity, congestion
in cities)
(c) Andrew Tibbitt 2017 19
The role of the government in productivity
growth
Interventionist measures
Deal with areas of market
failure including:
• Insufficient competition
• Under-production of public
and merit goods
• Accounting for externalities
• Natural monopolies
• Damage to common access
resources
Market-orientated measures
Deal with areas of government
failure including:
• Rent seeking
• Lack of clear goals
• Lack of moral hazard
• Bureaucratic
• Feather bedding
• Over-regulation
(c) Andrew Tibbitt 2017 20
Areas of economic reform
 State / Federal relations (avoidance of duplicate regulations)
 Financial market reform (e.g. conduct of banks and financial
markets)
 Product market reform (e.g. competition, trade openness)
 Infrastructure capacity (e.g. ports, urban transport)
 Labour market reform (e.g. wage determination and working
conditions)
 International trade and investment agreements (e.g.
Australia-China free trade agreement)
 Taxation and welfare reform (e.g. balance of rewards and
entitlements)
(c) Andrew Tibbitt 2017 21
Talking points
1. Using diagrams, show how productivity growth can lead
to higher incomes
2. Explain the difference between demand-side and
supply-side policies
3. Distinguish between market-based and interventionist
supply-side policies
4. Discuss the proposition that sustained growth can only
be achieved through supply-side measures
5. ‘Productivity is not everything, but in the long-run it is
almost everything’. Discuss.
End of slide show
(c) Andrew Tibbitt 2017 23

Productivity in Australia

  • 1.
    Productivity WACE Economics –Unit 4 Slideshow 16.1 (c) Andrew Tibbitt 2017 1
  • 2.
    Meaning of theterm ‘productivity’? • Measure of how efficiently an economy transforms inputs (resources) into outputs (products) • Productivity grows when more outputs are produced for the same or fewer inputs • Productivity growth is the increase in output that can’t be accounted for by an increase in inputs • Productivity growth is an increase in productive or technical efficiency. (c) Andrew Tibbitt 2017 2
  • 3.
    How is productivitymeasured? In general productivity = Level of output Level of input (c) Andrew Tibbitt 2017 3 Productivity is reasonably easy to measure for an individual enterprise or workplace in the private or market sector but much harder to measure for the economy as a whole.
  • 4.
    How is productivitymeasured? Productivity can be measured in three ways Labour productivity (LP) = output per unit of labour. (Note: labour productivity rises when physical and human capital is used used in production processes) Multifactor productivity (MFP) = output per unit of labour and capital. (Essentially a weighted average of labour productivity and capital productivity) Total factor productivity (TFP) = output per unit of all inputs including intermediate services such as energy and transport (This effectively measures technological progress) (c) Andrew Tibbitt 2017 4
  • 5.
    Productivity and macroeconomicobjectives Steady, sustained economic growth Raises potential output. Shifts PPF outwards. Raises the aggregate production function Price stability or low inflation Reduces unit costs of production. Increases aggregate supply, shifts AS curve down and to the right Full employment or NAIRU Raises potential growth. May increase structural change in short-run. Equity in income distribution Pay rates reflect the revenue generated each hour by workers. Productivity varies between industries. Efficiency of resource use By definition increases productive or technical efficiency (c) Andrew Tibbitt 2017 5
  • 6.
    Showing impact ofproductivity growth on aggregate demand / aggregate supply models (c) Andrew Tibbitt 2017 6 Price Level Real GDP AD LRAS SRAS1 SRAS2 LRAS2 Shift in LRAS shows increase in capacity Shift in SRAS shows reduction in production costs Allows for sustained non-inflationary growth
  • 7.
    Using aggregate productionfunctions to show importance of productivity growth Aggregate production function. Shows change in output per person (and hence income) when extra resources inputs are used. APF slopes like this because of diminishing marginal returns. Output (income) per person Quantity of resource inputs Doubling resource input does not double output APF1
  • 8.
    Aggregate production function. Shows changein output per person (and hence income) when extra resources inputs are used. APF slopes like this because of diminishing marginal returns. Output (income) per person Quantity of resource inputs Working smarter can increase output using the same amount of resources Using aggregate production functions to show importance of productivity growth
  • 9.
    Aggregate production function. Shows changein output per person (and hence income) when extra resources inputs are used. APF slopes like this because of diminishing marginal returns. Output (income) per person Quantity of resource inputs Working smarter and using more resources raises income by even more Using aggregate production functions to show importance of productivity growth
  • 10.
    Productivity and livingstandards Income (as opposed to output) is affected by changes in :  The terms of trade (price received for exports compared to price paid for imports)  Labour utilisation (affected by rate of unemployment, participation rates and level of under-employment)  Net foreign income (outflow of incomes, dividends and profits from foreign investment)  Capital depreciation (spending on replacement capital)  Productivity (efficiency of use of resources) In the long-run productivity is the most significant factor (c) Andrew Tibbitt 2017 10
  • 11.
    Australia’s productivity performance Averagerates of economic cycles. Labour productivity has continued to grow at about 2% per year, but multifactor productivity is growing at a slower rate. (c) Andrew Tibbitt 2017 11
  • 12.
    Australia’s productivity performance Recentlylabour productivity has been growing as a result of capital deepening (more capital per worker) rather than the quality of inputs and the way production is organised. (c) Andrew Tibbitt 2017 12
  • 13.
    Productivity varies fromindustry to industry Mining Multifactor productivity in mining fell during the capacity building phase of the mining boom, due to long lead time between investment and output. Now capacity exists productivity will rebound. Agriculture Multifactor productivity varies as a result of natural events such as droughts, floods and cyclones. Poor growing conditions reduces agricultural output even though the level of inputs stays much the same. Utilities Increased emphasis on security of supply (e.g. power in peak times and ‘drought proofing’) and environmental sustainability (e.g. renewable energy) has increased capital inputs without corresponding increase in output (c) Andrew Tibbitt 2017 13
  • 14.
    Key drivers ofproductivity growth Immediate causes such as… Technical change embedded in new capital Human capital (improved education and health) Research and development Economies of scale Improved management Underlying factors such as… Level of competition Trade and investment openness Transport infrastructure Structure of output Fundamental influences such as … Stability in macroeconomic policies and priorities Appetite for innovation and risk Cultural and social factors Formal and informal ‘rules of the game’ (e.g. level of incentives, sovereign risk) Access to finance (c) Andrew Tibbitt 2017 14
  • 15.
    Where does labourproductivity growth come from?  Improvements in the quality of the employed work force (e.g. education and training)  Improvements in the quantity or quality of the capital stock (e.g. machines, equipment, buildings, embodied technology and intellectual property  Improvements in the efficiency with which labour and capital are combined (e.g. as a result of innovation, technical progress and better management  Movements of labour and capital from low-productivity uses to higher-productivity uses i.e. from structural change (e.g. as a result of mergers and take-overs, closure of inefficient businesses, growth in new competitive sectors)
  • 16.
    (c) Andrew Tibbitt2017 16 Key productivity drivers and barriers Productivity drivers Productivity barriers Competitive markets Monopoly Globalisation Economic nationalism Free trade Protectionism Foreign investment Controls on foreign investment Education and training Low literacy levels Good health Poor health Capital deepening (investment) Lack of investment Open to new ideas and technology Closed to new ideas and technology Deregulation Regulation Incentive, motivation and reward Entitlement and equality
  • 17.
    (c) Andrew Tibbitt2017 17 Key productivity drivers and barriers Productivity drivers Productivity barriers Good value driven management, clear goals, Time-serving management, confusion vision and mission Economies of scale Small scale production Greed Compassion Focus on materialism Focus on spiritualism (karma) Efficient, simple and fair taxation Inefficient, complex and unfair taxation Competitive tax levels High direct taxation Uncongested infrastructure, high speed Capacity constraints, delays Stable and secure financial markets Instability and insecurity Stable government and rule of law Instability and sovereign risk
  • 18.
    Why does productivityrise and fall during the economic cycle? In recoveries and booms Productivity rises because: • Business operates nearer to capacity • Economies of scale can be achieved In downturns and slumps Productivity falls because: • Businesses operate with spare capacity • Workers kept on to protect investment in skills and experience • Capital may be costly to mothball or decommission or have little second-hand value (c) Andrew Tibbitt 2017 18
  • 19.
    Some reasons forthe poor multifactor productive performance  Slow pace of further economic reform (after big changes in 1980s and 1990s  An increase in the burden of regulation (e.g. health and safety, security of supply)  Relatively slow take-up of new technology (e.g. AI (artificial intelligence), 3D printing, information and communications technologies (e.g. high-speed broadband)  Relatively low educational standards (e.g. performance in international maths tests, quality of STEM education)  Lack of transport infrastructure (e.g. port capacity, congestion in cities) (c) Andrew Tibbitt 2017 19
  • 20.
    The role ofthe government in productivity growth Interventionist measures Deal with areas of market failure including: • Insufficient competition • Under-production of public and merit goods • Accounting for externalities • Natural monopolies • Damage to common access resources Market-orientated measures Deal with areas of government failure including: • Rent seeking • Lack of clear goals • Lack of moral hazard • Bureaucratic • Feather bedding • Over-regulation (c) Andrew Tibbitt 2017 20
  • 21.
    Areas of economicreform  State / Federal relations (avoidance of duplicate regulations)  Financial market reform (e.g. conduct of banks and financial markets)  Product market reform (e.g. competition, trade openness)  Infrastructure capacity (e.g. ports, urban transport)  Labour market reform (e.g. wage determination and working conditions)  International trade and investment agreements (e.g. Australia-China free trade agreement)  Taxation and welfare reform (e.g. balance of rewards and entitlements) (c) Andrew Tibbitt 2017 21
  • 22.
    Talking points 1. Usingdiagrams, show how productivity growth can lead to higher incomes 2. Explain the difference between demand-side and supply-side policies 3. Distinguish between market-based and interventionist supply-side policies 4. Discuss the proposition that sustained growth can only be achieved through supply-side measures 5. ‘Productivity is not everything, but in the long-run it is almost everything’. Discuss.
  • 23.
    End of slideshow (c) Andrew Tibbitt 2017 23