![Fig. 3. Titration of [NMIA] for bI5. 32
P-labeled RT reactions of NMIA-RNA on an 8% acrylamide gel.
Concentrations are for final [NMIA] during the acylation reaction. Note the decrease in full-length product as
[NMIA] increases and the increase in shorter fragments as [NMIA] increases.](data:image/gif;base64,R0lGODlhAQABAIAAAAAAAP///yH5BAEAAAAALAAAAAABAAEAAAIBRAA7)
Recommended
More Related Content
What's hot
What's hot (20)
Viewers also liked
Viewers also liked (20)
Similar to AR_Figures
Similar to AR_Figures (20)
AR_Figures
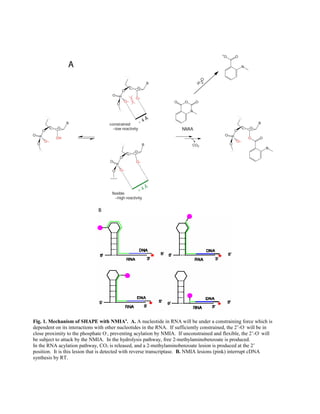
- 1. Fig. 1. Mechanism of SHAPE with NMIA6 . A. A nucleotide in RNA will be under a constraining force which is dependent on its interactions with other nucleotides in the RNA. If sufficiently constrained, the 2’-O- will be in close proximity to the phosphate O- , preventing acylation by NMIA. If unconstrained and flexible, the 2’-O- will be subject to attack by the NMIA. In the hydrolysis pathway, free 2-methylaminobenzoate is produced. In the RNA acylation pathway, CO2 is released, and a 2-methylaminobenzoate lesion is produced at the 2’ position. It is this lesion that is detected with reverse transcriptase. B. NMIA lesions (pink) interrupt cDNA synthesis by RT.
- 2. Fig. 3. Titration of [NMIA] for bI5. 32 P-labeled RT reactions of NMIA-RNA on an 8% acrylamide gel. Concentrations are for final [NMIA] during the acylation reaction. Note the decrease in full-length product as [NMIA] increases and the increase in shorter fragments as [NMIA] increases.
- 3. Fig. 2. The structure of the bI5 intron. Structure as determined in previous studies4 with corresponding trace data from Cy5-labeled sequencing experiment. Reactive regions can clearly be seen as elevations in the NMIA acylation profile (red) over background (blue). A sequencing lane indicates the position of guanines in the cDNA. This data has not been corrected for signal decay.
- 4. Fig. 4. Normalization scheme for drop in sequencing signal intensity. NMIA(+) trace is in red. Control trace is in blue. A. Current model of decay approximation for the bI5 intron. The differences between regression curves and their respective maximum value at beginning of trace are used as multiplicative factors to correct for falloff in signal. Signal is adjusted by multiplying raw signal by this difference at each point in the trace. B. Traces after application of normalization function.
- 5. Fig. 5. NMIA reactivity profile of the bI5 intron. Graphical representation of decay-corrected, NMIA reactivity values above background for the bI5 intron. Cy5 fluor was used. Layout is as in Fig. 2. Paired bases possess a lower reactivity profile than unpaired bases. Green bases in the P4-P6 region are paired non-canonically (A·A) or adjacent to a non-canonical pair. Tertiary interaction (P11*) is evident by suppressed reactivity in loop and bulge regions.
- 6. Fig. 8. 128-mer base unit for falloff probe. The basic stem-bulge-stem-loop design (SBSL) follows a basic pattern of 4 paired bases followed by 4 unpaired bases. This 4-4 pattern occurs four times per SBSL, and is repeated four times in the base unit for a final [((4+4)x4)x4] pattern as predicted by RNAstructure. This is the only structure predicted for this sequence.
- 7. Fig. 9. Full-length, synthetic 464-mer RNA for falloff study. Transcription of RNA begins after the T7 promoter after base 20 giving a final RNA of 444 nucleotides. Pairing between ends of RNA will be disrupted by T7 RNA polymerase.
- 8. Fig. 6. 100-mer SMN pre-mRNAs. Structures are of 100-nt fragments of SMN1 and SMN2 pre-mRNA ending with exon 7. The ESE splice mutation (+6) is circled in red. The splice point is indicated by the arrow. The unpaired-to-paired switch at the splice point is common in structures indicating macromolecular rearrangement.
- 9. Fig. 7. 60-mer SMN pre-mRNAs. Structures are of 60-nt fragments of SMN1 and SMN2 pre-mRNA ending with exon 7. The ESE splice mutation (+6) is circled in red. The splice point is indicated by the arrow. The six- base to four-base shrink in the loop is common in structures failing to show macromolecular rearrangement.
- 10. Fig. 7. 60-mer SMN pre-mRNAs. Structures are of 60-nt fragments of SMN1 and SMN2 pre-mRNA ending with exon 7. The ESE splice mutation (+6) is circled in red. The splice point is indicated by the arrow. The six- base to four-base shrink in the loop is common in structures failing to show macromolecular rearrangement.