AsedaSciences SLAS2017 poster presentation
•
0 likes•332 views

High-throughput, high-content cytometry screen predicts mitochondrial toxicity through machine learning-driven analysis of physiological responses.
Recommended

Recommended
More Related Content
What's hot
What's hot (20)
Similar to AsedaSciences SLAS2017 poster presentation
Similar to AsedaSciences SLAS2017 poster presentation (20)
Recently uploaded
Recently uploaded (20)
AsedaSciences SLAS2017 poster presentation
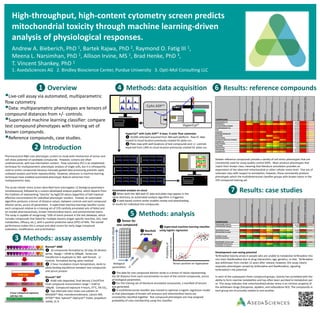
- 1. High-throughput, high-content cytometry screen predicts mitochondrial toxicity through machine learning-driven analysis of physiological responses. Andrew A. Bieberich, PhD 1, Bartek Rajwa, PhD 2, Raymond O. Fatig III 1, Meena L. Narsimhan, PhD 1, Allison Irvine, MS 1, Brad Henke, PhD 3, T. Vincent Shankey, PhD 1 1. AsedaSciences AG 2. Bindley Bioscience Center, Purdue University 3. Opti-Mol Consulting LLC ❶ Overview Live-cell assay via automated, multiparametric flow cytometry. Data: multiparametric phenotypes are tensors of compound distances from +/- controls. Supervised machine learning classifier: compare test compound phenotypes with training set of known compounds. Reference compounds, case studies. ❷ Introduction ❸ Methods: assay assembly Pharmaceutical R&D uses phenotypic screens to study both mechanism of action and cell stress potential of candidate compounds. However, screens are often unidimensional, with low information content. Flow cytometry (FC) is an established technique for multiparametric phenotypic analysis of single cells, but it is infrequently used to screen compounds because manually guided data processing prevents rapid, unbiased analysis and limits reproducibility. However, advances in machine learning techniques have enabled automated phenotypic feature extraction from multiparametric data. The acute cellular stress screen described here interrogates 12 biological parameters simultaneously, followed by a custom-developed analysis pipeline, which departs from the tradition of representing “toxicity” by logEC50 values (logarithm of half maximal effective concentration) for individual phenotypic markers. Instead, an automated algorithm produces a tensor of distance values, between controls and each compound dilution series, across all parameters. A supervised machine learning classifier scores each compound relative to a training set of 370 carefully annotated sets of failed and on-market pharmaceuticals, known mitochondrial toxins, and environmental toxins. The assay is capable of recognizing ~50% of toxins present in the test database, which includes compounds that failed for multiple reasons (organ-specific toxicities, DILI, toxic metabolites, efficacy, etc.), with a positive predictive value (PPV) of 94%. The overall performance makes this a unique and ideal screen for early-stage compound evaluation, modification, and prioritization. Biomek® 4000 ❶ 16 compounds formatted as 10-step 3X dilution series. Range = 10nM to 200µM. Series are transferred in duplicate to 384- well format. +/- controls formatted during same method. ❷ 2-hour incubation (room temperature, dark) to allow binding equilibrium between test compounds and serum protein. Biomek® NXP ❸ HL60 cells deposited, final density 2.5x10⁶/ml. Final compound concentration range = 5nM to 100µM. Compound exposure 4 hours, 37°C, 5% CO2. ❹ Two alternate stain mixes use subsets of: MitoSOX™ Red, monobromobimane, calcein AM, SYTOX™ Red, Vybrant® DyeCycle™ Violet, propidium iodide, JC-9. HL60 cells 4 hour compound exposure, add dye mix. ❹ Methods: data acquisition ❻ Results: reference compounds COMPOUND Morphology CytoplasmicMembraneIntegrity ReactiveOxygenSpecies Glutathione NuclearMembraneIntegrity(1) CellCycle NuclearMembraneIntegrity(2) MitochondrialMembranePotential SYSTEMETRIC®Probability SYSTEMETRIC®ProbabilityHeatMap Class_known AMIODARONE HCL 0.78 0.47 0.12 0.57 0.12 0.92 0.58 0.74 90.00% yes ANTIMYCIN A 0.91 0.24 0.75 0.38 0.23 0.37 0.26 0.60 70.00% unk CHELERYTHRINE CHLORIDE 1.00 0.99 1.00 0.99 0.99 0.85 0.98 1.00 100.00% yes CHLORPROMAZINE HCL 1.00 1.00 1.00 0.99 0.98 0.81 0.96 0.94 100.00% yes FCCP 0.99 0.96 0.97 0.92 0.96 0.76 0.68 0.98 100.00% yes GOSSYPOL 0.63 0.46 0.64 0.49 0.98 0.42 0.47 0.94 90.00% unk LAPATINIB DITOSYLATE 1.00 1.00 0.73 0.87 0.87 0.92 0.90 1.00 100.00% unk MASITINIB 1.00 0.99 0.95 0.95 0.33 0.65 0.84 0.99 100.00% unk MYXOTHIAZOL 1.00 1.00 0.99 0.99 0.99 0.47 0.97 0.99 100.00% yes NELFINAVIR MESYLATE HYDRATE 0.61 0.27 0.62 0.19 0.52 0.73 0.44 0.85 80.00% unk OLIGOMYCIN 0.85 0.95 0.86 0.86 0.85 0.30 0.82 0.96 100.00% yes PIOGLITAZONE 0.13 0.08 0.08 0.48 0.19 0.37 0.09 0.06 10.00% no ROTENONE 0.84 0.60 0.81 0.56 0.22 0.28 0.52 0.98 90.00% yes SIMVASTATIN 0.04 0.06 0.07 0.15 0.06 0.07 0.06 0.06 0.00% no TERFENADINE 1.00 1.00 1.00 1.00 0.98 0.98 0.98 0.99 100.00% yes VALINOMYCIN 0.90 0.30 0.75 0.67 0.35 0.29 0.39 0.85 80.00% yes CyAn ADP™ HyperCyt® HyperCyt® with CyAn ADP™ 3-laser, 9-color flow cytometer ❶ 10,000 cells/well acquired from 384-well platform. Raw FC data moved to cloud location previously created for plate run. ❷ Plate map with well locations of test compounds and +/- controls exported from LIMS to cloud location previously created for plate run. Automated analysis on cloud ❸ When both the 384-well FC data and plate map appear in the same directory, an automated analysis algorithm is triggered. ❹ A web-based control center enables review and downloading of results for individual test compounds. ❺ Methods: analysis Concentration5nM-100µM Biological parameters ❶ Tensor for one compound ❷ Manifold of tensors Probabilityof causingcellstress Tensor position on hyperplane ❸ Supervised machine learning classifier using logistic regression ❶ The data for one compound dilution series is a tensor of values representing the QF distance from each concentration to each of the control compounds, across all biological parameters. ❷ For the training set of literature annotated compounds, a manifold of tensors was generated. ❸ A multidimensional classifier was trained to optimize a logistic regression model so that phenotypes of known cell stressors and mitochondrial toxins are consistently classified together. Test compound phenotypes are now assigned probability of class membership using this classifier. Sixteen reference compounds provide a variety of cell stress phenotypes that are consistently used for assay quality control SOPs. Most produce phenotypes that match their known class, meaning that literature annotation provides an expectation of the observed mitochondrial or other cellular stress level. Five are of unknown class with respect to annotation; however, these consistently produce phenotypes which the multidimensional classifier groups with known toxins in the 370 compound training set. ❼ Results: case studies COMPOUND Morphology CytoplasmicMembraneIntegrity ReactiveOxygenSpecies Glutathione NuclearMembraneIntegrity(1) CellCycle NuclearMembraneIntegrity(2) MitochondrialMembranePotential SYSTEMETRIC®Probability SYSTEMETRIC®ProbabilityHeatMap Class_known TERFENADINE (Seldane) 1.00 1.00 1.00 1.00 0.98 0.98 0.98 0.99 100.00% yes, heart FEXOFENADINE (Allegra) 0.02 0.01 0.07 0.04 0.12 0.04 0.01 0.03 0.00% no TOLCAPONE (Tasmar) 0.97 0.60 0.98 0.54 0.30 0.92 0.34 0.29 90.00% yes, liver ENTACAPONE (Comtan) 0.08 0.52 0.01 0.56 0.43 0.04 0.07 0.04 0.00% no ALPIDEM (Anaxyl) 0.82 0.10 0.86 0.55 0.63 0.56 0.09 0.19 70.00% yes, liver ZOLPIDEM (Ambien) 0.04 0.03 0.04 0.27 0.02 0.34 0.01 0.04 0.00% no NEFAZODONE.HCl (Serzone) 0.99 1.00 1.00 0.98 0.85 0.92 0.91 1.00 100.00% yes, liver TRAZODONE.HCl (Desyrel) 0.00 0.02 0.01 0.05 0.17 0.01 0.07 0.07 0.00% no BUSPIRONE.HCl (BuSpar) 0.01 0.04 0.01 0.03 0.01 0.05 0.03 0.05 0.00% no Development cost saving potential Terfenadine toxicity arises in people who are unable to metabolize terfenadine into non-toxic fexofenadine due to drug interactions, age, genetics, or diet. Terfenadine was withdrawn from market 12 years after release; however, this assay clearly separates phenotypes caused by terfenadine and fexofenadine, signaling terfenadine’s risk potential. In each of the subsequent three compound groups, toxicity has correlated with the ability to form reactive metabolites and has often been ascribed to metabolism per se. This assay indicates that mitochondrial/cellular stress is an intrinsic property of the withdrawn drugs (tolcapone, alpidem, and nefazodone HCl). The compounds in each group are structurally related to one another.