SlideShare a Scribd company logo
1 of 23
Typical Data Organization for Analytics
OLTP
DB
Files
Queries
Results
OLAP database
with columnar storage
for fast and flexible querying
(a.k.a. Analytical Store).
Rise and Fall of the OLAP Cubes:
https://www.holistics.io/blog/the-rise-and-fall-of-the-olap-cube/
Interactive Dashboards
(Power BI, Tableau, etc.),
Reporting
SQL Data Warehouse
ETL
Kimball DW Framework
Kimball Group – closed in 2015
https://www.kimballgroup.com/
Inmon DW Framework
William H. Inmon
(1945 – present)
Ralph Kimball
(1944 – present)
The Times of Inmon & Kimball
Imagine computers of 1970s.
• A computer occupy the whole floor of a building
• Computer have memory measured in 10s of Kilobytes
• Punch cards slowly transition to magnetic tapes
• IBM introduced VSAM files, relations, SQL
• Usually just one computer in whole organization (IBM
Mainframe or similar)
• "Dumb terminals" connecting to the central computer.
There are no personal computers
• All company's information is typically stored in one central
computer
• In 1985 a "BIG" database would have 100 MBytes disk
storage and 10-15 KB/sec data transfer speed
These are times when Inmon & Kimball were crafting their
approaches.
As computers have become cheaper and more powerful,
organization were able to buy several computers – one per
department. Then people had to decide how to structure flows
of information.
• Inmon: from central main computer down to departments
• Kimball: from departments to central
Now 30-40 years later any smart phone is more powerful than
"huge" DW systems of Inmon & Kimball's era.
https://www.dataversity.net/a-short-history-of-data-warehousing/
OLAP Cube – Rise and Fall
Old way of doing things:
Data >> Raw DB >> DW >> OLAP Cube >> Reporting
The above "old way" Includes a lot of ETL, Data modeling & Design:
• Kimball Framework
• Inmon Framework
• Data Vault by Dan Linstedt (combines Kimball & Inmon).
But imagine that memory and compute power have become so cheap
that your regular SQL database can run any queries very fast
using in-memory columnar storage
and MPP = Massive Parallel Processing.
Then you don't need to hire data modelers.
You don't need all the OLAP infrastructure.
You can simply query your data as it is.
Data >> Reporting The Rise and Fall of the OLAP Cube - by Cedric Chin (2020)
- https://www.holistics.io/blog/the-rise-and-fall-of-the-olap-cube/
OLAP Past, Present, and Future
- https://senturus.com/blog/olap-past-present-future/
Kimball "Star Schema"
Dimensional data Modeling
Ralph Kimball’s paradigm:
• Each department in a company has its own Data Mart (DM).
The company's DW (Data Warehouse) is the conglomerate of
all DMs.
• Information is always stored in the dimensional model.
Bill Inmon’s paradigm:
• A company has one central DW (Data Warehous).
Data Marts (DMs) source their data from the DW.
• In the DW, information is stored in 3rd normal form.
( https://en.wikipedia.org/wiki/Third_normal_form )
Inmon vs Kimball
Kimball vs Inmon
Parameters Kimball Inmon
Introduced by Introduced by Ralph Kimball. Introduced by Bill Inmon.
Approach
It has Bottom-Up Approach for
implementation.
It has Top-Down Approach for
implementation.
Data Integration It focuses Individual business areas.
It focuses Enterprise-wide
areas.
Building Time It is efficient and takes less time.
It is complex and consumes a
lot of time.
Cost
It has iterative steps and is cost
effective.
Initial cost is huge and
development cost is low.
Skills Required
It does not need such skills but a
generic team will do job.
It needs specialized skills to
make work.
Maintenance Here maintenance is difficult. Here maintenance is easy.
Data Model
It prefers data to be in De-
normalized model.
It prefers data to be in
normalized model.
Data Store
Systems
In this, source systems are highly
stable.
In this, source systems have
high rate of change.
This is no longer needed
MOLAP, MDX, DAX
SSAS (Microsoft SQL Server Analysis Services).
• 1999 - MOLAP - multidimensional engine and MDX (pre-aggregated data)
• 2009 - tabular VertiPaq engine and DAX (vertically packed in-memory data)
MDX (MultiDimensional eXpressions) – by Mosha Pasumansky
• https://en.wikipedia.org/wiki/Mosha_Pasumansky
• https://www.linkedin.com/in/mosha/
• https://www.youtube.com/watch?v=mX51gMNsT5M (Mosha sings)
DAX (Data Analysis eXpressions)
by Amir Netz , Cristian Petculescu, and Microsoft team,
self-service, measure-based, visual, interactive, slice/dice.
• https://en.wikipedia.org/wiki/Data_analysis_expressions
• https://www.kasperonbi.com/the-rise-and-history-of-power-bi-with-amir-netz/
• https://www.youtube.com/watch?v=izOppfQGanI
• https://news.microsoft.com/stories/people/amir-netz.html
Mosha Pasumansky,
Microsoft 2005-2011,
Google 2011-Present
Amir Netz
Microsoft since 1997
Cristian Petculescu
Microsoft since 1997
Rise and Fall of the OLAP Cubes:
https://www.holistics.io/blog/the-rise-and-fall-of-the-olap-cube/
Synapse
Integrate
Data
Pipelines
Azure Data Lake
(Files & Blobs)
Machine
Learning
Web
End-Points
Serverless
and Dedicated
SQL Pools
Distributed Parallel Data
Processing, Machine Learning
SQL
Pre-aggregated Data
Streaming Data
The Modern Data Warehouse
Solution Pattern
• Move from on-prem to cloud
• Include all tools: data moving, storing,
processing, analysis, and serving
• All tools are interconnected and work
together (Synapse)
Modern Cloud-Based Data Warehouse
• Multi-component architecture allows for fast and flexible
configuration to fit desired results
• Data moving and preparation is fast and scalable
• Speedy and efficient time-to-analytics
• More manageable and customizable cost of ownership
• Analytics-driven rise in productivity across the organization
• Access is always available
• Scalable from small to large amounts of data
Traditional On-Prem Data Warehouse
• Expensive/high-maintenance on-premise server setup
• Rigid structure relying mostly on scheduled ETL processes
• Limited speed potential
• Expensive upgrades (hardware)
• Limited scalability
• Overall slower limited analytical processing
Much Better !
Should we still use a Kimball approach
on a modern data warehouse?
Answer in most cases – yes.
Not for performance reason, but for better data maintenance.
Kimball's star schema always had three advantages:
• takes less storage space – no longer relevant
• performance – no longer relevant
• data maintenance (loads, updates, restructuring)
Wide denormalized tables can have good performance,
but updating a "dimension" field in a denormalized table may
require updating millions of records.
Also if we loading data from several different systems, a Kimball
approach helps to identify and standardize common dimensions.
Also when implementing dashboards, fact table and dimension
tables make queries easier to do.
Good discussions:
https://discourse.getdbt.com/t/is-kimball-dimensional-modeling-still-
relevant-in-a-modern-data-warehouse/225
https://www.linkedin.com/pulse/kimball-still-relevant-modern-data-
warehouse-simon-whiteley/
Kimball's "Star Schema"
facts table in the middle
surrounded by dimensions tables
Who Invented Azure DW MPP Technology?
MPP = Massively Parallel Processing
In 2008 Microsoft acquired DATAllegro.
DATAllegro was a company that specialized in data warehousing appliances.
Similar to IBM Netezza, but running on top of commodity Dell Linux servers.
It was founded in 2003 by Stuart Frost.
SQL Server Parallel Data Warehouse was built using this technology and a
version of the SQL Server database engine.
• https://en.wikipedia.org/wiki/DATAllegro
• https://www.linkedin.com/in/stu-frost/
• https://www.crunchbase.com/person/stuart-frost
• https://geminos.ai/
Stuart Frost
Feeding data from transactional Database
(Cosmos DB) into Analytical Store
Region1
Region3
Region2
Region1
Link (Sync)
Transactions
replicated
between
regions
Analytical store(s) can
be set up in any region
See also:
Change feed in Azure Cosmos DB
https://docs.microsoft.com/en-us/azure/cosmos-db/change-feed
Transactional Store,
massive inserts,
key-value
(JSON doc)
Analytical
Columnar Store
Operational Data
Configuring Synapse Link for Cosmos DB
means enabling Analytical Store in Cosmos
DB and enabling automatic sync of data
into it. So you can use SQL to query data
from Analytical Store without slowing down
the Transactional Store.
Cosmos DB
Link for Cosmos DB
Link for Cosmos DB
Cosmos DB
SQL Query
Auto-Sync Power BI
ML Studio
Azure Synapse
Analytics
Azure Data
Lake Storage
(Files)
Question:
How Link manages to do real-time replication?
It is interesting because inserts into analytical DBs are usually very slow.
Answer: (from a Microsoft architect):
In a nutshell this is achieved using the combination of micro-batch jobs and mass
parallel ingestion. As you know, Synapse doesn't perform well under transactional
load due to variety of factors, but using Polybase removes these limitations.
Think about repointing Polybase to some other source (other than ADLS for
example). Some ideas around the actual implementation you can figure out using
the Polaris public paper (2020, 50 authors, 13 pages) :
- http://www.vldb.org/pvldb/vol13/p3204-saborit.pdf
Here is the video walking through this Polaris paper explaining how the Azure
Synapse serveless SQL engine works:
- https://www.youtube.com/watch?v=IqjVZexHCcE
Link for Cosmos DB – how it works
Note – Synapse servers and POLARIS run
on Linux OS and use .NET / C#
Databases can be optimized
for OLTP (On-Line Transactional Processing)
or OLAP (On-Line Analytical Processing).
For analytics we need OLAP databases. They achieve high performance of
queries by using columnar indexes, massive parallelism, taking advantage of
large memory and GPU.
Columnar Indexes:
Here is a short video (4 min) made long time ago (in 2011) showing
performance advantage of columnar store indexes in Microsoft SQL server.
- https://www.youtube.com/watch?v=vPN8_PCsJm4
The video demonstrates that columnar indexing is at least 40 times faster than
traditional index. The query was done over a 2 Billion rows "fact" table.
Note - this video is ~8 years old. Since then MS SQL Server made lots of other
performance improvements.
Note: first release of MS SQL Server was on April 24, 1989, 30+ years!!
Modern hardware is much faster than that used in the above video.
Columnar store indexing is standard/default nowadays.
And of course it is available on Microsoft SQL Server on Azure cloud.
Microsoft SQL Datawarehouse on Azure cloud - fast OLAP solution.
- https://azure.microsoft.com/en-us/services/sql-data-warehouse/
SSAS = Microsoft SQL Server Analysis Services – uses tabular models
( in-memory compressed databases) for serving fast queries to BI tools:
- https://en.wikipedia.org/wiki/Microsoft_Analysis_Services
Power BI - Standard Microsoft Business Intelligence tool
- https://powerbi.microsoft.com
Demo of how fast Power BI Premium works with MS SQL Server - 500+ Mln rows
of data
- https://www.youtube.com/watch?v=mQyFp2MSl-s
Demo of Kinetica DB using Tableau & Power BI:
- https://www.youtube.com/watch?v=7XliLU7ZC_s
Notice:
- sub-second response on billions of rows of data
- not need to create indexes, no wait time, fast load (even live streaming) of data
Main points:
- you can select from many different BI tools - they all support SQL
- you can select from many SQL databases - they are fast
- you can simplify your development time using standard SQL features
- you can select dedicated hardware to tune your speed
- you can achieve very fast response time
- you can enjoy lower prices
Databases optimized for analytics.
Columnar Index = Columnstore Indexes
A column-oriented DBMS (or columnar database management system) stores data tables by
column rather than by row. Mostly used for analytical queries on large tables. Query
performance can be 10-40 times faster than in traditional row-accessing DBMS.
But inserts are slower (need to add and compress) - not suited for OLTP transactional
databases.
Column data is of uniform type – therefore it can be compressed better than row-oriented data
(using bitmap indexes and sorting).
Traditional Row-storing DB Columnar storing DB
Excessive disk IO – read whole rows, discards
most columns
Disk IO smaller because we need to read only
few columns. This allows to fit more rows into
memory, thus making the query much faster
(all-in-memory).
Compression is not very good. Good data compression using the fact that all
data in one column has the same type.
Good random access. Good for analytics, not so good for random
access.
Can use clustered and nonclustered indexes. Columnstore index is usually clustered. But also
can use separate nonclustered indexes for some
columns.
Good for transactions (OLTP) Good for read-only analytical queries in big fact
tables (OLAP)
How Analytical SQL Databases
Have Evolved
Row-based Column-based
In-Memory
GPU Based
like Kinetica
MPP Parallel
DW
POLARIS
(thousands data
cells & compute
nodes)
Hadoop
Spark
Databricks Other Databases:
• noSQL
• Graph
Analytics Dashboards
There are many tools on the market to help visualize data in graphs and dashboards.
An interactive dashboard is a combination of graphs, text fields, and controls
allowing user to select the data, filter data (for example, by date range or
by geography or by user), aggregate, compare. etc.
The data queries are usually formulated in SQL.
Most common dashboards are:
 Microsoft Power BI - https://powerbi.microsoft.com/en-us/
 Tableau - https://www.tableau.com/
 Qlik - https://www.qlik.com/us/
 Google DataStudio - https://datastudio.google.com/
 Chartio - https://chartio.com/
 Jupyter dashboards - https://voila.readthedocs.io/en/stable/
 Apache Superset - https://superset.incubator.apache.org/ ( also https://preset.io/ )
Here is a demo of how fast Microsoft Power BI Premium works with MS SQL Server - 500+ Mln rows of
data - https://www.youtube.com/watch?v=mQyFp2MSl-s
And here is a demo of Kinetica DB using Tableau & Power BI:
- https://www.youtube.com/watch?v=7XliLU7ZC_s
Notice:
- sub-second response on billions of rows of data
- no need in waiting to create indexes, fast load (even live streaming) of data (modern databases use
columnstore indexes - and are highly parallelized)
- https://docs.microsoft.com/en-us/sql/relational-databases/indexes/columnstore-indexes-overview?view=sql-server-2017
The top leaders for analytics platforms are Microsoft and Tableau.
Both use standard SQL to get data.
https://www.gartner.com/doc/reprints?id=1-65P04FG&ct=190125
Which database to use?
There are many options for SQL database.
For example, on Azure Cloud - Azure SQL Data Warehouse
- https://azure.microsoft.com/en-us/services/sql-data-warehouse/
BI & Power BI - https://powerbi.microsoft.com/en-us/
On Google Cloud we can use "Cloud SQL" (managed PostgreSQL) or BigQuery.
We can also consider GPU-based databases, for example:
- Kinetica on Google Cloud
- https://www.kinetica.com/partner/google-cloud-platform/
- MapD = OmniSci
- https://www.omnisci.com/
Similar options are available on AWS: Amazon RDS (PostgreSQL), Redshift, SnowFlake,
Aurora, kinetica, MapD, etc.
Generally for sizes more than 1TB it is preferable to have a distributed DB like Google
BigQuery (or Amazon SnowFlake.net)
https://statsbot.co/blog/modern-data-warehouse
Speed depends on the size of the data too.
At small sizes (<1TB) single-node solutions are faster (GPU-based are fastest).
So it maybe either one reasonably fast DB (Azure SQL Datawarehouse), or two
databases - on big - but slow (Google BigQuery), and second smaller - but very fast
(omnisci MapD GPU DB for interactive visual querying)
- https://fivetran.com/blog/warehouse-benchmark
- https://www.omnisci.com/demos/
Open Source for building dashboards
Apache Druid - http://druid.io - open-source analytics data store (OLAP). Fast data
ingestion and aggregation, scales to trillions of events and petabytes of data. Druid is
best used to power analytic dashboards and applications.
Apache Calcite - https://calcite.apache.org/ - translate SQL to JSON queries for Druid
and other systems
Visualization - why so many packages?
- https://www.anaconda.com/python-data-visualization-2018-why-so-many-libraries/
Visualization for R - Shiny (R-Studio) - https://shiny.rstudio.com/
Jupyter Dashboards:
● Jupyter notebooks and dashboards
- https://annefou.github.io/jupyter_dashboards/02-dashboards/index.html
● Jupyter Lab - https://jupyterlab.readthedocs.io/en/stable/
● Jupyter Dashboards - https://github.com/jupyter/dashboards
● Voila - serve dashboards - https://github.com/voila-dashboards/voila - now part of jupyter
================================
● ipywidgets - https://github.com/jupyter-widgets/ipywidgets
- https://www.youtube.com/watch?v=i40d8-Hu4vM (40 min demo from 2017)
● bqplot - https://github.com/bloomberg/bqplot
- https://www.youtube.com/watch?v=Dmxa2Kyfzxk (demo 2018)
● Bokeh - interactive graphics - https://docs.bokeh.org/en/latest/docs/user_guide.html
● ipyvolume - 3-D visualization (rotate & resize 3D graphs) in Jupyter
- https://github.com/maartenbreddels/ipyvolume
Apache Superset, open-source, similar to Tableau or Chartio ( https://chartio.com/ ).
The dashboard definition is in JSON file, the data is queried using SQL from a database.
- https://superset.incubator.apache.org/installation.html#getting-started
- https://www.youtube.com/watch?v=AqousXQ7YHw – 15 min demo
- https://youtu.be/24XDOkGJrEY - very good lecture (history and anatomy of Apache Superset).
Looks like it has good documentation on how to install it on Linux, Mac, or Windows.
And how to work with various SQL databases. Superset's stack is: Python backend (Flask App Builder
(authentication, roles, CRUD,...), pandas, SqlAlchemy) + Javascript frontend Here are some examples
from nvd3.org - http://nvd3.org/examples/index.html
Try clicking on charts - enjoy animation effects - http://nvd3.org/examples/stackedArea.html
Superset works very well with Druid - https://druid.apache.org/ -
Watch this lecture - https://www.youtube.com/watch?v=vbH8E0nH2Nw - lecture about technologies
to be used behind Interactive dashboards. He goes over OLAP, SQL, star-schema, key-value stores, and
columnar stores. Then describes in detail why Druid is an excellent solution.
Apache
Druid
columnar
storage
Apache
Airflow
workflow
management
Apache
Superset
Dashboards
A Gallery of Voilà Examples
https://blog.jupyter.org/a-gallery-of-voil%C3%A0-examples-a2ce7ef99130
Voila, widgets, extrapolations
https://jupyter-flex.extrapolations.dev/voila-ipywidgets/ -
Configure your dashboards with Voilà gridstack template
https://blog.jupyter.org/voila-gridstack-template-8a431c2b353e -
Jupyter Dashboards – open source and flexibility
1956 – loading 5 MB disk into a plane
History
IBM – Punch-Cards in 1950s
History - Unix
Ken Thompson (seated) and Dennis Ritchie (standing)
at a PDP-11 in 1972.
https://homepage.cs.uri.edu/~thenry/resources/unix_art/ch02s01.html
PDP-7 minicomputer (1969) on which Ken
Thompson created the Space Travel game
and Unix OS

More Related Content

Similar to DA_04_SQL_Modern_DW.pptx

Sql Server 2005 Business Inteligence
Sql Server 2005 Business InteligenceSql Server 2005 Business Inteligence
Sql Server 2005 Business Inteligenceabercius24
 
Storage Systems For Scalable systems
Storage Systems For Scalable systemsStorage Systems For Scalable systems
Storage Systems For Scalable systemselliando dias
 
Oracle Database 12c - Features for Big Data
Oracle Database 12c - Features for Big DataOracle Database 12c - Features for Big Data
Oracle Database 12c - Features for Big DataAbishek V S
 
ScaleBase Webinar: Scaling MySQL - Sharding Made Easy!
ScaleBase Webinar: Scaling MySQL - Sharding Made Easy!ScaleBase Webinar: Scaling MySQL - Sharding Made Easy!
ScaleBase Webinar: Scaling MySQL - Sharding Made Easy!ScaleBase
 
Microsoft Openness Mongo DB
Microsoft Openness Mongo DBMicrosoft Openness Mongo DB
Microsoft Openness Mongo DBHeriyadi Janwar
 
Sql Server tips from the field
Sql Server tips from the fieldSql Server tips from the field
Sql Server tips from the fieldInnoTech
 
Bigdata antipatterns
Bigdata antipatternsBigdata antipatterns
Bigdata antipatternsAnurag S
 
Database as a Service on the Oracle Database Appliance Platform
Database as a Service on the Oracle Database Appliance PlatformDatabase as a Service on the Oracle Database Appliance Platform
Database as a Service on the Oracle Database Appliance PlatformMaris Elsins
 
Enterprise Data World 2018 - Building Cloud Self-Service Analytical Solution
Enterprise Data World 2018 - Building Cloud Self-Service Analytical SolutionEnterprise Data World 2018 - Building Cloud Self-Service Analytical Solution
Enterprise Data World 2018 - Building Cloud Self-Service Analytical SolutionDmitry Anoshin
 
VMworld 2013: Virtualizing Databases: Doing IT Right
VMworld 2013: Virtualizing Databases: Doing IT Right VMworld 2013: Virtualizing Databases: Doing IT Right
VMworld 2013: Virtualizing Databases: Doing IT Right VMworld
 
Handling Massive Writes
Handling Massive WritesHandling Massive Writes
Handling Massive WritesLiran Zelkha
 
Webinar: The Future of SQL
Webinar: The Future of SQLWebinar: The Future of SQL
Webinar: The Future of SQLCrate.io
 
Making MySQL Great For Business Intelligence
Making MySQL Great For Business IntelligenceMaking MySQL Great For Business Intelligence
Making MySQL Great For Business IntelligenceCalpont
 
Cloud introduction2.ppt
Cloud introduction2.pptCloud introduction2.ppt
Cloud introduction2.pptBala Anand
 
SQL/NoSQL How to choose ?
SQL/NoSQL How to choose ?SQL/NoSQL How to choose ?
SQL/NoSQL How to choose ?Venu Anuganti
 
Amazon Redshift in Action: Enterprise, Big Data, and SaaS Use Cases (DAT205) ...
Amazon Redshift in Action: Enterprise, Big Data, and SaaS Use Cases (DAT205) ...Amazon Redshift in Action: Enterprise, Big Data, and SaaS Use Cases (DAT205) ...
Amazon Redshift in Action: Enterprise, Big Data, and SaaS Use Cases (DAT205) ...Amazon Web Services
 
Designing, Building, and Maintaining Large Cubes using Lessons Learned
Designing, Building, and Maintaining Large Cubes using Lessons LearnedDesigning, Building, and Maintaining Large Cubes using Lessons Learned
Designing, Building, and Maintaining Large Cubes using Lessons LearnedDenny Lee
 
SQL or NoSQL, that is the question!
SQL or NoSQL, that is the question!SQL or NoSQL, that is the question!
SQL or NoSQL, that is the question!Andraz Tori
 

Similar to DA_04_SQL_Modern_DW.pptx (20)

Sql Server 2005 Business Inteligence
Sql Server 2005 Business InteligenceSql Server 2005 Business Inteligence
Sql Server 2005 Business Inteligence
 
Lecture3.ppt
Lecture3.pptLecture3.ppt
Lecture3.ppt
 
Storage Systems For Scalable systems
Storage Systems For Scalable systemsStorage Systems For Scalable systems
Storage Systems For Scalable systems
 
Oracle Database 12c - Features for Big Data
Oracle Database 12c - Features for Big DataOracle Database 12c - Features for Big Data
Oracle Database 12c - Features for Big Data
 
ScaleBase Webinar: Scaling MySQL - Sharding Made Easy!
ScaleBase Webinar: Scaling MySQL - Sharding Made Easy!ScaleBase Webinar: Scaling MySQL - Sharding Made Easy!
ScaleBase Webinar: Scaling MySQL - Sharding Made Easy!
 
Microsoft Openness Mongo DB
Microsoft Openness Mongo DBMicrosoft Openness Mongo DB
Microsoft Openness Mongo DB
 
Big Data Building Blocks with AWS Cloud
Big Data Building Blocks with AWS CloudBig Data Building Blocks with AWS Cloud
Big Data Building Blocks with AWS Cloud
 
Sql Server tips from the field
Sql Server tips from the fieldSql Server tips from the field
Sql Server tips from the field
 
Bigdata antipatterns
Bigdata antipatternsBigdata antipatterns
Bigdata antipatterns
 
Database as a Service on the Oracle Database Appliance Platform
Database as a Service on the Oracle Database Appliance PlatformDatabase as a Service on the Oracle Database Appliance Platform
Database as a Service on the Oracle Database Appliance Platform
 
Enterprise Data World 2018 - Building Cloud Self-Service Analytical Solution
Enterprise Data World 2018 - Building Cloud Self-Service Analytical SolutionEnterprise Data World 2018 - Building Cloud Self-Service Analytical Solution
Enterprise Data World 2018 - Building Cloud Self-Service Analytical Solution
 
VMworld 2013: Virtualizing Databases: Doing IT Right
VMworld 2013: Virtualizing Databases: Doing IT Right VMworld 2013: Virtualizing Databases: Doing IT Right
VMworld 2013: Virtualizing Databases: Doing IT Right
 
Handling Massive Writes
Handling Massive WritesHandling Massive Writes
Handling Massive Writes
 
Webinar: The Future of SQL
Webinar: The Future of SQLWebinar: The Future of SQL
Webinar: The Future of SQL
 
Making MySQL Great For Business Intelligence
Making MySQL Great For Business IntelligenceMaking MySQL Great For Business Intelligence
Making MySQL Great For Business Intelligence
 
Cloud introduction2.ppt
Cloud introduction2.pptCloud introduction2.ppt
Cloud introduction2.ppt
 
SQL/NoSQL How to choose ?
SQL/NoSQL How to choose ?SQL/NoSQL How to choose ?
SQL/NoSQL How to choose ?
 
Amazon Redshift in Action: Enterprise, Big Data, and SaaS Use Cases (DAT205) ...
Amazon Redshift in Action: Enterprise, Big Data, and SaaS Use Cases (DAT205) ...Amazon Redshift in Action: Enterprise, Big Data, and SaaS Use Cases (DAT205) ...
Amazon Redshift in Action: Enterprise, Big Data, and SaaS Use Cases (DAT205) ...
 
Designing, Building, and Maintaining Large Cubes using Lessons Learned
Designing, Building, and Maintaining Large Cubes using Lessons LearnedDesigning, Building, and Maintaining Large Cubes using Lessons Learned
Designing, Building, and Maintaining Large Cubes using Lessons Learned
 
SQL or NoSQL, that is the question!
SQL or NoSQL, that is the question!SQL or NoSQL, that is the question!
SQL or NoSQL, that is the question!
 

Recently uploaded

Week-01-2.ppt BBB human Computer interaction
Week-01-2.ppt BBB human Computer interactionWeek-01-2.ppt BBB human Computer interaction
Week-01-2.ppt BBB human Computer interactionfulawalesam
 
Cheap Rate Call girls Sarita Vihar Delhi 9205541914 shot 1500 night
Cheap Rate Call girls Sarita Vihar Delhi 9205541914 shot 1500 nightCheap Rate Call girls Sarita Vihar Delhi 9205541914 shot 1500 night
Cheap Rate Call girls Sarita Vihar Delhi 9205541914 shot 1500 nightDelhi Call girls
 
Delhi Call Girls CP 9711199171 ☎✔👌✔ Whatsapp Hard And Sexy Vip Call
Delhi Call Girls CP 9711199171 ☎✔👌✔ Whatsapp Hard And Sexy Vip CallDelhi Call Girls CP 9711199171 ☎✔👌✔ Whatsapp Hard And Sexy Vip Call
Delhi Call Girls CP 9711199171 ☎✔👌✔ Whatsapp Hard And Sexy Vip Callshivangimorya083
 
Data-Analysis for Chicago Crime Data 2023
Data-Analysis for Chicago Crime Data  2023Data-Analysis for Chicago Crime Data  2023
Data-Analysis for Chicago Crime Data 2023ymrp368
 
Vip Model Call Girls (Delhi) Karol Bagh 9711199171✔️Body to body massage wit...
Vip Model  Call Girls (Delhi) Karol Bagh 9711199171✔️Body to body massage wit...Vip Model  Call Girls (Delhi) Karol Bagh 9711199171✔️Body to body massage wit...
Vip Model Call Girls (Delhi) Karol Bagh 9711199171✔️Body to body massage wit...shivangimorya083
 
Call Girls in Sarai Kale Khan Delhi 💯 Call Us 🔝9205541914 🔝( Delhi) Escorts S...
Call Girls in Sarai Kale Khan Delhi 💯 Call Us 🔝9205541914 🔝( Delhi) Escorts S...Call Girls in Sarai Kale Khan Delhi 💯 Call Us 🔝9205541914 🔝( Delhi) Escorts S...
Call Girls in Sarai Kale Khan Delhi 💯 Call Us 🔝9205541914 🔝( Delhi) Escorts S...Delhi Call girls
 
Market Analysis in the 5 Largest Economic Countries in Southeast Asia.pdf
Market Analysis in the 5 Largest Economic Countries in Southeast Asia.pdfMarket Analysis in the 5 Largest Economic Countries in Southeast Asia.pdf
Market Analysis in the 5 Largest Economic Countries in Southeast Asia.pdfRachmat Ramadhan H
 
Smarteg dropshipping via API with DroFx.pptx
Smarteg dropshipping via API with DroFx.pptxSmarteg dropshipping via API with DroFx.pptx
Smarteg dropshipping via API with DroFx.pptxolyaivanovalion
 
BPAC WITH UFSBI GENERAL PRESENTATION 18_05_2017-1.pptx
BPAC WITH UFSBI GENERAL PRESENTATION 18_05_2017-1.pptxBPAC WITH UFSBI GENERAL PRESENTATION 18_05_2017-1.pptx
BPAC WITH UFSBI GENERAL PRESENTATION 18_05_2017-1.pptxMohammedJunaid861692
 
Invezz.com - Grow your wealth with trading signals
Invezz.com - Grow your wealth with trading signalsInvezz.com - Grow your wealth with trading signals
Invezz.com - Grow your wealth with trading signalsInvezz1
 
Generative AI on Enterprise Cloud with NiFi and Milvus
Generative AI on Enterprise Cloud with NiFi and MilvusGenerative AI on Enterprise Cloud with NiFi and Milvus
Generative AI on Enterprise Cloud with NiFi and MilvusTimothy Spann
 
Delhi Call Girls Punjabi Bagh 9711199171 ☎✔👌✔ Whatsapp Hard And Sexy Vip Call
Delhi Call Girls Punjabi Bagh 9711199171 ☎✔👌✔ Whatsapp Hard And Sexy Vip CallDelhi Call Girls Punjabi Bagh 9711199171 ☎✔👌✔ Whatsapp Hard And Sexy Vip Call
Delhi Call Girls Punjabi Bagh 9711199171 ☎✔👌✔ Whatsapp Hard And Sexy Vip Callshivangimorya083
 
VIP Model Call Girls Hinjewadi ( Pune ) Call ON 8005736733 Starting From 5K t...
VIP Model Call Girls Hinjewadi ( Pune ) Call ON 8005736733 Starting From 5K t...VIP Model Call Girls Hinjewadi ( Pune ) Call ON 8005736733 Starting From 5K t...
VIP Model Call Girls Hinjewadi ( Pune ) Call ON 8005736733 Starting From 5K t...SUHANI PANDEY
 
Zuja dropshipping via API with DroFx.pptx
Zuja dropshipping via API with DroFx.pptxZuja dropshipping via API with DroFx.pptx
Zuja dropshipping via API with DroFx.pptxolyaivanovalion
 
BigBuy dropshipping via API with DroFx.pptx
BigBuy dropshipping via API with DroFx.pptxBigBuy dropshipping via API with DroFx.pptx
BigBuy dropshipping via API with DroFx.pptxolyaivanovalion
 
Introduction-to-Machine-Learning (1).pptx
Introduction-to-Machine-Learning (1).pptxIntroduction-to-Machine-Learning (1).pptx
Introduction-to-Machine-Learning (1).pptxfirstjob4
 
Call Girls Bannerghatta Road Just Call 👗 7737669865 👗 Top Class Call Girl Ser...
Call Girls Bannerghatta Road Just Call 👗 7737669865 👗 Top Class Call Girl Ser...Call Girls Bannerghatta Road Just Call 👗 7737669865 👗 Top Class Call Girl Ser...
Call Girls Bannerghatta Road Just Call 👗 7737669865 👗 Top Class Call Girl Ser...amitlee9823
 
Log Analysis using OSSEC sasoasasasas.pptx
Log Analysis using OSSEC sasoasasasas.pptxLog Analysis using OSSEC sasoasasasas.pptx
Log Analysis using OSSEC sasoasasasas.pptxJohnnyPlasten
 
Best VIP Call Girls Noida Sector 39 Call Me: 8448380779
Best VIP Call Girls Noida Sector 39 Call Me: 8448380779Best VIP Call Girls Noida Sector 39 Call Me: 8448380779
Best VIP Call Girls Noida Sector 39 Call Me: 8448380779Delhi Call girls
 

Recently uploaded (20)

Week-01-2.ppt BBB human Computer interaction
Week-01-2.ppt BBB human Computer interactionWeek-01-2.ppt BBB human Computer interaction
Week-01-2.ppt BBB human Computer interaction
 
Cheap Rate Call girls Sarita Vihar Delhi 9205541914 shot 1500 night
Cheap Rate Call girls Sarita Vihar Delhi 9205541914 shot 1500 nightCheap Rate Call girls Sarita Vihar Delhi 9205541914 shot 1500 night
Cheap Rate Call girls Sarita Vihar Delhi 9205541914 shot 1500 night
 
Delhi Call Girls CP 9711199171 ☎✔👌✔ Whatsapp Hard And Sexy Vip Call
Delhi Call Girls CP 9711199171 ☎✔👌✔ Whatsapp Hard And Sexy Vip CallDelhi Call Girls CP 9711199171 ☎✔👌✔ Whatsapp Hard And Sexy Vip Call
Delhi Call Girls CP 9711199171 ☎✔👌✔ Whatsapp Hard And Sexy Vip Call
 
Data-Analysis for Chicago Crime Data 2023
Data-Analysis for Chicago Crime Data  2023Data-Analysis for Chicago Crime Data  2023
Data-Analysis for Chicago Crime Data 2023
 
Vip Model Call Girls (Delhi) Karol Bagh 9711199171✔️Body to body massage wit...
Vip Model  Call Girls (Delhi) Karol Bagh 9711199171✔️Body to body massage wit...Vip Model  Call Girls (Delhi) Karol Bagh 9711199171✔️Body to body massage wit...
Vip Model Call Girls (Delhi) Karol Bagh 9711199171✔️Body to body massage wit...
 
Call Girls in Sarai Kale Khan Delhi 💯 Call Us 🔝9205541914 🔝( Delhi) Escorts S...
Call Girls in Sarai Kale Khan Delhi 💯 Call Us 🔝9205541914 🔝( Delhi) Escorts S...Call Girls in Sarai Kale Khan Delhi 💯 Call Us 🔝9205541914 🔝( Delhi) Escorts S...
Call Girls in Sarai Kale Khan Delhi 💯 Call Us 🔝9205541914 🔝( Delhi) Escorts S...
 
Market Analysis in the 5 Largest Economic Countries in Southeast Asia.pdf
Market Analysis in the 5 Largest Economic Countries in Southeast Asia.pdfMarket Analysis in the 5 Largest Economic Countries in Southeast Asia.pdf
Market Analysis in the 5 Largest Economic Countries in Southeast Asia.pdf
 
Smarteg dropshipping via API with DroFx.pptx
Smarteg dropshipping via API with DroFx.pptxSmarteg dropshipping via API with DroFx.pptx
Smarteg dropshipping via API with DroFx.pptx
 
BPAC WITH UFSBI GENERAL PRESENTATION 18_05_2017-1.pptx
BPAC WITH UFSBI GENERAL PRESENTATION 18_05_2017-1.pptxBPAC WITH UFSBI GENERAL PRESENTATION 18_05_2017-1.pptx
BPAC WITH UFSBI GENERAL PRESENTATION 18_05_2017-1.pptx
 
Invezz.com - Grow your wealth with trading signals
Invezz.com - Grow your wealth with trading signalsInvezz.com - Grow your wealth with trading signals
Invezz.com - Grow your wealth with trading signals
 
Generative AI on Enterprise Cloud with NiFi and Milvus
Generative AI on Enterprise Cloud with NiFi and MilvusGenerative AI on Enterprise Cloud with NiFi and Milvus
Generative AI on Enterprise Cloud with NiFi and Milvus
 
Delhi Call Girls Punjabi Bagh 9711199171 ☎✔👌✔ Whatsapp Hard And Sexy Vip Call
Delhi Call Girls Punjabi Bagh 9711199171 ☎✔👌✔ Whatsapp Hard And Sexy Vip CallDelhi Call Girls Punjabi Bagh 9711199171 ☎✔👌✔ Whatsapp Hard And Sexy Vip Call
Delhi Call Girls Punjabi Bagh 9711199171 ☎✔👌✔ Whatsapp Hard And Sexy Vip Call
 
VIP Model Call Girls Hinjewadi ( Pune ) Call ON 8005736733 Starting From 5K t...
VIP Model Call Girls Hinjewadi ( Pune ) Call ON 8005736733 Starting From 5K t...VIP Model Call Girls Hinjewadi ( Pune ) Call ON 8005736733 Starting From 5K t...
VIP Model Call Girls Hinjewadi ( Pune ) Call ON 8005736733 Starting From 5K t...
 
Zuja dropshipping via API with DroFx.pptx
Zuja dropshipping via API with DroFx.pptxZuja dropshipping via API with DroFx.pptx
Zuja dropshipping via API with DroFx.pptx
 
BigBuy dropshipping via API with DroFx.pptx
BigBuy dropshipping via API with DroFx.pptxBigBuy dropshipping via API with DroFx.pptx
BigBuy dropshipping via API with DroFx.pptx
 
Introduction-to-Machine-Learning (1).pptx
Introduction-to-Machine-Learning (1).pptxIntroduction-to-Machine-Learning (1).pptx
Introduction-to-Machine-Learning (1).pptx
 
Sampling (random) method and Non random.ppt
Sampling (random) method and Non random.pptSampling (random) method and Non random.ppt
Sampling (random) method and Non random.ppt
 
Call Girls Bannerghatta Road Just Call 👗 7737669865 👗 Top Class Call Girl Ser...
Call Girls Bannerghatta Road Just Call 👗 7737669865 👗 Top Class Call Girl Ser...Call Girls Bannerghatta Road Just Call 👗 7737669865 👗 Top Class Call Girl Ser...
Call Girls Bannerghatta Road Just Call 👗 7737669865 👗 Top Class Call Girl Ser...
 
Log Analysis using OSSEC sasoasasasas.pptx
Log Analysis using OSSEC sasoasasasas.pptxLog Analysis using OSSEC sasoasasasas.pptx
Log Analysis using OSSEC sasoasasasas.pptx
 
Best VIP Call Girls Noida Sector 39 Call Me: 8448380779
Best VIP Call Girls Noida Sector 39 Call Me: 8448380779Best VIP Call Girls Noida Sector 39 Call Me: 8448380779
Best VIP Call Girls Noida Sector 39 Call Me: 8448380779
 

DA_04_SQL_Modern_DW.pptx

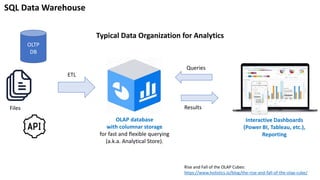
  • 1. Typical Data Organization for Analytics OLTP DB Files Queries Results OLAP database with columnar storage for fast and flexible querying (a.k.a. Analytical Store). Rise and Fall of the OLAP Cubes: https://www.holistics.io/blog/the-rise-and-fall-of-the-olap-cube/ Interactive Dashboards (Power BI, Tableau, etc.), Reporting SQL Data Warehouse ETL
  • 2. Kimball DW Framework Kimball Group – closed in 2015 https://www.kimballgroup.com/ Inmon DW Framework William H. Inmon (1945 – present) Ralph Kimball (1944 – present)
  • 3. The Times of Inmon & Kimball Imagine computers of 1970s. • A computer occupy the whole floor of a building • Computer have memory measured in 10s of Kilobytes • Punch cards slowly transition to magnetic tapes • IBM introduced VSAM files, relations, SQL • Usually just one computer in whole organization (IBM Mainframe or similar) • "Dumb terminals" connecting to the central computer. There are no personal computers • All company's information is typically stored in one central computer • In 1985 a "BIG" database would have 100 MBytes disk storage and 10-15 KB/sec data transfer speed These are times when Inmon & Kimball were crafting their approaches. As computers have become cheaper and more powerful, organization were able to buy several computers – one per department. Then people had to decide how to structure flows of information. • Inmon: from central main computer down to departments • Kimball: from departments to central Now 30-40 years later any smart phone is more powerful than "huge" DW systems of Inmon & Kimball's era. https://www.dataversity.net/a-short-history-of-data-warehousing/
  • 4. OLAP Cube – Rise and Fall Old way of doing things: Data >> Raw DB >> DW >> OLAP Cube >> Reporting The above "old way" Includes a lot of ETL, Data modeling & Design: • Kimball Framework • Inmon Framework • Data Vault by Dan Linstedt (combines Kimball & Inmon). But imagine that memory and compute power have become so cheap that your regular SQL database can run any queries very fast using in-memory columnar storage and MPP = Massive Parallel Processing. Then you don't need to hire data modelers. You don't need all the OLAP infrastructure. You can simply query your data as it is. Data >> Reporting The Rise and Fall of the OLAP Cube - by Cedric Chin (2020) - https://www.holistics.io/blog/the-rise-and-fall-of-the-olap-cube/ OLAP Past, Present, and Future - https://senturus.com/blog/olap-past-present-future/ Kimball "Star Schema" Dimensional data Modeling
  • 5. Ralph Kimball’s paradigm: • Each department in a company has its own Data Mart (DM). The company's DW (Data Warehouse) is the conglomerate of all DMs. • Information is always stored in the dimensional model. Bill Inmon’s paradigm: • A company has one central DW (Data Warehous). Data Marts (DMs) source their data from the DW. • In the DW, information is stored in 3rd normal form. ( https://en.wikipedia.org/wiki/Third_normal_form ) Inmon vs Kimball
  • 6. Kimball vs Inmon Parameters Kimball Inmon Introduced by Introduced by Ralph Kimball. Introduced by Bill Inmon. Approach It has Bottom-Up Approach for implementation. It has Top-Down Approach for implementation. Data Integration It focuses Individual business areas. It focuses Enterprise-wide areas. Building Time It is efficient and takes less time. It is complex and consumes a lot of time. Cost It has iterative steps and is cost effective. Initial cost is huge and development cost is low. Skills Required It does not need such skills but a generic team will do job. It needs specialized skills to make work. Maintenance Here maintenance is difficult. Here maintenance is easy. Data Model It prefers data to be in De- normalized model. It prefers data to be in normalized model. Data Store Systems In this, source systems are highly stable. In this, source systems have high rate of change. This is no longer needed
  • 7. MOLAP, MDX, DAX SSAS (Microsoft SQL Server Analysis Services). • 1999 - MOLAP - multidimensional engine and MDX (pre-aggregated data) • 2009 - tabular VertiPaq engine and DAX (vertically packed in-memory data) MDX (MultiDimensional eXpressions) – by Mosha Pasumansky • https://en.wikipedia.org/wiki/Mosha_Pasumansky • https://www.linkedin.com/in/mosha/ • https://www.youtube.com/watch?v=mX51gMNsT5M (Mosha sings) DAX (Data Analysis eXpressions) by Amir Netz , Cristian Petculescu, and Microsoft team, self-service, measure-based, visual, interactive, slice/dice. • https://en.wikipedia.org/wiki/Data_analysis_expressions • https://www.kasperonbi.com/the-rise-and-history-of-power-bi-with-amir-netz/ • https://www.youtube.com/watch?v=izOppfQGanI • https://news.microsoft.com/stories/people/amir-netz.html Mosha Pasumansky, Microsoft 2005-2011, Google 2011-Present Amir Netz Microsoft since 1997 Cristian Petculescu Microsoft since 1997 Rise and Fall of the OLAP Cubes: https://www.holistics.io/blog/the-rise-and-fall-of-the-olap-cube/
  • 8. Synapse Integrate Data Pipelines Azure Data Lake (Files & Blobs) Machine Learning Web End-Points Serverless and Dedicated SQL Pools Distributed Parallel Data Processing, Machine Learning SQL Pre-aggregated Data Streaming Data The Modern Data Warehouse Solution Pattern • Move from on-prem to cloud • Include all tools: data moving, storing, processing, analysis, and serving • All tools are interconnected and work together (Synapse)
  • 9. Modern Cloud-Based Data Warehouse • Multi-component architecture allows for fast and flexible configuration to fit desired results • Data moving and preparation is fast and scalable • Speedy and efficient time-to-analytics • More manageable and customizable cost of ownership • Analytics-driven rise in productivity across the organization • Access is always available • Scalable from small to large amounts of data Traditional On-Prem Data Warehouse • Expensive/high-maintenance on-premise server setup • Rigid structure relying mostly on scheduled ETL processes • Limited speed potential • Expensive upgrades (hardware) • Limited scalability • Overall slower limited analytical processing Much Better !
  • 10. Should we still use a Kimball approach on a modern data warehouse? Answer in most cases – yes. Not for performance reason, but for better data maintenance. Kimball's star schema always had three advantages: • takes less storage space – no longer relevant • performance – no longer relevant • data maintenance (loads, updates, restructuring) Wide denormalized tables can have good performance, but updating a "dimension" field in a denormalized table may require updating millions of records. Also if we loading data from several different systems, a Kimball approach helps to identify and standardize common dimensions. Also when implementing dashboards, fact table and dimension tables make queries easier to do. Good discussions: https://discourse.getdbt.com/t/is-kimball-dimensional-modeling-still- relevant-in-a-modern-data-warehouse/225 https://www.linkedin.com/pulse/kimball-still-relevant-modern-data- warehouse-simon-whiteley/ Kimball's "Star Schema" facts table in the middle surrounded by dimensions tables
  • 11. Who Invented Azure DW MPP Technology? MPP = Massively Parallel Processing In 2008 Microsoft acquired DATAllegro. DATAllegro was a company that specialized in data warehousing appliances. Similar to IBM Netezza, but running on top of commodity Dell Linux servers. It was founded in 2003 by Stuart Frost. SQL Server Parallel Data Warehouse was built using this technology and a version of the SQL Server database engine. • https://en.wikipedia.org/wiki/DATAllegro • https://www.linkedin.com/in/stu-frost/ • https://www.crunchbase.com/person/stuart-frost • https://geminos.ai/ Stuart Frost
  • 12. Feeding data from transactional Database (Cosmos DB) into Analytical Store Region1 Region3 Region2 Region1 Link (Sync) Transactions replicated between regions Analytical store(s) can be set up in any region See also: Change feed in Azure Cosmos DB https://docs.microsoft.com/en-us/azure/cosmos-db/change-feed
  • 13. Transactional Store, massive inserts, key-value (JSON doc) Analytical Columnar Store Operational Data Configuring Synapse Link for Cosmos DB means enabling Analytical Store in Cosmos DB and enabling automatic sync of data into it. So you can use SQL to query data from Analytical Store without slowing down the Transactional Store. Cosmos DB Link for Cosmos DB Link for Cosmos DB Cosmos DB SQL Query Auto-Sync Power BI ML Studio Azure Synapse Analytics Azure Data Lake Storage (Files)
  • 14. Question: How Link manages to do real-time replication? It is interesting because inserts into analytical DBs are usually very slow. Answer: (from a Microsoft architect): In a nutshell this is achieved using the combination of micro-batch jobs and mass parallel ingestion. As you know, Synapse doesn't perform well under transactional load due to variety of factors, but using Polybase removes these limitations. Think about repointing Polybase to some other source (other than ADLS for example). Some ideas around the actual implementation you can figure out using the Polaris public paper (2020, 50 authors, 13 pages) : - http://www.vldb.org/pvldb/vol13/p3204-saborit.pdf Here is the video walking through this Polaris paper explaining how the Azure Synapse serveless SQL engine works: - https://www.youtube.com/watch?v=IqjVZexHCcE Link for Cosmos DB – how it works Note – Synapse servers and POLARIS run on Linux OS and use .NET / C#
  • 15. Databases can be optimized for OLTP (On-Line Transactional Processing) or OLAP (On-Line Analytical Processing). For analytics we need OLAP databases. They achieve high performance of queries by using columnar indexes, massive parallelism, taking advantage of large memory and GPU. Columnar Indexes: Here is a short video (4 min) made long time ago (in 2011) showing performance advantage of columnar store indexes in Microsoft SQL server. - https://www.youtube.com/watch?v=vPN8_PCsJm4 The video demonstrates that columnar indexing is at least 40 times faster than traditional index. The query was done over a 2 Billion rows "fact" table. Note - this video is ~8 years old. Since then MS SQL Server made lots of other performance improvements. Note: first release of MS SQL Server was on April 24, 1989, 30+ years!! Modern hardware is much faster than that used in the above video. Columnar store indexing is standard/default nowadays. And of course it is available on Microsoft SQL Server on Azure cloud. Microsoft SQL Datawarehouse on Azure cloud - fast OLAP solution. - https://azure.microsoft.com/en-us/services/sql-data-warehouse/ SSAS = Microsoft SQL Server Analysis Services – uses tabular models ( in-memory compressed databases) for serving fast queries to BI tools: - https://en.wikipedia.org/wiki/Microsoft_Analysis_Services Power BI - Standard Microsoft Business Intelligence tool - https://powerbi.microsoft.com Demo of how fast Power BI Premium works with MS SQL Server - 500+ Mln rows of data - https://www.youtube.com/watch?v=mQyFp2MSl-s Demo of Kinetica DB using Tableau & Power BI: - https://www.youtube.com/watch?v=7XliLU7ZC_s Notice: - sub-second response on billions of rows of data - not need to create indexes, no wait time, fast load (even live streaming) of data Main points: - you can select from many different BI tools - they all support SQL - you can select from many SQL databases - they are fast - you can simplify your development time using standard SQL features - you can select dedicated hardware to tune your speed - you can achieve very fast response time - you can enjoy lower prices Databases optimized for analytics.
  • 16. Columnar Index = Columnstore Indexes A column-oriented DBMS (or columnar database management system) stores data tables by column rather than by row. Mostly used for analytical queries on large tables. Query performance can be 10-40 times faster than in traditional row-accessing DBMS. But inserts are slower (need to add and compress) - not suited for OLTP transactional databases. Column data is of uniform type – therefore it can be compressed better than row-oriented data (using bitmap indexes and sorting). Traditional Row-storing DB Columnar storing DB Excessive disk IO – read whole rows, discards most columns Disk IO smaller because we need to read only few columns. This allows to fit more rows into memory, thus making the query much faster (all-in-memory). Compression is not very good. Good data compression using the fact that all data in one column has the same type. Good random access. Good for analytics, not so good for random access. Can use clustered and nonclustered indexes. Columnstore index is usually clustered. But also can use separate nonclustered indexes for some columns. Good for transactions (OLTP) Good for read-only analytical queries in big fact tables (OLAP)
  • 17. How Analytical SQL Databases Have Evolved Row-based Column-based In-Memory GPU Based like Kinetica MPP Parallel DW POLARIS (thousands data cells & compute nodes) Hadoop Spark Databricks Other Databases: • noSQL • Graph
  • 18. Analytics Dashboards There are many tools on the market to help visualize data in graphs and dashboards. An interactive dashboard is a combination of graphs, text fields, and controls allowing user to select the data, filter data (for example, by date range or by geography or by user), aggregate, compare. etc. The data queries are usually formulated in SQL. Most common dashboards are:  Microsoft Power BI - https://powerbi.microsoft.com/en-us/  Tableau - https://www.tableau.com/  Qlik - https://www.qlik.com/us/  Google DataStudio - https://datastudio.google.com/  Chartio - https://chartio.com/  Jupyter dashboards - https://voila.readthedocs.io/en/stable/  Apache Superset - https://superset.incubator.apache.org/ ( also https://preset.io/ ) Here is a demo of how fast Microsoft Power BI Premium works with MS SQL Server - 500+ Mln rows of data - https://www.youtube.com/watch?v=mQyFp2MSl-s And here is a demo of Kinetica DB using Tableau & Power BI: - https://www.youtube.com/watch?v=7XliLU7ZC_s Notice: - sub-second response on billions of rows of data - no need in waiting to create indexes, fast load (even live streaming) of data (modern databases use columnstore indexes - and are highly parallelized) - https://docs.microsoft.com/en-us/sql/relational-databases/indexes/columnstore-indexes-overview?view=sql-server-2017
  • 19. The top leaders for analytics platforms are Microsoft and Tableau. Both use standard SQL to get data. https://www.gartner.com/doc/reprints?id=1-65P04FG&ct=190125 Which database to use? There are many options for SQL database. For example, on Azure Cloud - Azure SQL Data Warehouse - https://azure.microsoft.com/en-us/services/sql-data-warehouse/ BI & Power BI - https://powerbi.microsoft.com/en-us/ On Google Cloud we can use "Cloud SQL" (managed PostgreSQL) or BigQuery. We can also consider GPU-based databases, for example: - Kinetica on Google Cloud - https://www.kinetica.com/partner/google-cloud-platform/ - MapD = OmniSci - https://www.omnisci.com/ Similar options are available on AWS: Amazon RDS (PostgreSQL), Redshift, SnowFlake, Aurora, kinetica, MapD, etc. Generally for sizes more than 1TB it is preferable to have a distributed DB like Google BigQuery (or Amazon SnowFlake.net) https://statsbot.co/blog/modern-data-warehouse Speed depends on the size of the data too. At small sizes (<1TB) single-node solutions are faster (GPU-based are fastest). So it maybe either one reasonably fast DB (Azure SQL Datawarehouse), or two databases - on big - but slow (Google BigQuery), and second smaller - but very fast (omnisci MapD GPU DB for interactive visual querying) - https://fivetran.com/blog/warehouse-benchmark - https://www.omnisci.com/demos/
  • 20. Open Source for building dashboards Apache Druid - http://druid.io - open-source analytics data store (OLAP). Fast data ingestion and aggregation, scales to trillions of events and petabytes of data. Druid is best used to power analytic dashboards and applications. Apache Calcite - https://calcite.apache.org/ - translate SQL to JSON queries for Druid and other systems Visualization - why so many packages? - https://www.anaconda.com/python-data-visualization-2018-why-so-many-libraries/ Visualization for R - Shiny (R-Studio) - https://shiny.rstudio.com/ Jupyter Dashboards: ● Jupyter notebooks and dashboards - https://annefou.github.io/jupyter_dashboards/02-dashboards/index.html ● Jupyter Lab - https://jupyterlab.readthedocs.io/en/stable/ ● Jupyter Dashboards - https://github.com/jupyter/dashboards ● Voila - serve dashboards - https://github.com/voila-dashboards/voila - now part of jupyter ================================ ● ipywidgets - https://github.com/jupyter-widgets/ipywidgets - https://www.youtube.com/watch?v=i40d8-Hu4vM (40 min demo from 2017) ● bqplot - https://github.com/bloomberg/bqplot - https://www.youtube.com/watch?v=Dmxa2Kyfzxk (demo 2018) ● Bokeh - interactive graphics - https://docs.bokeh.org/en/latest/docs/user_guide.html ● ipyvolume - 3-D visualization (rotate & resize 3D graphs) in Jupyter - https://github.com/maartenbreddels/ipyvolume Apache Superset, open-source, similar to Tableau or Chartio ( https://chartio.com/ ). The dashboard definition is in JSON file, the data is queried using SQL from a database. - https://superset.incubator.apache.org/installation.html#getting-started - https://www.youtube.com/watch?v=AqousXQ7YHw – 15 min demo - https://youtu.be/24XDOkGJrEY - very good lecture (history and anatomy of Apache Superset). Looks like it has good documentation on how to install it on Linux, Mac, or Windows. And how to work with various SQL databases. Superset's stack is: Python backend (Flask App Builder (authentication, roles, CRUD,...), pandas, SqlAlchemy) + Javascript frontend Here are some examples from nvd3.org - http://nvd3.org/examples/index.html Try clicking on charts - enjoy animation effects - http://nvd3.org/examples/stackedArea.html Superset works very well with Druid - https://druid.apache.org/ - Watch this lecture - https://www.youtube.com/watch?v=vbH8E0nH2Nw - lecture about technologies to be used behind Interactive dashboards. He goes over OLAP, SQL, star-schema, key-value stores, and columnar stores. Then describes in detail why Druid is an excellent solution. Apache Druid columnar storage Apache Airflow workflow management Apache Superset Dashboards
  • 21. A Gallery of Voilà Examples https://blog.jupyter.org/a-gallery-of-voil%C3%A0-examples-a2ce7ef99130 Voila, widgets, extrapolations https://jupyter-flex.extrapolations.dev/voila-ipywidgets/ - Configure your dashboards with Voilà gridstack template https://blog.jupyter.org/voila-gridstack-template-8a431c2b353e - Jupyter Dashboards – open source and flexibility
  • 22. 1956 – loading 5 MB disk into a plane History IBM – Punch-Cards in 1950s
  • 23. History - Unix Ken Thompson (seated) and Dennis Ritchie (standing) at a PDP-11 in 1972. https://homepage.cs.uri.edu/~thenry/resources/unix_art/ch02s01.html PDP-7 minicomputer (1969) on which Ken Thompson created the Space Travel game and Unix OS