Copyright 1999 by Mary Beth Rosson and John M. Carroll
DRAFT: PLEASE DO NOT CITE OR CIRCULATE WITHOUT PERMISSION
Scenario-Based Usability Engineering
Mary Beth Rosson and John M. Carroll
Department of Computer Science
Virginia Tech
Fall 1999
DRAFT: PLEASE DO NOT CITE OR CIRCULATE WITHOUT PERMISSION
SBUE—Chapter 3 1
Copyright 1999 by Mary Beth Rosson and John M. Carroll
Chapter 3
Analyzing Requirements
Making work visible. The end goal of requirements analysis can be elusive when work is not
understood in the same way by all participants. Blomberg, Suchman, and Trigg describe this
problem in their exploration of image-processing services for a law firm. Initial studies of
attorneys produced a rich analysis of their document processing needs—for any legal proceeding,
documents often numbering in the thousands are identified as “responsive” (relevant to the case) by
junior attorneys, in order to be submitted for review by the opposing side. Each page of these
documents is given a unique number for subsequent retrieval. An online retrieval index is created
by litigation support workers; the index encodes document attributes such as date, sender,
recipient, and type. The attorneys assumed that their job (making the subjective relevance
decisions) would be facilitated by image processing that encodes a documents’s objective attributes
(e.g., date, sender). However, studies of actual document processing revealed activities that were
not objective at all, but rather relied on the informed judgment of the support staff. Something as
simple as a document date was often ambiguous, because it might display the date it was written,
signed, and/or delivered; the date encoded required understanding the document’s content and role
in a case. Even determining what constituted a document required judgment, as papers came with
attachments and no indication of beginning or end. Taking the perspective of the support staff
revealed knowledge-based activities that were invisible to the attorneys, but that had critical limiting
implications for the role of image-processing technologies (see Blomberg, 1995).
DRAFT: PLEASE DO NOT CITE OR CIRCULATE WITHOUT PERMISSION
SBUE—Chapter 3 2
Copyright 1999 by Mary Beth Rosson and John M. Carroll
What is Requirements Analysis?
The purpose of requirements analysis is to expose the needs of the current situation with
respect to a proposed system or technology. The analysis begins with a mission statement or
orienting goals, and produces a rich description of current activities that will motivate and guide
subsequent development. In the legal office case described above, the orienting mission was
possible applications of image processing technology; the rich description included a view of case
processing from both the lawyers’ and the support staffs’ perspectives. Usability engineers
contribute to this process by analyzing what and how features of workers’ tasks and their work
situation ...
Copyright 1999 by Mary Beth Rosson and John M. CarrollDR
1. DRAFT: PLEASE DO NOT CITE OR CIRCULATE WITHOUT
PERMISSION
Scenario-Based Usability Engineering
Mary Beth Rosson and John M. Carroll
Department of Computer Science
Virginia Tech
Fall 1999
DRAFT: PLEASE DO NOT CITE OR CIRCULATE WITHOUT
PERMISSION
SBUE—Chapter 3 1
Chapter 3
Analyzing Requirements
Making work visible. The end goal of requirements analysis
can be elusive when work is not
understood in the same way by all participants. Blomberg,
Suchman, and Trigg describe this
problem in their exploration of image-processing services for a
2. law firm. Initial studies of
attorneys produced a rich analysis of their document processi ng
needs—for any legal proceeding,
documents often numbering in the thousands are identified as
“responsive” (relevant to the case) by
junior attorneys, in order to be submitted for review by the
opposing side. Each page of these
documents is given a unique number for subsequent retrieval.
An online retrieval index is created
by litigation support workers; the index encodes document
attributes such as date, sender,
recipient, and type. The attorneys assumed that their job
(making the subjective relevance
decisions) would be facilitated by image processing that
encodes a documents’s objective attributes
(e.g., date, sender). However, studies of actual document
processing revealed activities that were
not objective at all, but rather relied on the informed judgment
of the support staff. Something as
simple as a document date was often ambiguous, because it
might display the date it was written,
signed, and/or delivered; the date encoded required
understanding the document’s content and role
in a case. Even determining what constituted a document
required judgment, as papers came with
attachments and no indication of beginning or end. Taking the
perspective of the support staff
revealed knowledge-based activities that were invisible to the
attorneys, but that had critical limiting
implications for the role of image-processing technologies (see
Blomberg, 1995).
DRAFT: PLEASE DO NOT CITE OR CIRCULATE WITHOUT
PERMISSION
3. SBUE—Chapter 3 2
What is Requirements Analysis?
The purpose of requirements analysis is to expose the needs of
the current situation with
respect to a proposed system or technology. The analysis
begins with a mission statement or
orienting goals, and produces a rich description of current
activities that will motivate and guide
subsequent development. In the legal office case described
above, the orienting mission was
possible applications of image processing technology; the rich
description included a view of case
processing from both the lawyers’ and the support staffs’
perspectives. Usability engineers
contribute to this process by analyzing what and how features of
workers’ tasks and their work
situation are contributing to problems or successes1. This
analysis of the difficulties or
opportunities forms a central piece of the requirements for the
system under development: at the
minimum, a project team expects to enhance existing work
practices. Other requirements may arise
from issues unrelated to use, for example hardware cost,
development schedule, or marketing
strategies. However these pragmatic issues are beyond the
scope of this textbook. Our focus is on
analyzing the requirements of an existing work setting and of
the workers who populate it.
Understanding Work
4. What is work? If you were to query a banker about her work,
you would probably get a
list of things she does on a typical day, perhaps a description of
relevant information or tools, and
maybe a summary of other individuals she answers to or makes
requests of. At the least,
describing work means describing the activities, artifacts (data,
documents, tools), and social
context (organization, roles, dependencies) of a workplace. No
single observation or interview
technique will be sufficient to develop a complete analysis;
different methods will be useful for
different purposes.
Tradeoff 3.1: Analyzing tasks into hierarchies of sub-tasks and
decision rules brings order
to a problem domain, BUT tasks are meaningful only in light of
organizational goals and
activities.
A popular approach to analyzing the complex activities that
comprise work is to enumerate
and organize tasks and subtasks within a hierarchy (Johnson,
1995). A banker might indicate that
the task of “reviewing my accounts” consists of the subtasks
“looking over the account list”,
“noting accounts with recent activity”, and “opening and
reviewing active accounts”. Each of these
sub-tasks in turn can decomposed more finely, perhaps to the
level of individual actions such as
picking up or filing a particular document. Some of the tasks
will include decision-making, such
1 In this discussion we use “work” to refer broadly to the goal -
directed activities that take place in the
5. problem domain. In some cases, this may involve leisure or
educational activities, but in general the same methods
can be applied to any situation with established practices.
DRAFT: PLEASE DO NOT CITE OR CIRCULATE WITHOUT
PERMISSION
SBUE—Chapter 3 3
as when the banker decides whether or not to open up a specific
account based on its level of
activity.
A strength of task analysis is its step-by-step transformation of
a complex space of
activities into an organized set of choices and actions. This
allows a requirements analyst to
examine the task’s structure for completeness, complexity,
inconsistencies, and so on. However
the goal of systematic decomposition can also be problematic, if
analysts become consumed by
representing task elements, step sequences, and decision rules.
Individual tasks must be
understood within the larger context of work; over-emphasizing
the steps of a task can cause
analysts to miss the forest for the trees. To truly understand the
task of reviewing accounts a
usability engineer must learn who is responsible for ensuring
that accounts are up to date, how
account access is authorized and managed, and so on.
6. The context of work includes the physical, organizational,
social, and cultural relationships
that make up the work environment. Actions in a workplace do
not take place in a vacuum;
individual tasks are motivated by goals, which in turn are part
of larger activities motivated by the
organizations and cultures in which the work takes place (see
Activities of a Health Care Center,
below). A banker may report that she is reviewing accounts,
but from the perspective of the
banking organization she is “providing customer service” or
perhaps “increasing return on
investment”. Many individuals — secretaries, data-entry
personnel, database programmers,
executives — work with the banker to achieve these high-level
objectives. They collaborate
though interactions with shared tools and information; this
collaboration is shaped not only by the
tools that they use, but also by the participants’ shared
understanding of the bank’s business
practice — its goals, policies, and procedures.
Tradeoff 3.2: Task information and procedures are externalized
in artifacts, BUT the impact
of these artifacts on work is apparent only in studying thei r use.
A valuable source of information about work practices is the
artifacts used to support task
goals (Carroll & Campbell, 1989). An artifact is simply a
designed object — in an office setting, it
might be a paper form, a pencil, an in-basket, or a piece of
computer software. It is simple and fun
to collect artifacts and analyze their characteristics (Norman,
1990). Consider the shape of a
pencil: it conveys a great deal about the size and grasping
7. features of the humans who use it;
pencil designers will succeed to a great extent by giving their
new designs the physical
characteristics of pencils that have been used for years. But
artifacts are just part of the picture.
Even an object as simple as a pencil must be analyzed as part of
a real world activity, an activity
that may introduce concerns such as erasability (elementary
school use), sharpness (architecture
firm drawings), name-brands (pre-teen status brokering), cost
(office supplies accounting), and so
on.
Usability engineers have adapted ethnographic techniques to
analyze the diverse factors
influencing work. Ethnography refers to methods developed
within anthropology for gaining
insights into the life experiences of individuals whose everyday
reality is vastly different from the
DRAFT: PLEASE DO NOT CITE OR CIRCULATE WITHOUT
PERMISSION
SBUE—Chapter 3 4
analyst’s (Blomberg, 1990). Ethnographers typically become
intensely involved in their study of a
group’s culture and activities, often to the point of becoming
members themselves. As used by
HCI and system design communities, ethnography involves
observations and interviews of work
groups in their natural setting, as well as collection and analysis
8. of work artifacts (see Team Work
in Air Traffic Control, below). These studies are often carried
out in an iterative fashion, where
the interpretation of one set of data raises questions or
possibilities that may be pursued more
directly in follow-up observations and interviews.
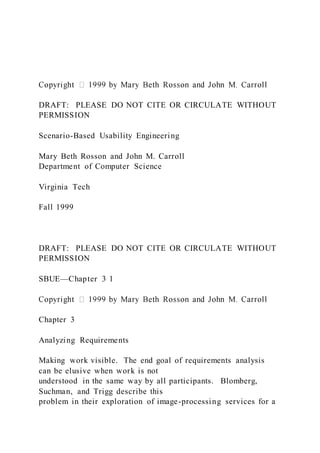
Figure 3.1: Activity Theory Analysis of a Health Care Center
(after Kuuiti and Arvonen, 1992)
Activities of a Health Care Center: Activity Theory (AT) offers
a view of individual
work that grounds it in the goals and practices of the community
within which the work takes
place. Engeström (1987) describes how an individual (the
subject) works on a problem (the
object) to achieve a result (the outcome), but that the work on
the problem is mediated by the tools
available (see Figure 3.2m). An individual’s work is also
mediated by the rules of practice shared
within her community; the object of her work is mediated by
that same communities division of
labor.
Kuutti and Arvonen (1992; see also Engeström 1990; 1991;
1993) applied this framework
to their studies of a health care organization in Espoo, Finland.
This organization wished to evolve
Tools Supporting Activity:
Subject Involved in Activity:
Community sponsoring Activity:
Object of Activity:
9. Activity Outcome:
Division of LaborRules of Practice
patient record, medicines, etc.
one physician in a health care unit
all personnel of the health care unit
the complex, multi-dimensional
problem of a patient
patient problem resolved
DRAFT: PLEASE DO NOT CITE OR CIRCULATE WITHOUT
PERMISSION
SBUE—Chapter 3 5
from a rather bureaucratic organization with strong separations
between its various units (e.g.,
social work, clinics, hospital) to a more service-oriented
organization. A key assumption in doing
this was that the different units shared a common general object
of work—the “life processes” of
the town’s citizens. This high-level goal was acknowledged to
be a complex problem requiring the
integrated services of complementary health care units.
The diagram in Figure 3.1 summarizes an AT analysis
10. developed for one physician in a
clinic. The analysis records the shared object (the health
conditions of a patient). At the same time
it shows this physician’s membership in a subcommunity,
specifically the personnel at her clinic.
This clinic is both geographically and functionally separated
from other health care units, such as
the hospital or the social work office. The tools that the
physician uses in her work, the rules that
govern her actions, and her understanding of her goals are
mediated by her clinic. As a result, she
has no way of analyzing or finding out about other dimensions
of this patient’s problems, for
example the home life problems being followed by a social
worker, or emotional problems under
treatment by psychiatric personnel. In AT such obstacles are
identified as contradictions which
must be resolved before the activity can be successful.
In this case, a new view of community was developed for the
activity. For each patient,
email or telephone was used to instantiate a new community,
comprised of individuals as relevant
from different health units. Of course the creation of a more
differentiated community required
negotiation concerning the division of labor (e.g. who wi ll
contact whom and for what purpose),
and rules of action (e.g., what should be done and in what
order). Finally, new tools (composite
records, a “master plan”) were constructed that better supported
the redefined activity.
Figure 3.2 will appear here, a copy of the figure provided by
Hughes et al. in their
ethnographic report. Need to get copyright permission.
11. Team Work in Air Traffic Control: An ethnographic study of
British air traffic
control rooms by Hughes, Randall and Shapiro (CSCW’92)
highlighted the central role played by
the paper strips used to chart the progress of individual flights.
In this study the field workers
immersed themselves in the work of air traffic controllers for
several months. During this time
they observed the activity in the control rooms and talked to the
staff; they also discussed with the
staff the observations they were collecting and their
interpretation of these data.
The general goal of the ethnography was to analyze the social
organization of the work in
the air traffic control rooms. In this the researchers showed
how the flight progress strips
supported “individuation”, such that each controller knew what
their job was in any given
situation, but also how their tasks were interdependent with the
tasks of others. The resulting
division of labor was accomplished in a smooth fashion because
the controllers had shared
knowledge of what the strips indicated, and were able to take on
and hand off tasks as needed, and
to recognize and address problems that arose.
DRAFT: PLEASE DO NOT CITE OR CIRCULATE WITHOUT
PERMISSION
SBUE—Chapter 3 6
12. Each strip displays an airplane’s ID and aircraft type; its
current level, heading, and
airspeed; its planned flight path, navigation points on route,
estimated arrival at these points; and
departure and destination airports (see Figure 3.2). However a
strip is more than an information
display. The strips are work sites, used to initiate and perform
control tasks. Strips are printed
from the online database, but then annotated as flight events
transpire. This creates a public
history; any controller can use a strip to reconstruct a
“trajectory” of what the team has done with a
flight. The strips are used in conjunctio n with the overview
offered by radar to spot exceptions or
problems to standard ordering and arrangement of traffic. An
individual strip gets “messy” to the
extent it has deviated from the norm, so a set of strips serves as
a sort of proxy for the orderliness
of the skies.
The team interacts through the strips. Once a strip is printed
and its initial data verified, it is
placed in a holder color-coded for its direction. It may then be
marked up by different controllers,
each using a different ink color; problems or deviations are
signaled by moving a strip out of
alignment, so that visual scanning detects problem flights. This
has important social consequences
for the active controller responsible for a flight. She knows that
other team members are aware of
the flight’s situation and can be consulted; who if anyone has
noted specific issues with the flight;
if a particularly difficult problem arises it can be passed on to
the team leader without a lot of
explanation; and so on.
13. The ethnographic analysis documented the complex tasks that
revolved around the flight
control strips. At the same time it made clear the constraints of
these manually-created and
maintained records. However a particularly compelling element
of the situation was the
controllers’ trust in the information on the strips. This was due
not to the strips’ physical
characteristics, but rather to the social process they enable—the
strips are public, and staying on
top of each others’ problem flights, discussing them informally
while working or during breaks, is
taken for granted. Any computerized replacement of the strips
must support not just management
of flight information, but also the social fabric of the work that
engenders confidence in the
information displayed.
User Involvement
Who are a system’s target users? Clearly this is a critical
question for a user-centered
development process. It first comes up during requirements
analysis, when the team is seeking to
identify a target population(s), so as to focus in on the activities
that will suggest problems and
concerns. Managers or corporation executives are a good
source of high-level needs statements
(e.g., reduce data-processing errors, integrate billing and
accounting). Such individuals also have
a well-organized view of their subordinates’ responsibilities ,
and of the conditions under which
various tasks are completed. Because of the hierarchical nature
of most organizations, such
individuals are usually easily to identify and comprise a
relatively small set. Unfortunately if a
14. requirements team accepts these requirements too readily, they
may miss the more detailed and
situation-specific needs of the individuals who will use a new
system in their daily work.
DRAFT: PLEASE DO NOT CITE OR CIRCULATE WITHOUT
PERMISSION
SBUE—Chapter 3 7
Tradeoff 3.3: Management understands the high-level
requirements for a system, BUT is
often unaware of workers’ detailed needs and preferences.
Every system development situation includes multiple
stakeholders (Checklund, 1981).
Individuals in management positions may have authorized a
system’s purchase or development;
workers with a range of job responsibilities will actually use the
system; others may benefit only
indirectly from the tasks a system supports. Each set of
stakeholders has its own set of
motivations and problems that the new system might address
(e.g., productivity, satisfaction, ease
of learning). What’s more, none of them can adequately
communicate the perspectives of the
others — despite the best of intentions, many details of a
subordinate’s work activities and
concerns are invisible to those in supervisory roles. Clearly
what is needed in requirements
analysis is a broad-based approach that incorporates diverse
stakeholder groups into the
15. observation and interviewing activities.
Tradeoff 3.4: Workers can describe their tasks, BUT work is
full of exceptions, and the
knowledge for managing exceptions is often tacit and difficult
to externalize.
But do users really understand their own work? We made the
point above that a narrow
focus on the steps of a task might cause analysts to miss
important workplace context factors. An
analogous point holds with respect to interviews or discussions
with users. Humans are
remarkably good (and reliable) at “rationalizing” their behaivor
(Ericsson & Simon, 1992).
Reports of work practices are no exception — when asked
workers will usually first describe a
most-likely version of a task. If an established “procedures
manual” or other policy document
exists, the activities described by experienced workers will
mirror the official procedures and
policies. However this officially-blessed knowledge is only
part of the picture. An experienced
worker will also have considerable “unofficial” knowledge
acquired through years of encountering
and dealing with the specific needs of different situations, with
exceptions, with particular
individuals who are part of the process, and so on. This
expertise is often tacit, in that the
knowledgeable individuals often don’t even realize what they
“know” until confronted with their
own behavior or interviewed with situation-specific probes (see
Tacit Knowledge in Telephone
Trouble-Shooting, below). From the perspective of
requirements analysis, however, tacit
knowledge about work can be critical, as it often contains the
16. “fixes” or “enhancements” that have
developed informally to address the problems or opportunities
of day-to-day work.
One effective technique for probing workers’ conscious and
unconscious knowledge is
contextual inquiry (Beyers & Holtzblatt, 1994). This analysis
method is similar to ethnography, in
that it involves the observation of individuals in the context of
their normal work environment.
However it includes the perogative to interrupt an observed
activity at points that seem informative
(e.g., when a problematic situation arises) and to interview the
affected individual(s) on the spot
concerning the events that have been observed, to better
understand causal factors and options for
continuing the activity. For example, a usability engineer who
saw a secretary stop working on a
DRAFT: PLEASE DO NOT CITE OR CIRCULATE WITHOUT
PERMISSION
SBUE—Chapter 3 8
memo to make a phone call to another secretary, might ask her
afterwards to explain what had just
happened between her and her co-worker.
Tacit Knowledge in Telephone Trouble-Shooting: It is common
for workers to
see their conversations and interactions with each other as a
social aspect of work that is enjoyable
17. but unrelated to work goals. Sachs (199x) observed this in her
case study of telephony workers in
a phone company. The study analyzed the work processes
related to detecting, submitting, and
resolving problems on telephone lines; the focus of the study
was the Trouble Ticketing System
(TTS), a large database used to record telephone line problems,
assign problems (tickets) to
engineers for correction, and keep records of problems detected
and resolved.
Sachs argues that TTS takes an organizational view of work,
treating work tasks as
modular and well-defined: one worker finds a problem, submits
it to the database, TTS assigns it
to the engineer at the relevant site, that engineer picks up the
ticket, fixes the problem, and moves
on. The original worker is freed from the problem analysis task
once the original ticket, and the
second worker can move on once the problem has been
addressed. TTS replaced a manual system
in which workers contacted each other directly over the phone,
often working together to resolve a
problem. TTS was designed to make work more efficient by
eliminating unnecessary phone
conversations.
In her interviews with telephony veterans, Sachs discovered that
the phone conversations
were far from unnecessary. The initiation, conduct, and
consequences of these conversations
reflected a wealth of tacit knowledge on the part of the worker --
selecting the right person to call
(one known to have relevant expertise for this apparent
problem), the “filling in” on what the first
worker had or had not determined or tried to this point, sharing
18. of hypotheses and testing methods,
iterating together through tests and results, and carrying the
results of this informal analysis into
other possibly related problem areas. In fact, TTS had made
work less efficient in many cases,
because in order to do a competent job, engineers developed
“workarounds” wherein they used
phone conversations as they had in the past, then used TTS to
document the process afterwards.
Of interest was that the telephony workers were not at first
aware of how much knowledge
of trouble-shooting they were applying to their jobs. They
described the tasks as they understood
them from company policy and procedures. Only after
considerable data collection and discussion
did they recognize that their jobs included the skills to navigate
and draw upon a rich organizational
network of colleagues. In further work Sachs helped the phone
company to develop a fix for the
observed workarounds in the form of a new organizational role:
a “turf coordinator”, a senior
engineer responsible for identifying and coordinating the
temporary network of workers needed to
collaborate on trouble-shooting a problem. As a result of
Sach’s analysis, work that had been tacit
and informal was elevated to an explicit business responsibility.
Requirements Analysis with Scenarios
As introduced in Chapter 2, requirements refers to the first
phase of SBUE. As we also
have emphasized, requirements cannot be analyzed all at once in
waterfall fashion. However some
19. DRAFT: PLEASE DO NOT CITE OR CIRCULATE WITHOUT
PERMISSION
SBUE—Chapter 3 9
analysis must happen early on to get the ball rolling. User
interaction scenarios play an important
role in these early analysis activities. When analysts are
observing workers in the world, they are
collecting observed scenarios, episodes of actual interaction
among workers that may or may not
involve technology. The analysis goal is to produce a summary
that captures the critical aspects of
the observed activities. A central piece of this summary
analysis is a set of requirements scenarios.
The development of requirements scenarios begins with
determining who are the
stakeholders in a work situation — what their roles and
motivations are, what characteristics they
possess that might influence reactions to new technology. A
description of these stakeholders’
work practice is then created, through a combination of
workplace observation and generation of
hypothetical situations. These sources of data are summarized
and combined to generate the
requirements scenarios. A final step is to call out the most
critical features of the scenarios, along
with hypotheses about the positive or negative consequences
that these features seem to be having
on the work setting.
Introducing the Virtual Science Fair Example Case
20. The methods of SBUE will be introduced with reference to a
single open-ended example
problem, the design of a virtual science fair (VSF). The high-
level concept is to use computer-
mediated communication technology (e.g., email, online chat,
discussion forums,
videoconferencing) and online archives (e.g., databases, digital
libraries) to supplement the
traditional physical science fairs. Such fairs typically involve
student creation of science projects
over a period of months. The projects are then exhibited and
judged at the science fair event. We
begin with a very loose concept of what a virtual version of
such a fair might be — not a
replacement of current fairs, but rather a supplement that
expands the boundaries of what might
constitute participation, project construction, project exhibits,
judging, and so on.
Stakeholder Analysis
Checklund (1981) offers a mnemonic for guiding development
of an early shared vision of
a system’s goals — CATWOE analysis. CATWOE elements
include Clients (those people who
will benefit or suffer from the system), Actors (those who
interact with the system), a
Transformation (the basic purpose of the system), a
Weltanschauung (the world view promoted by
the system), Owners (the individuals commissioning or
authorizing the system), and the
Environment (physical constraints on the system). SBUE adapts
Checklund’s technique as an aid
in identifying and organizing the concerns of various
stakeholders during requirements
21. analysis.The SBUE adaptation of Checklund’s technique
includes the development of thumbnail
scenarios for each element identified. The table includes just
one example for each VSF element
called out in the analysis; for a complex situation multiple
thumbnails might be needed. Each
scenario sketch is a usage-oriented elaboration of the element
itself; the sketch is points to a future
situation in which a possible benefit, interaction, environmental
constraint, etc., is realized. Thus
the client thumbnails emphasize hoped-for benefits of the VSF;
the actor thumbnails suggest a few
interaction variations anticipated for different stakeholders.
The thumbnail scenarios generated in
DRAFT: PLEASE DO NOT CITE OR CIRCULATE WITHOUT
PERMISSION
SBUE—Chapter 3 10
this analysis are not yet design scenarios, they simply allow the
analyst to begin to explore the
space of user groups, motivations, and pragmatic constraints.
The CATWOE thumbnail scenarios begin the iterative process
of identifying and analyzing
the background, motivations, and preferences that different user
groups will bring to the use of the
target system. This initial picture will be elaborated throughout
the development process, through
analysis of both existing and envisioned usage situations.
22. CATWOE
Element
V S F
Element
Thumbnail
Scenarios
Clients Students
Community members
A high school student learns about road-bed coatings from a
retired civil engineer.
A busy housewife helps a middle school student organize her
bibliographic information.
Actors Students
Teachers
Community members
A student imports an Excel spreadsheet containing her
analysis of acid rainfall.
A teacher checks over the 10 projects underway by students
in her class.
A retired pharmicist hears about the VSF over email and
visits it for the first time.
Transformation Ongoing community-
wide access to student
23. projects
A student browses comments left by his friends, his father,
and his former Boy Scout leader.
Weltanschauung Learning benefits from
community
involvement
After exhibiting a project on heat transfer, two students
show up at a town meeting to discuss concerns about the
new school.
Owners School district At a regional meeting, the school district
reports on the
number of visitors and comments contributed to the online
fair.
Environment Computer labs
T1 lines to public
meeting places (e.g.,
library)
Home modems
Several students stay after school and work on their separate
projects together in the lab, chatting while they work.
A regular user of the town library sits down at the public
terminal for the first time and is drawn into the online fair.
A mother logs on after dinner to visit with her friends and
check in on her son’s project.
Table 3.1: Catwoe Elements and Stakeholder Thumbnail
24. Scenarios
for Science Fair
Observing Current Practice
The CATWOE analysis sets the scene for the study of current
practice. With a shared
understanding of major stakeholders and general project goals,
the team can begin to analyze the
activities that will be transformed by the system. In doing so,
attention should be given to the
needs and concerns of all parties. In the case of our VSF
example, this implies analysis of
students, teachers, community members, and the school
organization. Although the CATWOE
DRAFT: PLEASE DO NOT CITE OR CIRCULATE WITHOUT
PERMISSION
SBUE—Chapter 3 11
1999 by Mary Beth Rosson and John M. Carroll
analysis is intended as a scoping and planning aid, note that
new stakeholders, motivations, or
environmental factors may emerge through these studies of
practice.
Preparing for Data Collection
The CATWOE analysis is just one initial activity that is useful
in preparing for data
collection. The process of identifying stakeholders and
discussing orienting goals will raise many
25. questions about the situation a team hopes to impact. For the
VSF, the analysts might wonder
what sorts of projects students currently develop and exhibit,
what resources they draw on for
project development, how the projects are exhibited and judged,
how and when parents contribute
to project work, and so on. These sorts of scoping di scussions
serve an orienting role, and for
new teams can help group members learn about one another —
personal background, interests,
biases, as well as skills and aptitudes.
Guide for Interviewing Student-Participants in a Science Fair
Remember that our goal is to understand how and why students
participate in the science fair. We want
to know the things they do as part of the fair, and the sorts of
resources (both physical and human) they
use. We also want to learn something about the individuals we
talk to—their history, and especially their
use of or reactions to technology associated with science fairs.
Open-ended prompts (follow the interviewee’s lead):
How long have you been in science fairs; have you exhibited
before?
How did you get involved in this year’s fair?
Tell me about your exhibit; can you show it to me? What did
you do create it?
Did anyone else work with you on this project? How?
Tell me about the other people you have interacted with as part
of the fair.
26. How will (or has) the judging take place?
What do you like about this science fair (or about your exhibit)?
What are you unhappy with?
Specific things we want to know (ask directly if they’ve not yet
been covered):
What technology (computer or otherwise) have you used in this
project?
What technology would you have liked to use if it was
available?
What background do you have in using computers?
How could an expert from the community contribute to your
science project?
How could your parents contribute?
Can you imagine an online version of this science fair? What
would it be like?
Table 3.2: Interviewing Guide for Field Study of Science Fair
In addition to developing a shared understanding of project
scope, the team must consider
its own organization. It will help of one member takes on a
leadership role, ensuring that decisions
are made about activities to be carried out, a schedule is
constructed, everyone understands his or
her responsibilities, and so on. It may even be useful to have
two types of leaders, one who
attends mostly to the content and results of the analysis task,
27. another who makes sure that
DRAFT: PLEASE DO NOT CITE OR CIRCULATE WITHOUT
PERMISSION
SBUE—Chapter 3 12
everyone knows their role, stays on schedule, and so on. Other
team members can take on the job
of identifying and making contact with individuals will to be
observed or interviewed. Others can
focus on creating and assembling an interviewing guide and
data capture tools.
An interviewing guide should be created that will support but
not over-constrain how team
members observe and question individuals in the work setting.
It may be necessary to produce
different guides for different stakeholder representatives. The
guide should begin with an
introduction that reminds the interviewer of what he or she
hopes to accomplish in the questioning.
Because the goal is to learn what the participants think about
their own activities, the guide should
not suggest specific and pointed questions early in the
interview. Instead, begin with open-ended
prompts that ascertain the interviewee’s general background and
how they think about their work
(“tell me about what you do”). List specific questions that
emerge from group brainstorming at the
end, so that the interviewers will be certain to address these
issues if they are not raised by the
28. interviewee. A guide for talking to student participants in a
science fair appears in Table 3.2.
In addition to preparing an interviewing guide(s), the team must
decide how to document
their observations. If the work setting involves considerable
physical manipulation of objects, a
videotape may be helpful (though you should first check with
participants to see if they are
comfortable with this). Otherwise, a small tape recorder might
be used to record conversations. In
either case, plan in advance how you will use the recording
equipment (e.g., where you will place
the camera(s) or the microphone, how many tapes you will
need), and be sure to get participants’
permission. It may also be useful to bring along a camera to
capture interesting visual elements of
the situation. Finally, one or more team members should be
assigned the job of taking detailed
written notes. Be very clear that all recordings, photos, or notes
will be treated confidentially,
reviewed and discussed only by your analysis team.
Observations, Interviews, and Artifacts
An important element of successful workplace studies is
creating a comfortable relationship
between the team and the workplace participants. In some
settings, workers may have been
selected by management and may be resentful at having to
spend time with outsiders observing and
interviewing them about their activities. In others, participation
may be voluntary, but they may be
intimidated by the thought of interacting with “technology-
savvy” individuals. The team must be
sensitive to social factors like this and focus first on
29. establishing a friendly and non-judgmental
tone to the exchange.
Figure 3.3, a photograph of a science fair in progess will appear
here. It
shows a student demonstrating an exhibit to a small group of
visitors. It
has not been included in this file because it is a color photo and
makes the
file too big! If you are interested, there is a link to it on the
class website.
DRAFT: PLEASE DO NOT CITE OR CIRCULATE WITHOUT
PERMISSION
SBUE—Chapter 3 13
Whenever possible, visit a workplace instead of bringing
participants to you. This puts the
burden on you rather than the individuals you are studying, as
well as giving you the opportunity
to observe authentic work activities. If there is time and a
participant is willing, observe her as she
carries out one or more typical tasks. If you are collecting
video or audio tape, remember to get the
participant’s permission before turning it on, and be sure to
identify the tape with date, time, place,
and participant. Take notes conscientiously, writing down
everything that happens, not just things
that catch your attention. If something happens that you cannot
understand, or if task details aren’t
apparent (e.g., a computer activities that involve a sequence of
30. data or procedures), interrupt
briefly, just enough to get a summary of what is happening.
After the observation period,
interview the participant according to the guide developed in
advance. Prior to launching into the
material in your guide, ask the participant to comment on what
they have just been doing; this
provides a seamless transition from the observation period to
the interview.
The photo in Figure 3.3 was taken during a visit to a science
fair and documents interesting
elements of current science fairs. For example, the student is
using a computer as part of his
exhibit, and is showing his project to several people at the same
time. The observers appear to be a
family group, with members ranging in age from a small child
to an adult. Also in the room are
other non-computer artifacts, posters that have been pinned up
on the walls; in the picture it isn’t
obvious what relation the posters have to the computer exhibits,
but interviews with the students
indicate that although only some projects have computer
exhibits, all projects have a physical
poster display.
The photo also displays various science fair artifacts. A science
fair artifact is any resource
that appears to play an important role in the task; it might be a
computer program or data file, a
poster, a registration or evaluation form, even a display stand.
In some cases, these artifacts will
be documented by videotapes or photographs; in other cases,
the observation team will need to ask
specifically for copies of relevant documents or other tools, or
will simply make notes describing
31. the object.
A process question for workplace studies concerns the amount
of data to collect — how
many visits and to how many different sites? Clearly this
depends on the project’s scope, with
larger projects needing more analysis. As a rule of thumb, we
recommend that you collect at least
one set of observations and/or interview for each stakeholder
group from your CATWOE analysis.
For the VSF project, this means analyzing the science fair
activities and perspectives of students,
teachers, community members (including parents), and school
administration.
Summarizing Workplace Data
The field observations and interviews should increase the
project team’s understanding of
the backgrounds, expectations, and preferences of the
stakeholders with respect to the technology
that might be introduced into their workplace. The relevant
data will have been obtained from a
variety of sources: surveys or questionnaires administered in
advance or after a visit, comments
and behaviors of individuals, interviews, or public records of
population characteristics. These
DRAFT: PLEASE DO NOT CITE OR CIRCULATE WITHOUT
PERMISSION
SBUE—Chapter 3 14
32. data should be compiled to develop user profiles that will guide
subsequent scenario development.
A sample set of profiles for the VSF stakeholders appears in
Table 3.3.
VSF Stakeholder User Characteristics
Students Background : mixture of experience with computing
applications, ranging
from extensive use of computer games and several years of
programming to
minimal keyboarding skills and basic use of office applications.
Moderate to
extensive experience with Web browsing, email, and Internet
chat.
Expectations: an online system should make construction of
the exhibit easier
and more fun. Likely to see the system as a variant of other
(e.g., Web-based)
hypermedia systems.
Preferences: Most comfortable with PC-Windows platform,
from either
school or home setting. Enjoy multimedia systems, even when
slow over a
phone line or other low band-width connection.
Community members Background : Bi-modal distribution with
a few members having extensive
computing experience through the work environment, and others
with only
modest (or no) exposure to email and a few Web applications.
Many have
visited their children’s exhibits (not always science) in the past.
33. Expectations: Many are unsure about how if at all they would
contribute to
creating a project, but able to imagine browsing exhibits online.
No thoughts
about encountering or talking to others while browsing the
exhibits.
Preferences: those with background are comfortable with
AOL and similar ISP
environments, generally on PC-Windows platform. Less
patience than
students for “fancy” graphics or multimedia. Want guides or
help screens to
work through new applications or services; willing to read
manuals.
Teachers Background : most are familiar with a range of
computer applications, both
Web-based browsing and discussion systems, as well as
specialized courseware.
A few have basic programming skills; most able to author
documents in
HTML and other hypermedia systems like PowerPoint.
Expectations: online system will allow them to draw in other
experts to guide
students in projects, decreasing the general need for teacher-
student interaction,
allowing them to focus on special needs. Most expect Web-
based authoring
and browsing combined with email discussions with outside
experts.
Preferences: Mixture of PC and Mac users. Strong concerns
about access
34. rights and about ability to get overview information. Willing to
work from
online or written guides or reference material. Want example
(starter) projects.
School administrators Background : Familiar with Web-
browsing, email, and standard office
applications, especially word-processing and spreadsheet
functions.
Expectations: online system will increase visibility of
science fair, create
better connections between the school and the community.
Emphasis will be
on conveying to community the interesting things that students
are doing.
Like teachers, expect such a system to involve combination of
Web and email.
Preferences: Mixture of PC and Mac users. Concerned that
system is state-of-
the-art and attractive; will want to print colorful examples and
summaries of
the online materials to share with community groups and
agencies.
Table 3.3: Stakeholder Profiles for the VSF
DRAFT: PLEASE DO NOT CITE OR CIRCULATE WITHOUT
PERMISSION
SBUE—Chapter 3 15
Carroll
35. A second summary should be prepared for tasks that were
observed or discussed. To do
this, the team can begin with a list of tasks relevant to each
stakeholder. For particularly complex
or problematic tasks, it may be useful to develop a hierar chical
task analysis to represent
documenting a finer level of detail. A summary of the tasks of
VSF stakeholders is in Table 3.4,
with examples of hierarchical task analysis in Figure 3.4
(Figure 3.4a shows exhibit construction,
Figure 3.4b shows exhibit judging).
VSF Stakeholder Science Fair Tasks Observed or Discussed
Students Reviewing participation requirements; Proposing a
project; Carrying out the
project; Constructing an exhibit; Demonstrating the project
Community members Browsing projects at a fair; Interacting
with students at their exhibits
Community members
acting as judges
Volunteering to be a judge; Studying the evaluation form;
Evaluating a
specific project; Developing and reporting summary results
Teachers Helping a student refine a proposal project; Providing
pointers to resources and
other information; Critiquing a student’s project in progress;
Helping a student
create an exhibit
School administrators Recruiting volunteers to judge projects;
36. Summarizing participation in fair;
Highlighting winning projects in annual report; Specifying
resources needed
for next year’s fair; Acknowledging student and judge
participation
Table 3.4: Science Fair Tasks Carried out by Stakeholders
In addition to field notes and interview data, the requi rements
team may have collected task
artifacts—data files, forms, software, brochures, and so on.
These artifacts can help to document
the information needs of the tasks they serve. A form used to
purchase something indicates what
information is needed to specify the product, the buyer, the
form of payment, and so on. A poster
used to advertise an event shows what features of an event are
important to the intended audience.
The labels on file folders suggest categorical information that is
used to organize task materials.
Each artifact collected should be examined for such insights.
Figure 3.5 shows two artifacts from
a science fair, a publicity poster and a judging form.
Other artifacts from this domain might include the registration
form used by students to
enter their projects, newspaper notices recruiting volunteers to
serve as judges and later
announcing the winners, the instructions provided to judges and
to student exhibitors, the exhibits
themselves, the prize ribbons, even the thank-you notes sent by
fair organizers to the volunteers
helping to set up and judge the exhibits. The role of task
artifacts in current practice can be
summarized as shown in Table 3.5 for the poster and the
judging form — both the information
37. needs and the science fair procedures implied by these two
documents have been listed. From the
publicity perspective, we assume that the poster emphasizes
what the organizers believes are the
most important characteristics of the event to possible
attendees. From the perspective of exhibit
evaluation, the judges’ form likewise highlights the
characteristics thought to determine the quality
of the exhibits. Note that the insights garnered by studying
these artifacts may or may not match
those obtained through interviews or observations; as noted in
the section on Understanding
DRAFT: PLEASE DO NOT CITE OR CIRCULATE WITHOUT
PERMISSION
SBUE—Chapter 3 16
Figure 3.4a: Hierarchical task analysis for constructing an
exhibit.
0. Construct exhibit
1. Analyze project content 2. Develop an exhibit plan 3. Lay
out exhibit elements
3.1 Center title and
abstracts at top of
display space
3.2 Position
38. graphical and
physical elements
3.3 Place summary
and sources at
lower right
1.1 List elements
of overall project
structure
1.2 Summarize
exhibit content for
each element
2.1 Assess exhibit
space available
2.2 Write title, credits
and abstract
2.3 Develop effective
visual components
2.4 Develop
explanatory text
plan 0: do 1 - 3, with iteration as necessary
plan 1: do 1.1 , then do 1.2
2.3.1 Collect
39. key data
graphs or
charts
2.3.2 Collect
photos or
videos of
apparatus
2.3.3 Collect
relevant
physical
models
2.3.4 Select
elements
with greatest
impact
plan 2: do 2.1 - 2.2, then
interleave 2.3 - 2.4 until done
plan 2.3: do 2.3.1 - 2.3.3 as
relevant, do 2.3.4 , then do
2.3.5 iteratively until done
2.3.5 Develop
caption for
each graphic
or model
2.4.1 Write a
summary and
40. conclusions
2.4.2 List
bibliography
and other
sources
plan 2.34
do 2.4.1 - 2.4.2
3.4.1 Place
captions near
associated
visuals
3.4.2 Insert
additional
explanatory
text
3.4 Interleave
supporting textual
material
plan 3.4:
do 3.4.1 then 3.4.2
plan 3: do 3..1
DRAFT: PLEASE DO NOT CITE OR CIRCULATE WITHOUT
41. PERMISSION
SBUE—Chapter 3 17
Figure 3.4b: Hierarchical task analysis for judging an exhibit.
0. Judge an exhibit
1. Browse exhibit structure 2. Study exhibit in detail 4.
Complete judging report
4.1 Award points
for significance of
problem studied
4.3 Award points
for quality of project
presentation
1.1 Read
project title and
abstract
1.2 Scan visual
and physical
elements
2.1 Read captions
and study details
of visual elements
42. 2.2 Examine and
manipulate physical
models
2.3 Identify and follow
logic of scientific
methods used
2.4 Analyze conclusions
with respect to
methods and results
plan 0: do 1 - 4
plan 1: do 1.1 - 1.3
4.4 Review, sign
and submit project
evaluation form
plan 4.3: do
4.3.1 - 4.3.3 together
plan 3: do
3.1 - 3.5
3. Interview exhibit author
1.3 Skim
conclusions and
bibliography
43. 3.1 Listen to
project
summary
3.2 Probe
problem
understanding
3.3 Probe use of
scientific method
3.4 Ask about
alternative
interpretations
3.5 Complement
content and
presentation
4.2 Award points
for quality of project
content
4.2.1 Award
points for method
soundness
4.2.2 Award
points for
originality
44. 4.2.3 Award
points for overall
coherence
4.2.4 Award
points for use of
resources
4.3.1 Award
points for visual
details
4.3.2 Award
points for
supporting text
plan 4: do 4.1 - 4.3
together, then do 4.4
plan 2: do 2.1 - 2.4
together
plan 4.2: do
4.2.1 - 4.2.4 together
4.3.3 Award
points for
layout
45. DRAFT: PLEASE DO NOT CITE OR CIRCULATE WITHOUT
PERMISSION
SBUE—Chapter 3 18
Users, much of what participants know or experience in a
situation is based on tacit knowledge, or
is the result of other stakeholders’ views and concerns.
Figure 3.5: Sample artifacts from a science fair.
Science Fair
Artifact
Implied Information Needs and Procedures
Fair publicity poster Information: When and where fair is
held; sponsoring organization; time when
winning exhibits announced; sample projects; contact
information
Procedures: fair lasts about 2 hours; judging takes about 1.5
hours; projects take
up to 6 months to complete; exhibits are entered and judged in
three age-level
groupings
Judging form Information: judging may be age-level specific;
exhibits are judged on three major
dimensions; quality is a complex judgement broken into sub-
categories; Ms.
Czerny is the head judge who compiles the separate results
Procedures: personal contact with students helps to assess
46. project significance and
quality; exhibits are judged in about 15 minutes; forms are not
to be submitted
until all judging is completed
Table 3.5: Information and Procedures implied by Poster and
Judges’ Form
The analysis of stakeholder groups, tasks, and artifacts, focuses
on individual elements of
the current situation. This helps a team organize their
observations, but can also direct attention
away from the social context in which the activities take place,
the network of interdependencies
DRAFT: PLEASE DO NOT CITE OR CIRCULATE WITHOUT
PERMISSION
SBUE—Chapter 3 19
among stakeholders and their roles in the workplace. One way
to summarize this is to create a
stakeholder diagram that conveys how the stakeholders are
interdependent on one another. Figure
3.6 presents such a diagram for the science fair. For example,
we see that one role of students in
the science fair is to create projects that community members
will browse and perhaps judge.
These relationships can then be analyzed to understand the
impact one group of participants has on
others. For instance the number of projects developed for the
fair will have an impact on the
47. community members who judge the exhibits — perhaps
affecting how many judges will be
needed, as well as the challenge and satisfaction of the
evaluation process.
Another technique for grasping the big picture is to collect
together related observations or
problems into a set of workplace themes. Different
stakeholders will focus on different aspects of
the current situation (e.g., based on their particular motivations
or backgrounds), but issues raised
by different stakeholders (or at different times by the same
stakeholder) will be related. To find a
useful set of themes, write interesting comments or observations
on index cards or post-it notes,
and then carry out a collaborative grouping exercise where team
members search for related points.
In some cases an issue will fit in more than one category; this
is fine, simply make some indication
that multiple copies have been made. Once a theme has been
suggested, test its usefulness by
trying to name it — if you find yourself with too many
“Miscellaneous” or “Other Problems”
groups, your work is not done yet! Beyers and Holtzblatt
(1998) use such techniques extensively
to create affinity diagrams, which are then reviewed, discussed,
and elaborated with participating
stakeholders. Figure 3.7 shows some themes identified in
analysis of current science fairs.
Figure 3.6: Roles and relations of stakeholders in science fair.
Student
exhibitors
Teachers
48. Community
members
School
administration
advertise fair to
browse exhibits of;
(may) judge exhibits of
provide resources to;
summarize results of;
acknowledge
participation by
recruit volunteers from;
acknowledge participation by
create projects for viewing by;
guide activities of
interact with
DRAFT: PLEASE DO NOT CITE OR CIRCULATE WITHOUT
PERMISSION
SBUE—Chapter 3 20
49. Figure 3.7: Themes summarizing issues raised in science fair
study.
Developing Requirements Scenarios
User, task, artifact, roles, and theme analyses are the
scaffolding from which requirements
scenarios are synthesized. The goal of requirements scenarios
is to express — in a condense and
evocative fashion — the key understandings that the team has
gained about the workplace. Other
members of the development team (e.g., software engineers)
should be able to read the scenarios
and appreciate many of the work-related issues that your
analysis has uncovered. Look across the
perspectives generated by the user, task, artifact, and social foci
and extract the issues that have the
strongest implications (either opportunities or constraints) for
design. Weave these issues together
to build illustrative episodes of current practice.
Exhibit Construction Exhibit Judging Fair Attendance
Often must combine
work done at home
and at school or in
special facilities
Some projects must
crowds in all the
visuals, others end
up with extra space
Dynamic elements
50. (e.g. videos) hard to
set up and manage
Limiting the time
for judging leads to
rushing and feelings
of stress
Hard to compare
exhibits separated
by more than a few
feet
Manual compilation
of final results is
tedious and error-
prone
Difficult to get the
word out to people
who are not parents
of students
Evening exhibit
hours compete with
other family events
or obligations
DRAFT: PLEASE DO NOT CITE OR CIRCULATE WITHOUT
PERMISSION
SBUE—Chapter 3 21
51. Requirements Scenarios from the Science Fair
1) Ms. Smith helps Jeff plan his exhibit on heat transfer.
Ms. Smith worked late on Monday evening so she’d have time
to on Tuesday with Jeff, one of her top
physics students, to help him plan his science fair exhibit.
When she got to the lab, Jeff was already
there and had blocked off a 6-foot rectangle on a lab table,
simulating the space he’d get at the gym. He
also had brought a sample poster board to use in laying out the
three walls of the exhibit. They spent the
first 20 minutes just listing possible project elements. Ms.
Smith was impressed with the range of
content Jeff had developed, including an extensive list of URLs
on heat transfer, several charts graphing
the effects of three different window coatings, and an
Authorware simulation of heat diffusion. This last
piece of the project concerned her, as last year there had been
no computer hook-ups in the gym. But as
usual, Jeff had already checked into this, and had gotten special
permission to have this in his display, as
long as he took responsibility for the set-up. As Ms. Smith
checked through the visuals, she noticed that
the captions for the color charts used a different font than those
for the black-and-white drawings of his
apparatus; Jeff explained that he had printed the former on his
personal color printer at home, which has a
different font set. Ms. Smith knew that the judges would notice
even details like this, so she advised him
to re-print the black-and-white drawings at home. They spent
the rest of the time selecting and laying out
the visuals that would make best use of the limited space.
2) .Mrs Sampson decides to go to the science fair.
52. Mrs. Sampson’s neighbor Jeff was in the science fair for the
third time this year, and she really wanted to
go, especially now that her seventh-grade daughter Erin seemed
to be developing an interest in science.
Jeff had mentioned the fair date, but she had forgotten about it
until she saw the poster at Kroger’s She
mentioned her plan to her husband, who immediately reminded
her that this overlaps with Billy’s
basketball game. They agreed to split their time that evening.
On the night of the fair, her 5-year-old
Christie decided she’d rather go with Mom than Dad and Billy,
so the three of them headed off. But as
soon as they got in the car, Christie started complaining that she
never gets to do anything special on her
own. Mrs. Sampson and Erin ignored her as much as they
could, and started talking about who else
might be exhibiting projects.
3) Jeff demonstrates his exhibit to Mrs. Sampson and her two
daughters.
When the Sampsons arrived at the fair, there were only a few
other people around. They saw their
neighbors, Jeff’s parents, and a few other people they didn’t
recognize. Jeff’s Mom chatted with them
briefly, asking about Erin’s summer plans, then summarizing
some highlights of exhibits she’d seen so
far. The Sampsons began browsing, starting on the right-hand
side and working their way around, mostly
just looking quickly and moving on, so they’d have time to see
as much as possible. When they got to
Jeff’s exhibit, they stopped to talk to him, and he gave them his
overview. Erin was very interested in
his charts, and wanted to know just how he had gotten the data
and graphed it, but Christie quickly
53. became bored and started poking around at the computer on the
table. Mrs. Sampson saw the list of
URLs and thought Christie might want to look into them, so
started copying them down; when Jeff saw
this, he offered to print them out later and give her a copy.
After the overview, Jeff started to show them
the animation, but found that Christie had managed to crash the
computer. While they were waiting for it
to re-boot, Christie wondered whether there were any other
exhibits related to heat transfer or building
construction, but Jeff hadn’t had time to look around, so didn’t
know.
DRAFT: PLEASE DO NOT CITE OR CIRCULATE WITHOUT
PERMISSION
SBUE—Chapter 3 22
4) Alisa judges the high school physics projects at the science
fair.
For the last three years, Alisa—a retired civil engineer—has
been a judge at the county science fair, so
when the organizers contacted her, she readily agreed to do it
again. In past years, she had occasionally
been able to get advance information about the projects
assigned to her, but this year the organizers had
collected only titles and authors in advance. As in the past, she
saw that she’d been given the high school
physics projects, and knew she’d have to work fast to get all
five evaluated in the 90 minutes allotted.
On the night of the fair, Alisa arrived promptly at 7pm, picked
54. up her forms and began the process of
studying the exhibits and interviewing the students. Her
previous experience helped her to make the
points assignment judgements, but as usual she found it hard to
compare projects even within her set of
five. At one point, she found she needed to evaluate two very
nice projects in parallel, running back and
forth comparing the details of the visuals and models, and
annotating her scores with relative
comparisons. She finally signed her forms and handed them
in—she could tell she was almost the last to
finish from the large stack of papers Ms. Czerny and her
assistants were already compiling.
5) Superintendent Carlisle reports on th 1999 science fair to
the school board.
School superintendent Mark Carlisle had heard wonderful
reports about this year’s science fair, so he
decided to highlight it in next month’s school board meeting.
He wanted to do more than acknowledge
the winners and the volunteers—he hoped that by giving the
school board examples of the great work the
students had done, he could make a case for increasing the
resources allotted for extra-curricular activities
such as this. He contacted Ms. Czerny, and asked her to collect
sample materials from the best projects,
so that he could construct a slide presentation. She and a
colleague spent the next two weeks tracking
down the winning authors and finding high quality visuals.
Carlisle then cycled through these to find just
the few that he could include in his 10 minute presentation, but
he brought paper copies of many others
in case the school board was interested. He highlighted Jeff’s
exhibit, noting that he had set up his own
computer for demonstration, and pointing to several other
55. exhibits that would have been much enhanced
by such technology. Though the pitch was well-received, by
the time that budget discussions took place
the board members had forgotten many details and were
reluctant to increase the funds for technology
support of events like the science fair.
Table 3.6: Requirements Scenarios from the Science Fair
Analysis
Scenario writing is a creative act involving judgment and the
integration of multiple issues.
A scenario may narrate the experiences of several stakeholders
if collaborative activity is involved,
or it may focus on an individual. The scope of a scenario is
meaningful activity; every scenario
should be motivated by and contribute to the overall work
context. Begin with one scenario for
each stakeholder, focusing on a central (or particularly
problematic) activity for that group.
Develop a scenario around this activity, using the themes
analysis to insert an overall “message”,
and then elaborate with issues raised by artifact analysis, role
relationships, and so on. Some
issues will fit naturally into many scenarios, suggesting an
overarching concern to address in
design. After developing one scenario for each stakeholder,
review your workplace analyses and
find issues not yet covered. Are any remaining issues important
enough to add into an existing
scenario or create a new one? If so, continue to elaborate the
set. If it is possible, invite your
stakeholders to participate in scenario construction, review, or
elaboration. In the end, not all
issues will be covered by the scenario set, but the important
ones will be. Table 3.6 lists some
56. requirements scenarios generated for the science fair problem.
DRAFT: PLEASE DO NOT CITE OR CIRCULATE WITHOUT
PERMISSION
SBUE—Chapter 3 23
on and John M. Carroll
Several points are worth noting about these scenarios. They
deliberately reuse actors and
artifacts (e.g., Jeff and his exhibit, the head judge). This adds
to the overall coherence of the
scenario set: the analysis of Jeff’s project that is appropriate
for the exhibiting scenario must also
make sense in the context of the planning, mentoring, judging,
and archiving activities. It also
encourages a more expansive analysis of the people and
artifacts in the domain, by considering
their contributions to more than one high-level activity. Of
course, this comes with a cost of not
illustrating the contributions of contrasting people and
artifacts—perhaps a student who wants a
computer demonstration but is unable to set it up, or a judge
who had no prior experience and was
unable to complete her work on time. It is in this sense that
requirements scenarios should be seen
as only as an illustrative set of “stakes in the ground”. They are
suggestive, not exhaustive.
The scenarios also include details about participants’ real world
situations that do not
contribute to the science fair activity itself. It is important to
express concretely who the actors are
57. and to convey the many forces that are influencing their
behavior in the situation. The teacher
helping Jeff is very busy; this is typical but has nothing to do
with the science fair itself. Mrs.
Sampson’s family life, her problems with her young daughter,
have no direct impact on the fair or
its operation. However, these details provide bits of context
that help the analyst think about these
actors’ motivations and experience. Specific details like these
also encourage analysts to think
about other situations in which different factors are in play, for
example a case where Jeff’s
neighbor lives alone and has no other obligations. This is one
of the important benefits of writing
and sharing scenarios in requirements analysis.
Analyzing a Scenario’s Claims
Writing a scenario is a creative act, but it is an act that is
informed by many things. The
studies of the workplace educate the requirements team, and
scenario creation enables the team to
synthesize and express their new knowledge. Implicit in these
analysis and design activities are the
tradeoffs present in the problem situation — features that can be
understood to have both positive
and negative consequences for use. These tradeoffs may not be
directly conveyed in the
requirements scenarios, but taking the time to consider them can
help you begin to reason about
how you might transform the current situation. In general the
design goal will be to increase (or
add new) positive consequences and to decrease (or remove)
negative consequences.
SBUE employs claims analysis to reason about tradeoffs in
58. observed or imagined usage
situations. Analyzing a claim begins with the identification of
an “interesting feature” of a
scenario, some aspect of an activity that seems to have one or
more important impacts on task
participants. Because we are interested primarily in information
technology, we tend to focus on
features of work-related artifacts, particularly artifacts that are
or could be computer-based.
Example features from the science fair artifacts might include
the size of the space allotted for
individual exhibits, the physical lay-out of exhibits in the hall,
or the science fair information
advertized on the poster.
DRAFT: PLEASE DO NOT CITE OR CIRCULATE WITHOUT
PERMISSION
SBUE—Chapter 3 24
Scenario Feature P o s s i b l e U p s i d e s ( + ) o r D o w n
s i d e s ( - ) o f t h e F e a t u r e
The fixed area allotted to
each project exhibit
(from Scenarios 1 & 3)
+ constrains the complexity of individual exhibits
+ simplifies planning and layout of the total space available
59. + creates a grid that can organize browsing and judging
activities
- but many exhibits will have genuinely different needs for
space
- but too regular a grid may make the layout seem routine and
boring
- but physical constraints will limit the grouping possibilities
for related
exhibits
The date, time, and
location advertized on
the science fair poster
(from Scenario 2)
+ makes the event seem more concrete (tied to a specific place
and point in
time)
+ sets clear boundaries on students’ exhibition responsibilities
+ enables planned or opportunistic simultaneous visitors
- but may lead some to skip the fair due to competition with
other events
Handwritten judges’
forms
(from Scenario 4)
+ are a familiar technology for recording information and
60. decisions
+ support personalized handwritten annotations and
qualifications
+ offer a natural authentication function (i.e., by signature)
- but may be hard to modify in response to unexpected issues or
characteristics
- but will lead to significant paper-processing requirements at
the end of
judging
Physical exhibits
(from Scenarios 1, 3, &
5)
+ encourage the use of many diverse exhibit elements
+ allow for direct interaction and engagement by visitors and
judges
- but abstract or dynamic elements may be difficult to express
in physical
form
- but large physical elements may be difficult to construct or
display
- but physical exhibits may be difficult to archive, transport,
copy, or share
Table 3.7: Claims from the Science Fair Requirements
Scenarios
61. The second piece of claims analysis is hypothesizing the
consequences a feature has for the
stakeholder(s) in the scenario. How does the feature make the
activity easier? Harder? More or
less pleasant or satisfying? Some consequences will be readily
apparent in a scenario as written.
Sometimes a set of consequences can be seen in different
scenarios touching on the same feature of
the workplace. Some may not be part of a scenario at first but
are added as an elaboration after
thinking about some other scenario. Yet others will be part of
some other story, a scenario version
where things work out a bit differently than imagined. These
are the hardest consequences to
realize, but are critical to include. They reflect a kind of “what
if” reasoning about the situation that
expands the scope of the analysis as well as encouraging
analysts to look ahead to situations that a
new system might support.
An important feature of claims analysis is that both positive and
negative consequences
(informally termed the “upsides” and “downsides”) are
considered. When examining a current
situation, it is easy to focus on just the problems imposed by
current technology; later on, when
analyzing the impact of new technology, it will be easy to focus
on just the advantages provided by the
DRAFT: PLEASE DO NOT CITE OR CIRCULATE WITHOUT
PERMISSION
SBUE—Chapter 3 25
62. new system. However we cannot emphasize enough that all
design involves tradeoffs—you rarely get
something for nothing. By imposing the discipline of
documenting upsides and downsides for every
claim, you’ll be more likely to understand and address both
sides of a design issue.
Table 3.7 summarizes claims analyzed for several VSF
requirements scenarios. Each claim
considers a range of possible positive and negative
consequences of a feature impacting one or
more scenarios. Some consequences are evident in the
narratives as written: Jeff and his teacher
are well-aware of the constraints of the exhibit space; Alisa is
able to annotate her form with notes
concerning the two projects of similar quality; the Sampson
family is clearly engaged by the
physical characteristics of Jeff’s exhibit. Other consequences
emerge from what-if reasoning
inspired by these scenarios: Jeff is able to select project
elements that fit into the space allowed,
but some students may find they must leave out interesting
elements; the 2-hour time period of the
fair tells the Sampsons when to visit, and at the same time puts
well-defined boundaries on the
responsibilities of student authors managing their own busy
schedules; Ms. Czerny was able to
collect a nice set of samples for the superintendent’s
presentation, but some projects might not have
been saved in a form suitable for this purpose. In this sense, a
claims analysis allows a
requirements analysts to point to scenario elaborations without
developing the corresponding
63. narratives. More importantly, it documents the analysts’
conclusions about tradeoffs in the current
situation that should be addressed by the new design.
Scenarios and Claims as Requirements
In what sense do scenarios and claims convey requirements?
Clearly a set of requirements
scenarios is not a specification. It captures insights gleaned
about the current situation.
Subsequent design reasoning will develop a response to this
analysis, creating and refining a
design specification that is eventually implemented as the final
system. The requirements
expressed by the scenarios relate to the needs and possibilities
suggested by analysis of current
practice: The scenarios narrate instances of typical or critical
goals and activities. Specific features
of these activities are seen to have impact, and associated
claims analyses articulate what might be
good or bad about such features. The implicit assumption is
that the design process will respond
to these needs and possibilities, hopefully maintaining or
improving on the positive characteristics
and diminishing or removing the negative.
This textbook deliberately presents a simplified view of SBUE.
In practice analysis and
design will take place in a tightly interleaved fashion: As soon
as requirements analysts recognize a
problem in the current situation, they will begin to develop
possible design approaches to solving
the problem. There is some evidence of this in the VSF
examples, because the analysis focused
almost immediately on the problems and opportunities most
likely to be influenced by online
64. activities (e.g., eliminating scheduling and space constraints).
At the same time, because the entire
process is iterative, we know that the scenarios and claims
developed as the result of this initial
requriements analysis are only a first pass at understanding the
problem. The development of
requirements will continue as design ideas emerge and are
considered through new scenarios and
tradeoff analyses.
Graphs over Time: Densification Laws, Shrinking
Diameters and Possible Explanations
Jure Leskovec
Carnegie Mellon University
[email protected]
Jon Kleinberg
∗
Cornell University
[email protected]
Christos Faloutsos
Carnegie Mellon University
[email protected]
ABSTRACT
How do real graphs evolve over time? What are “normal”
growth patterns in social, technological, and information
networks? Many studies have discovered patterns in static
graphs, identifying properties in a single snapshot of a large
network, or in a very small number of snapshots; these in-
65. clude heavy tails for in- and out-degree distributions, com-
munities, small-world phenomena, and others. However,
given the lack of information about network evolution over
long periods, it has been hard to convert these findings into
statements about trends over time.
Here we study a wide range of real graphs, and we observe
some surprising phenomena. First, most of these graphs
densify over time, with the number of edges growing super-
linearly in the number of nodes. Second, the average dis-
tance between nodes often shrinks over time, in contrast
to the conventional wisdom that such distance parameters
should increase slowly as a function of the number of nodes
(like O(log n) or O(log(log n)).
Existing graph generation models do not exhibit these
types of behavior, even at a qualitative level. We provide a
new graph generator, based on a “forest fire” spreading pro-
cess, that has a simple, intuitive justification, requires very
few parameters (like the “flammability” of nodes), and pro-
Work partially supported by the National Science Founda-
tion under Grants No. IIS-0209107, SENSOR-0329549, IIS-
0326322, CNS-0433540, CCF-0325453, IIS-0329064, CNS-
0403340, CCR-0122581, a David and Lucile Packard Foun-
dation Fellowship, and also by the Pennsylvania Infrastruc-
ture Technology Alliance (PITA), a partnership of Carnegie
Mellon, Lehigh University and the Commonwealth of Penn-
sylvania’s Department of Community and Economic Devel-
opment (DCED). Any opinions, findings, and conclusions
or recommendations expressed in this material are those of
the author(s) and do not necessarily reflect the views of the
National Science Foundation, or other funding parties.∗ This
research was done while on sabbatical leave at CMU.
Permission to make digital or hard copies of all or part of this
66. work for
personal or classroom use is granted without fee provided that
copies are
not made or distributed for profit or commercial advantage and
that copies
bear this notice and the full citation on the first page. To copy
otherwise, to
republish, to post on servers or to redistribute to lists, requires
prior specific
permission and/or a fee.
KDD’05, August 21–24, 2005, Chicago, Illinois, USA.
Copyright 2005 ACM 1-59593-135-X/05/0008 ...$5.00.
duces graphs exhibiting the full range of properties observed
both in prior work and in the present study.
Categories and Subject Descriptors
H.2.8 [Database Management]: Database Applications –
Data Mining
General Terms
Measurement, Theory
Keywords
densification power laws, graph generators, graph mining,
heavy-tailed distributions, small-world phenomena
1. INTRODUCTION
In recent years, there has been considerable interest in
graph structures arising in technological, sociological, and
scientific settings: computer networks (routers or autonomous
systems connected together); networks of users exchanging
e-mail or instant messages; citation networks and hyperlink
networks; social networks (who-trusts-whom, who-talks-to-
whom, and so forth); and countless more [24]. The study
67. of such networks has proceeded along two related tracks:
the measurement of large network datasets, and the devel-
opment of random graph models that approximate the ob-
served properties.
Many of the properties of interest in these studies are
based on two fundamental parameters: the nodes’ degrees
(i.e., the number of edges incident to each node), and the
distances between pairs of nodes (as measured by shortest-
path length). The node-to-node distances are often studied
in terms of the diameter — the maximum distance — and
a set of closely related but more robust quantities including
the average distance among pairs and the effective diameter
(the 90th percentile distance, a smoothed form of which we
use for our studies).
Almost all large real-world networks evolve over time by
the addition and deletion of nodes and edges. Most of the
recent models of network evolution capture the growth pro-
cess in a way that incorporates two pieces of “conventional
wisdom:”
(A) Constant average degree assumption: The average node
degree in the network remains constant over time. (Or
equivalently, the number of edges grows linearly in the
number of nodes.)
(B) Slowly growing diameter assumption: The diameter is
a slowly growing function of the network size, as in
“small world” graphs [4, 7, 22, 30].
For example, the intensively-studied preferential attach-
ment model [3, 24] posits a network in which each new node,
when it arrives, attaches to the existing network by a con-
68. stant number of out-links, according to a “rich-get-richer”
rule. Recent work has given tight asymptotic bounds on the
diameter of preferential attachment networks [6, 9]; depend-
ing on the precise model, these bounds grow logarithmically
or even slower than logarithmically in the number of nodes.
How are assumptions (A) and (B) reflected in data on net-
work growth? Empirical studies of large networks to date
have mainly focused on static graphs, identifying properties
of a single snapshot or a very small number of snapshots
of a large network. For example, despite the intense inter -
est in the Web’s link structure, the recent work of Ntoulas
et al. [25] noted the lack of prior empirical research on the
evolution of the Web. Thus, while one can assert based
on these studies that, qualitatively, real networks have rela-
tively small average node degrees and diameters, it has not
been clear how to convert these into statements about trends
over time.
The present work: Densification laws and shrinking
diameters. Here we study a range of different networks,
from several domains, and we focus specifically on the way in
which fundamental network properties vary with time. We
find, based on the growth patterns of these networks, that
principles (A) and (B) need to be reassessed. Specifically,
we show the following for a broad range of networks across
diverse domains.
(A′) Empirical observation: Densification power laws: The
networks are becoming denser over time, with the av-
erage degree increasing (and hence with the number of
edges growing super-linearly in the number of nodes).
Moreover, the densification follows a power-law pat-
tern.
(B′) Empirical observation: Shrinking diameters: The ef-
69. fective diameter is, in many cases, actually decreasing
as the network grows.
We view the second of these findings as particularly surpris-
ing: Rather than shedding light on the long-running debate
over exactly how slowly the graph diameter grows as a func-
tion of the number of nodes, it suggests a need to revisit
standard models so as to produce graphs in which the ef-
fective diameter is capable of actually shrinking over time.
We also note that, while densification and decreasing diam-
eters are properties that are intuitively consistent with one
another (and are both borne out in the datasets we study),
they are qualitatively distinct in the sense that it is possi -
ble to construct examples of graphs evolving over time that
exhibit one of these properties but not the other.
We can further sharpen the quantitative aspects of these
findings. In particular, the densification of these graphs,
as suggested by (A′), is not arbitrary; we find that as the
graphs evolve over time, they follow a version of the relation
e(t) ∝ n(t)a (1)
where e(t) and n(t) denote the number of edges and nodes
of the graph at time t, and a is an exponent that generally
lies strictly between 1 and 2. We refer to such a relation as
a densification power law, or growth power law. (Exponent
a = 1 corresponds to constant average degree over time,
while a = 2 corresponds to an extremely dense graph where
each node has, on average, edges to a constant fraction of
all nodes.)
What underlying process causes a graph to systematically
densify, with a fixed exponent as in Equation (1), and to
experience a decrease in effective diameter even as its size
increases? This question motivates the second main contri -
70. bution of this work: we present two families of probabilistic
generative models for graphs that capture aspects of these
properties. The first model, which we refer to as Community
Guided Attachment (CGA), argues that graph densification
can have a simple underlying basis; it is based on a decom-
position of the nodes into a nested set of communities, such
that the difficulty of forming links between communities in-
creases with the community size. For this model, we obtain
rigorous results showing that a natural tunable parameter
in the model can lead to a densification power law with
any desired exponent a. The second model, which is more
sophisticated, exhibits both densification and a decreasing
effective diameter as it grows. This model, which we refer to
as the Forest Fire Model, is based on having new nodes at-
tach to the network by “burning” through existing edges in
epidemic fashion. The mathematical analysis of this model
appears to lead to novel questions about random graphs that
are quite complex, but through simulation we find that for
a range of parameter values the model exhibits realistic be-
havior in densification, distances, and degree distributions.
It is thus the first model, to our knowledge, that exhibits
this full set of desired properties.
Accurate properties of network growth, together with mod-
els supporting them, have implications in several contexts.
• Graph generation: Our findings form means for as-
sessing the quality of graph generators. Synthetic graphs are
important for ‘what if’ scenarios, for extrapolations, and for
simulations, when real graphs are impossible to collect (like,
e.g., a very large friendship graph between people).
• Graph sampling: Datasets consisting of huge real-
world graphs are increasingly available, with sizes ranging
from the millions to billions of nodes. There are many known
algorithms to compute interesting measures ( shortest paths,
71. centrality, betweenness, etc), but most of these algorithms
become impractical for the largest of these graphs. Thus
sampling is essential — but sampling from a graph is a non-
trivial problem. Densification laws can help discard bad
sampling methods, by providing means to reject sampled
subgraphs.
• Extrapolations: For several real graphs, we have a
lot of snapshots of their past. What can we say about their
future? Our results help form a basis for validating scenarios
for graph evolution.
• Abnormality detection and computer network man-
agement: In many network settings, “normal” behavior will
produce subgraphs that obey densification laws (with a pre-
dictable exponent) and other properties of network growth.
If we detect activity producing structures that deviate sig-
nificantly from this, we can flag it as an abnormality; this
can potentially help with the detection of e.g. fraud, spam,
or distributed denial of service (DDoS) attacks.
The rest of the paper is organized as follows: Section 2 sur -
veys the related work. Section 3 gives our empirical findings
on real-world networks across diverse domains. Section 4 de-
scribes our proposed models and gives results obtained both
through analysis and simulation. We conclude and discuss
the implications of our findings in Section 5.
2. RELATED WORK
Research over the past few years has identified classes of
properties that many real-world networks obey. One of the
main areas of focus has been on degree power laws, show -
72. ing that the set of node degrees has a heavy-tailed distri-
bution. Such degree distributions have been identified in
phone call graphs [1], the Internet [11], the Web [3, 14, 20],
click-stream data [5] and for a who-trusts-whom social net-
work [8]. Other properties include the “small-world phe-
nomenon,” popularly known as “six degrees of separation”,
which states that real graphs have surprisingly small (aver-
age or effective) diameter (see [4, 6, 7, 9, 17, 22, 30, 31]).
In parallel with empirical studies of large networks, there
has been considerable work on probabilistic models for graph
generation. The discovery of degree power laws led to the
development of random graph models that exhibited such
degree distributions, including the family of models based
on preferential attachment [2, 3, 10] and the related copying
model [18, 19]. See [23, 24] for surveys of this area.
It is important to note the fundamental contrast between
one of our main findings here — that the average number of
out-links per node is growing polynomially in the network
size — and body of work on degree power laws. This earlier
work developed models that almost exclusively used the as-
sumption of node degrees that were bounded by constants
(or at most logarithmic functions) as the network grew; our
findings and associated model challenge this assumption, by
showing that networks across a number of domains are be-
coming denser.
The bulk of prior work on the study of network datasets
has focused on static graphs, identifying patterns in a sin-
gle snapshot, or a small number of network snapshots (see
also the discussion of this point by Ntoulas et al. [25]). Two
exceptions are the very recent work of Katz [16], who in-
dependently discovered densification power laws for citation
networks, and the work of Redner [28], who studied the
evolution of the citation graph of Physical Review over the
73. past century. Katz’s work builds on his earlier research on
power-law relationships between the size and recognition of
professional communities [15]; his work on densification is
focused specifically on citations, and he does not propose a
generative network model to account for the densification
phenomenon, as we do here. Redner’s work focuses on a
range of citation patterns over time that are different from
the network properties we study here.
Our Community Guided Attachment (CGA) model, which
produces densifying graphs, is an example of a hierarchical
graph generation model, in which the linkage probability be-
tween nodes decreases as a function of their relative distance
in the hierarchy [8, 17, 31]. Again, there is a distinction be-
tween the aims of this past work and our model here; where
these earlier network models were seeking to capture proper -
ties of individual snapshots of a graph, we seek to explain a
time evolution process in which one of the fundamental pa-
rameters, the average node degree, is varying as the process
unfolds. Our Forest Fire Model follows the overall frame-
work of earlier graph models in which nodes arrive one at
a time and link into the existing structure; like the copy-
1994 1996 1998 2000 2002
0
5
10
15
20
Year of publication
77. d
e
g
re
e
(c) Autonomous Systems (d) Affiliation network
Figure 1: The average node out-degree over time.
Notice that it increases, in all 4 datasets. That is,
all graphs are densifying.
ing model discussed above, for example, a new node creates
links by consulting the links of existing nodes. However, the
recursive process by which nodes in the Forest Fire Model
creates these links is quite different, leading to the new prop-
erties discussed in the previous section.
3. OBSERVATIONS
We study the temporal evolution of several networks, by
observing snapshots of these networks taken at regularly
spaced points in time. We use datasets from four differ-
ent sources; for each, we have information about the time
when each node was added to the network over a period of
several years — this enables the construction of a snapshot
at any desired point in time. For each of datasets, we find
a version of the densification power law from Equation (1),
e(t) ∝ n(t)a; the exponent a differs across datasets, but
remains remarkably stable over time within each dataset.
We also find that the effective diameter decreases in all the
datasets considered.
The datasets consist of two citation graphs for different
areas in the physics literature, a citation graph for U.S.
78. patents, a graph of the Internet, and five bipartite affiliation
graphs of authors with papers they authored. Overall, then,
we consider 9 different datasets from 4 different sources.
3.1 Densification Laws
Here we describe the datasets we used, and our findings
related to densification. For each graph dataset, we have,
or can generate, several time snapshots, for which we study
the number of nodes n(t) and the number of edges e(t) at
each timestamp t. We denote by n and e the final number
of nodes and edges. We use the term Densification Power
Law plot (or just DPL plot) to refer to the log-log plot of
number of edges e(t) versus number of nodes n(t).
3.1.1 ArXiv citation graph
We first investigate a citation graph provided as part of
the 2003 KDD Cup [12]. The HEP–TH (high energy physics
theory) citation graph from the e-print arXiv covers all the
citations within a dataset of n=29,555 papers with e= 352,807
edges. If a paper i cites paper j, the graph contains a di-
rected edge from i to j. If a paper cites, or is cited by, a
paper outside the dataset, the graph does not contain any
information about this. We refer to this dataset as arXiv.
This data covers papers in the period from January 1993
to April 2003 (124 months). It begins within a few months
of the inception of the arXiv, and thus represents essentially
the complete history of its HEP–TH section. For each month
m (1 ≤ m ≤ 124) we create a citation graph using all papers
published before month m. For each of these graphs, we
plot the number of nodes versus the number of edges on a
79. logarithmic scale and fit a line.
Figure 2(a) shows the DPL plot; the slope is a = 1.68
and corresponds to the exponent in the densification law.
Notice that a is significantly higher than 1, indicating a
large deviation from linear growth. As noted earlier, when
a graph has a > 1, its average degree increases over time.
Figure 1(a) exactly plots the average degree d
̄ over time,
and it is clear that d
̄ increases. This means that the average
length of the bibliographies of papers increases over time.
There is a subtle point here that we elaborate next: With
almost any network dataset, one does not have data reaching
all the way back to the network’s birth (to the extent that
this is a well-defined notion). We refer to this as the problem
of the “missing past.” Due to this, there will be some ef-
fect of increasing out-degree simply because edges will point
to nodes prior to the beginning of the observation period.
We refer to such nodes as phantom nodes, with a similar
definition for phantom edges. In all our datasets, we find
that this effect is relatively minor once we move away from
the beginning of the observation period; on the other hand,
the phenomenon of increasing degree continues through to
the present. For example, in arXiv, nodes over the most
recent years are primarily referencing non-phantom nodes;
we observe a knee in Figure 1(a) in 1997 that appears to
be attributable in large part to the effect of phantom nodes.
(Later, when we consider a graph of the Internet, we will
see a case where comparable properties hold in the absence
of any “missing past” issues.)
We also experimented with a second citation graph, taken
from the HEP–PH section of the arXiv, which is about the
same size as our first arXiv dataset. It exhibits the same
behavior, with the densification exponent a = 1.56. The
plot is omitted for brevity.
80. 3.1.2 Patents citation graph
Next, we consider a U.S. patent dataset maintained by the
National Bureau of Economic Research [13]. The data set
spans 37 years (January 1, 1963 to December 30, 1999), and
includes all the utility patents granted during that period,
totaling n=3,923,922 patents. The citation graph includes
all citations made by patents granted between 1975 and
1999, totaling e=16,522,438 citations. Because the dataset
begins in 1975, it too has a “missing past” issue, but again
the effect of this is minor as one moves away from the first
few years.
We follow the same procedure as with arXiv. For each
year Y from 1975 to 1999, we create a citation network on
patents up to year Y , and give the DPL plot, in Figure 2(b).
As with the arXiv citation network, we observe a high den-
sification exponent, in this case a = 1.66.
10
2
10
3
10
4
10
5
10
2
10
86. (c) Autonomous Systems (d) Affiliation network
Figure 2: Number of edges e(t) versus number of
nodes n(t), in log-log scales, for several graphs. All
4 graphs obey the Densification Power Law, with a
consistently good fit. Slopes: a = 1.68, 1.66, 1.18
and 1.15, respectively.
Figure 1(b) illustrates the increasing out-degree of patents
over time. Note that this plot does not incur any of the
complications of a bounded observation period, since the
patents in the dataset include complete citation lists, and
here we are simply plotting the average size of these as a
function of the year.
3.1.3 Autonomous systems graph
The graph of routers comprising the Internet can be or-
ganized into sub-graphs called Autonomous Systems (AS).
Each AS exchanges traffic flows with some neighbors (peers).
We can construct a communication network of who-talks-to-
whom from the BGP (Border Gateway Protocol) logs.
We use the the Autonomous Systems (AS) dataset from [26].
The dataset contains 735 daily instances which span an in-
terval of 785 days from November 8 1997 to January 2 2000.
In contrast to citation networks, where nodes and edges
only get added (not deleted) over time, the AS dataset also
exhibits both the addition and deletion of the nodes and
edges over time.
Figure 2(c) shows the DPL plot for the Autonomous Sys-
tems dataset. We observe a clear trend: Even in the pres-
ence of noise, changing external conditions, and disruptions
87. to the Internet we observe a strong super-linear growth in
the number of edges over more than 700 AS graphs. We
show the increase in the average node degree over time
in Figure 1(c). The densification exponent is a = 1.18,
lower than the one for the citation networks, but still clearly
greater than 1.
3.1.4 Affiliation graphs
Using the arXiv data, we also constructed bipartite affil -
iation graphs. There is a node for each paper, a node for
each person who authored at least one arXiv paper, and an
edge connecting people to the papers they authored. Note
that the more traditional co-authorship network is implicit
in the affiliation network: two people are co-authors if there
is at least one paper joined by an edge to each of them.
We studied affiliation networks derived from the five larges t
categories in the arXiv (ASTRO–PH, HEP–TH, HEP–PH,
COND–MAT and GR–QC). We place a time-stamp on each
node: the submission date of each paper, and for each per -
son, the date of their first submission to the arXiv. The
data for affiliation graphs covers the period from April 1992
to March 2002. The smallest of the graphs (category GR–
QC) had 19,309 nodes (5,855 authors, 13,454 papers) and
26,169 edges. ASTRO–PH is the largest graph, with 57,381
nodes (19,393 authors, 37,988 papers) and 133,170 edges. It
has 6.87 authors per paper; most of the other categories also
have similarly high numbers of authors per paper.
For all these affiliation graphs we observe similar phe-
nomena, and in particular we have densification exponents
between 1.08 and 1.15. Due to lack of space we present