1. Abstract
Introduction
Alanine Rods Cell-Rod Systems
Cell
replacement
therapy
through
transplanta2on
of
islets
or
stem
cell-‐derived
beta
cells
is
a
promising
treatment
for
type
1
diabetes.
However,
protec2ng
these
cells
from
the
body’s
inflammatory
response
represents
a
formidable
challenge
to
the
success
of
the
transplanta2on
process.
Recent
studies
have
shown
that
amino
acid
supplementa2on
promotes
islet
survival
in
high-‐density
cultures
that
mimic
the
hos2le
transplant
environment.
Here,
we
present
two
therapies
engineered
to
sa2sfy
the
role
of
nutrient
supplementa2on
in
islet
survival.
First,
photolithography
was
used
to
generate
poly(ethylene
glycol)
dimethacrylate
(PEG-‐DMA)
hydrogel
microrods
that
are
loaded
with
alanine.
Second,
PEG-‐DMA
microrods
and
beta
cells
were
func2onalized
with
complementary
DNA
strands
to
promote
cell
adhesion
and
nutrient
delivery.
0.0E+00
2.0E+08
4.0E+08
6.0E+08
8.0E+08
1.0E+09
0
mM
AEMA
5
mM
AEMA
50mM
AEMA
Oligo
Units/Rod
Rods
with
Primary
DNA
Strand
Rods
without
Primary
DNA
Strand
0.0E+00
1.0E+08
2.0E+08
3.0E+08
4.0E+08
0
mM
AEMA
5
mM
AEMA
50mM
AEMA
Oligo
Units/Rod
Conclusions
Acknowledgements
Future Work
• Alanine
supplementa2on
promotes
islet
survival
in
a
dose
dependent
manner.
• Alanine
release
from
20%
PEG-‐DMA
rods
is
greater
than
in
80%
or
50%
PEG-‐DMA
rods.
• FITC
and
DNA
labeling
of
microrods
increases
with
AEMA
concentra2on.
• Repeat
release
study
for
20%,
50%,
and
80%
alanine
loaded
PEG-‐
DMA
microrods
over
an
extended
2me
period.
• Conduct
a
dosing
study
on
the
20%
PEG-‐DMA
alanine-‐loaded
microrods
to
determine
the
range
of
rod
concentra2ons
that
promote
islet
survival.
• Repeat
the
DNA
labeling
of
beta
cells
and
AEMA
microrods.
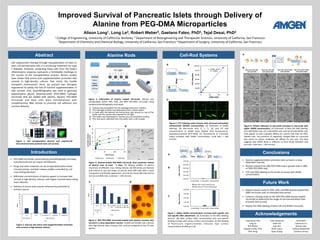
Figure
2.
Glucose
and
amino
acid
supplementa9on
promotes
islet
survival
in
high
density
cultures.
Figure
1.
Cell
encapsula9on
devices
and
engineered
microenvironments
promote
beta
cell
survival.
Figure
3.
Fabrica9on
of
alanine
loaded
microrods.
Alanine
was
encapsulated
within
20%,
50%,
and
80%
PEG-‐DMA
microrods
using
standard
photolithography
techniques:
B
C
A
Figure
7.
Higher
AEMA
concentra9ons
increase
both
specific
and
non-‐specific
DNA
aKachment.
(A)
Schema2c
of
the
DNA
labeling
process.
(B)
Both
surface
DNA
concentra2on
and
non-‐specific
binding
increase
with
amine
surface
concentra2on.
(C)
Net
binding
of
fluorescent
oligonucleo2des
indicates
high
surface
concentra2ons
of
DNA
per
rod.
• PEG-‐DMA
microrods
constructed
by
photolithography
are
easily
manufactured
and
can
impact
cell
behavior.
• Drugs
and
other
materials
can
be
encapsulated
within
these
microstructures,
and
their
release
profiles
controlled
by
rod
cross-‐linking
densi2es.
• Millimolar
concentra2ons
of
alanine
appear
to
increase
islet
survival
in
high
density
cultures,
with
higher
concentra2ons
being
more
effec2ve.
• Delivery
of
amino
acids
may
be
enhanced
by
proximity
to
nutrient
source.
Improved Survival of Pancreatic Islets through Delivery of
Alanine from PEG-DMA Microparticles
Alison Long1, Long Le2, Robert Weber3, Gaetano Faleo, PhD4, Tejal Desai, PhD2
1
College
of
Engineering,
University
of
California,
Berkeley
2
Department
of
Bioengineering
and
Therapeu2c
Sciences,
University
of
California,
San
Francisco
3Department
of
Chemistry
and
Chemical
Biology,
University
of
California,
San
Francisco
4
Department
of
Surgery,
University
of
California,
San
Francisco
Tejal
Desai,
PhD
Long
Le
Rob
Weber
Gaetano
Faleo,
PhD
Phin
Peng
Colin
Zamecnik
Cade
Fox
Jean
Kim
Kevin
Lance
Ryan
Chang
UCSF
SRTP
Lawrence
Lin
Geneva
Jost
Ta2ana
Neherfield
Carmen
Conroy
Nyitray
et
al.,
ACS
Nano,
2015.
Nyitray
et
al.,
Tissue
Engineering:
Part
A,
2014.
y
=
2E+08x
+
4E+07
R²
=
0.99987
0
2E+09
4E+09
6E+09
8E+09
1E+10
1.2E+10
0
20
40
60
FITC
Units/Rod
AEMA
(mM)
A
C
B
Figure
6.
FITC
labeling
scales
linearly
with
microrod
aminoethyl
methacrylate
(AEMA)
concentra9on.
(A)
Schema2c
of
AEMA
labeling.
(B)
Microrods
with
0,
1,
5,
10,
and
50
mM
concentra2ons
of
AEMA
were
labeled
with
fluorescein-‐N-‐
hydroxysuccinimide
(FITC-‐NHS).
(C)
Fluorescence
of
microrods
visibly
increases
with
AEMA
concentra2on.
Scale
bars
=
100
microns.
0
2
4
6
8
10
12
14
16
18
LD
HD
0.1mM
ALA
1mM
ALA
10mM
ALA
20
islets/mL
1000
islets/mL
5
hrs
%PI+
0
5
10
15
20
25
0
50
100
150
Cumula9ve
Alanine
Release
(nmol)
Time
(hours)
80%
Rods
50%
Rods
20%
Rods
Figure
4.
Alanine-‐loaded
PEG-‐DMA
microrods
have
sustained
release
of
alanine
over
at
least
5
days.
(A)
Release
profiles
of
alanine
microrods
of
different
cross
linking
density.
(B)
Microrods
are
discrete
and
uniform
in
size
and
shape.
(i)
and
(ii)
show
20%
rods,
with
a
more
transparent
and
flexible
appearance.
(iii)
and
(iv)
show
50%
rods
and
(v)
and
(vi)
are
80%
rods.
Scale
bars
=
100
microns.
A
B
1) Alanine
was
preloaded
into
the
hydrogel
precursor
solu2on.
2) The
hydrogel
solu2on
was
deposited
onto
a
silicon
wafer.
3) A
mask
with
the
desired
microstructures
was
placed
on
top
of
the
wafer
and
the
system
was
exposed
to
UV
light.
4) The
wafer
was
developed
to
remove
any
uncrosslinked
residue.
5) The
rods
were
collected
from
the
wafer
with
a
cell
scraper.
0
5
10
15
20
25
30
35
40
LD
1
HD
1
HD
10mM
ALA
HD
10k
Rods-‐ALA
HD
20k
Rods-‐ALA
20
islets/
mL
1000
islets/mL
5
hrs
%PI+
Figure
5.
20%
PEG-‐DMA
microrods
loaded
with
alanine
increase
islet
survival
in
a
dose
dependent
manner.
10,000
and
20,000
rods
cultured
with
high
density
islets
increase
islet
survival
compared
to
free
10
mM
alanine.
A
B
Figure
8.
Cellular
adhesion
to
microrods
increases
in
microrods
with
higher
AEMA
concentra9on.
(A)
Schema2c
of
beta
cell
DNA
labeling.
(i)
0
mM
AEMA
rods,
(ii)
5
mM
AEMA
rods,
and
(iii)
50
mM
AEMA
rods.
Cells
appear
to
have
a
greater
affinity
for
control
rods
than
for
DNA-‐
labeled
rods.
The
presence
of
nega2vely
charged
DNA
on
microrods
also
seems
to
reduce
unlabeled
cell
affinity
for
the
rods.
This
data
suggests
that
AEMA
alone
is
sufficient
to
form
bonds
between
rods
and
cells.
Scale
bars
=
100
microns.
Microrods
without
DNA
Cells
with
DNA
Microrods
without
DNA
Cells
without
DNA
Microrods
with
DNA
Cells
with
DNA
Microrods
with
DNA
Cells
without
DNA
B
A
(ii)
(iii)
(i)
(ii)
(iii)
(i)
(ii)
(iii)
(iv)
(v)
(vi)
0
mM
1
mM
5
mM
10
mM
50
mM
FITC%NHS)
*)
%NH2))))
%NH2))))
H2
N%))))
H2N%))))
*)
*)*)
*)
*) *) *)
*)
%NH—)))
!NH2%%%%
!NH2%%%%
H2
N!%%%%
H2N!%%%%
!NH—%%%
Fluorescent%
Oligonucleo4des%%
Anchor%
DNA%
Strand%%
y
=
2E+08x
+
4E+07
R²
=
0.99987
0
2E+09
4E+09
6E+09
8E+09
1E+10
1.2E+10
0
20
40
60
FITC
Units/Rod
AEMA
(mM)
A
C
B
!NH2%%%%
!NH2%%%%
H2
N!%%%%
H2N!%%%%
PEGDMA'
Photo+'
ini.ator'
Alanine'
Water'
UV'Light'
Figure' 3.' Fabrica.on' of' alanine' loaded' microrods.' Alanine' was'
encapsulated' within' 20%,' 50%,' and' 80%' PEG?DMA' microrods' using'
standard'photolithography'techniques:'