1. Literature Cited
Preliminary Results
Introduction
What are transposable elements?
A transposable element (TE) is a segment of DNA that can copy itself and/or move from place to
place in a genome. There are many types of TEs, or transposons, as they are also called, and they range
in length according to their type.
Transposable elements can be divided into two major classes by mechanism of action. Class 1
transposons follow a “copy and paste” mechanism, leaving multiple copies of themselves throughout
the genome they occupy. Class 2 transposons follow a “cut and paste” mechanism, moving around the
genome, but maintaining only a single copy at any given time.
Acknowledgments
Transposon Analysis in the Aardvark Genome
Alicia Wafa, Sarah Mangum, Laura Blanco-Berdugo, Roy Platt II, David Ray
Methods
Purpose
What does TE analysis tell us?
By looking at the types, ages, and amounts of transposable element in a species, we can identify
patterns of evolution within the genomes of the organisms of interest.
Traditional Transposable Element Analysis: Homology
Preliminary transposable element analysis using homology usually includes comparing the
species to a previously analyzed relative. This method does not allow identification of TEs not
previously identified in the relative. This method also produces inaccuracies in the aging of
transposable elements, as well as their numbers and types.
A Better Way: De Novo Analysis and Manual Curation
By beginning “from scratch”, modeling and identifying TEs in a genome with the use of certain
computer programs (a de novo analysis), there is no need to rely on homology. By supplementing
this framework with manual curation done by the researcher, full TE consensus sequences can be
reconstructed from the fragments often identified from the programs used. Implementing both of
these techniques allows us to create a much more accurate data set from which to draw conclusions
about what forces have influenced the species’ genomes and events in their evolution.
Figure 1. Classes and types of transposable elements and their movement through the genome.
A bigger problem
The data produced from homology based analysis does more than skew the accuracy of one paper.
It presents a false foundation upon which to base hypotheses related to genome structure and
function. Not only can this data distort conclusions about this species, but if it is used to run
homology-dependent analysis of related species, it can skew assumption about the evolutionary
history of whole clades.
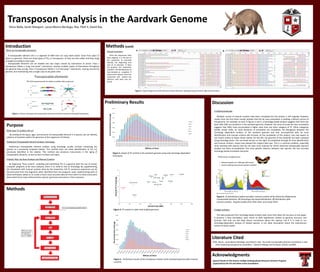
Discussion
A shifting landscape
Multiple rounds of manual curation have been completed but the project is still ongoing. However,
results from the first three rounds indicate that the de novo annotation is yielding a distinct picture of
the genome. For example, as seen in figures 3 and 5, a homology-based analysis suggests that there has
been little SINE accumulation in the aardvark genome. However, the more accurate de novo annotation
suggests that SINEs have accumulated a higher rates than any other category of TE. Other categories
exhibit similar shifts. As more iterations of annotation are completed, the divergence between the
homology dependent analysis of the aardvark genome and that accomplished with de novo
identification and manual curation will increase. At the completion of this project, one may expect to
see results similar to those shown below. On the left, the genome of this butterfly has been analyzed
using homology alone. The corrected version on the right, accomplished through de novo identification
and manual curation, shows how skewed the original data was. This is a common problem, especially
when working with species that do not have close relatives for which extensive transposable element
analysis has been accomplished. The more genetic distance between two species, the less accurate
homology-based annotation becomes.
Figure 6. TE distributions before and after manual curation of the Heliconius Melpomene
transposable elements. (C) Homology only based distribution. (F) Distribution after
manual curation. Original studies from Platt 2016 and Lavoie 2014..
Chicken
Painted Turtle
Elephant Shark
Lizard
Manatee
Gharial
Panda
DogKiller Whale
Platypus
WallabySloth Gorilla Armadillo
Aardvark
0
10
20
30
40
50
60
300 800 1300 1800 2300 2800 3300 3800
GenomeTE%Coverage
Genome Size (Mb)
Figure 5. Preliminary results of the transposon content of the Aardvark genome after manual
curation.
Figure 4. TE content in other well studied genomes.
Figure 3. Graph of TE content in the aardvark genome using only homology dependent
techniques.
Special thanks to the Honors College Undergraduate Research Scholars Program
supported by the CH and Helen Jones Foundation.
Platt, Roy N., Laura Blanco-Berdugo, and David A. Ray. "Accurate transposable element annotation is vital
when analyzing new genome assemblies." Genome Biology and Evolution (2016): evw009
Methods (cont)
Figure 2. Typical alignment of the 40 most similar elements. (a) beginning of element. (b) end of element.
a bManual Annotation
Once the sequences have
been aligned, it is the job of
the researcher to manually
identify the beginning and
end of an element. If both
are present, the researcher
classifies the identification of
that element as complete. If
either end is absent, then the
researcher will extend the
element until both end are
found.
0
0.001
0.002
0.003
0.004
0.005
0.006
0.007
PercentGenomeCoverage
Millions of Years
others
SINE
LINE
LTR
ERV
DNA
0
0.002
0.004
0.006
0.008
0.01
0.012
0.014
0.00E+00
4.55E+06
9.09E+06
1.36E+07
1.82E+07
2.27E+07
2.73E+07
3.18E+07
3.64E+07
4.09E+07
4.55E+07
5.00E+07
5.45E+07
5.91E+07
6.36E+07
6.82E+07
7.27E+07
7.73E+07
8.18E+07
8.64E+07
9.09E+07
9.55E+07
1.00E+08
1.05E+08
1.09E+08
1.14E+08
1.18E+08
1.23E+08
1.27E+08
1.32E+08
1.36E+08
1.41E+08
1.45E+08
1.50E+08
1.55E+08
1.59E+08
1.64E+08
1.68E+08
1.73E+08
1.77E+08
1.82E+08
1.86E+08
1.91E+08
1.95E+08
2.00E+08
PercentGenomeCoverage
Millions of Years
Others
SINE
LINE
LTR
ERV
DNA