1. Drawing a cumulative frequency
diagram
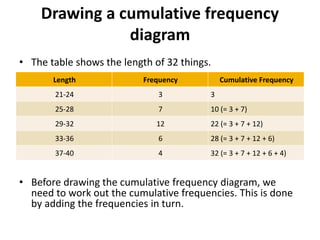
• The table shows the length of 32 things.
• Before drawing the cumulative frequency diagram, we
need to work out the cumulative frequencies. This is done
by adding the frequencies in turn.
Length Frequency Cumulative Frequency
21-24 3 3
25-28 7 10 (= 3 + 7)
29-32 12 22 (= 3 + 7 + 12)
33-36 6 28 (= 3 + 7 + 12 + 6)
37-40 4 32 (= 3 + 7 + 12 + 6 + 4)
2. • The points are plotted at the upper class boundary. In this
example, the upper class boundaries are 24.5, 28.5, 32.5, 36.5
and 40.5. Cumulative frequency is plotted on the vertical axis.
3.
4. The Cumulative Percentage Curve or
Ogive
• Cumulative frequencies of a distribution can
also be charted on a graph.
• The curve that results by plotting these is
called the Ogive Curve. Since the cumulative
frequencies can either be ‘less than’ or ‘more
than’ type, there are two type of ogives called
‘less than’ type and ‘more than’ type ogive.
• The value of median and other partition
values can be located from the ogives.
5. • The technique of drawing frequency curves and
cumulative frequency curves is more or less the
same.
• The only difference is that in case of simple
frequency curves the frequency is plotted against
the mid point of a class interval whereas in case
of a cumulative frequency curve it is plotted at
the upper or limit of a class interval depending
upon the manner in which the series has been
cumulated.
6. • Less Than Ogive:- The less than cumulative
frequencies are in ascending order. The
cumulative frequency of each class is plotted
against the upper limit of the class interval in this
type of ogive and then various points are joined
by straight line.
• More Than Ogive:- The cumulative frequencies in
this type are in the descending order. The
cumulative frequency of each class is plotted
against the lower limit of the class interval.