The build up_of_the_c_d_halo_of_m87_evidence_for_accretion_in_the_last_gyr
Investigating Techniques to Model the Martian Surface Using
1. Investigating Techniques to Model the Martian Surface Using
Principal Component Analysis / Target Transformation
Alexander H. Reedy and David R. Klassen Rowan University Department of Physics & Astronomy
Abstract
The goal of this research is to measure the water content in martian clouds over the diurnal, seasonal, and
interannual timescales. In order to do this, we must first must determine a way to isolate the clouds spectral
signature from the martian surface's spectral signature. This is done by recovering spectral endmembers
from ground-based near-infrared imaging using Principal Component Analysis (PCA) and Target
Transformation (TT). Three separate TT techniques were used to find endmembers from the transformations
candidates. The first was to manually sort the transformations based on PCA space spectral shape, the
second was to plot transformations in PCA space to find 3-D cloud vertices, and the third was to use k-means
clustering to mathematically separate the PCA cloud into bins. I will present here the results of using these
three techniques on data from the 1994-95 Mars opposition; the techniques will be compared and
contrasted in order to determine a “best” method.
Spectral Endmember Comparison of the Three
Techniques Over the 1994-95 Martian Opposition
Procedure
● Principal Component Analysis (PCA) done to find eigenvectors of data variance/co-variance matrix
● Target Transformation (TT) done on eigenvectors to produce “candidate endmembers”.
● Three methods used to recover representative endmembers .
○ Sorting based on PCA “spectral” shape of candidates
○ K-means Clustering of candidates in PCA space
○ Picking Vertices of candidate data cloud in PCA space
● The “representative endmembers” can be used to model the Martian surface and then subtracted
to leave only signal from the atmosphere.
Principal Component Analysis (PCA)
PCA is a statistical method of turning correlated data into
linearly uncorrelated data
● Origin is set at the center of the data cloud and a
line is drawn along the direction of largest variance;
this is the 0th eigenvector.
● Another line along the direction of second largest
variance is drawn orthogonal to the previous; this is
the 1st eigenvector
● Process is continued until we have 32 completely
orthogonal eigenvectors
Numerical Endmember Comparison of the Three
Techniques Over the 1994-95 Mars Opposition
Target Transformation
● Creates best-fit linear combinations of the eigenvectors to known mineral spectra; these are
the “candidate endmembers”
● Candidate endmembers are separated into groups using three methods
○ Binning candidates based on PCA “spectral” shape
○ Finding vertices of candidate data cloud in PCA space
○ Use k-means clustering on candidates in PCA space
● Final endmembers chosen from each group; these “representative endmembers” will be used
to model the Martian surface
Data
● Images taken at NASA Infrared Telescope Facility on Mauna Kea, HI
● Using NSFCAM, 256×256 InSb array with circular variable filter
● Image cubes of Mars covering 1.5–4.1 µm
● This work uses data taken during 1994–95 oppositions
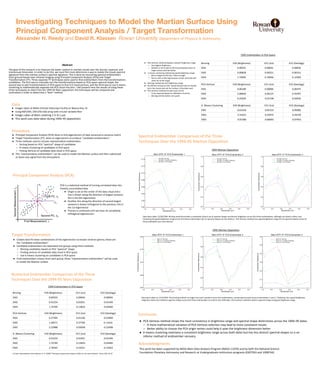
Binning EV0 (Brightness) EV1 (Ice) EV2 (Geology)
EM1 0.00355 0.00044 -0.00004
EM2 0.41254 0.01921 -0.01449
EM3 1.74769 0.13833 -0.04460
1994 Endmembers in PCA Space
PCA Vertices EV0 (Brightness) EV1 (Ice) EV2 (Geology)
EM1 0.27395 0.01126 -0.01809
EM2 1.28571 0.37760 0.11616
EM3 2.22988 0.03058 -0.22408
K- Means Clustering EV0 (Brightness) EV1 (Ice) EV2 (Geology)
EM1 0.41254 0.01921 -0.01449
EM2 1.74769 0.13833 -0.04460
EM3 2.78342 0.14221 -0.14363
1995 Endmembers in PCA Space
Binning EV0 (Brightness) EV1 (Ice) EV2 (Geology)
EM1 0.00331 0.00041 0.00056
EM2 0.00828 0.00321 0.00314
EM3 1.74992 0.19946 0.12369
PCA Vertices EV0 (Brightness) EV1 (Ice) EV2 (Geology)
EM1 0.06189 0.00006 0.00475
EM2 2.86839 0.04124 0.45497
EM3 0.25629 -0.01196 0.02656
K- Means Clustering EV0 (Brightness) EV1 (Ice) EV2 (Geology)
EM1 0.61016 0.05153 0.05082
EM2 2.54221 0.25975 0.29159
EM3 0.91580 0.06693 0.07453
1994 Martian Opposition
1995 Martian Opposition
Data were taken 12/28/1994: Binning method provides a somewhat distinct set of spectral shapes and decent brightness across the three endmembers, although not ideal in either case.
Clustering has good brightness range across the three endmembers but its spectral shapes are less distinct. PCA Vertices method has a good brightness range and its spectral shapes across all
three endmebers are more distinct.
Data were taken on 1/14/1995: The binning method no longer has much variation across the endmembers, remaining very dark across Endmembers 1 and 2. Clustering has a good brightness
range but retains the indistinct spectral shapes across the three endmembers as it did on the 1994 date. PCA Vertices maintains distinct spectral shapes and good brightness range.
Conclusion
● PCA Vertices method shows the most consistency in brightness range and spectral shape distinctness across the 1994–95 dates.
○ A more mathematical variation of PCA Vertices selection may lead to more consistent results
○ Better ability to choose the PCA origin vertex could help it span the brightness dimension better
● k-means clustering maintains a consistent brightness range across both dates but has less distinct spectral shapes so is an
inferior method of endmember recovery
Acknowledgments
This work has been supported by NASA Mars Data Analysis Program (NAG5-11076) and by both the National Science
Foundation Planetary Astronomy and Research at Undergraduate Institutions programs (0307924 and 1008744).EV trait interpretations from Klassen, D. R. (2009) "Principal components analysis of Mars in the near-infrared", Icarus 204, 32-47.
● PCA Vertices method displays a decent brightness range
○ Has highest brightness
○ Darkest is not as dark as Binning implying choice of
origin vertex could be better
● k-means clustering method has good brightness range
○ Not as bright as PCA but “close enough”
○ Not as dark as Binning because cluster centroids will
never be at the origin
● Binning method has fair brightness range
● No EM has strong ice trait—good because any ice should
be in the clouds and not the surface in the data used
● PCA Vertices method has best span of EV2
○ To be expected based on definition of vertex
○ Binning still has better zero-point