SlideShare a Scribd company logo
1 of 8
Download to read offline
Industrial
Outlook
An in-depth look at the
Louisville industrial market.
Analysis includes leasing,
sales, construction and
employment.
Louisville | Q2 2019
JLL Research
© 2017 Jones Lang LaSalle IP, Inc. All rights reserved. All information contained herein is from sources deemed reliable; however, no representation or warranty is made to the accuracy thereof.
Q2 2019
Insight
Louisville Industrial Outlook
Leasing in the second quarter slowed slightly as availabilities remain
somewhat limited. APL signed the biggest lease of the quarter taking the
527,250-square-foot building at 700 Omega Parkway and will relocate in late
2019 from their current 382,000-square-foot facility. Medline has
transitioned from 1065 Conestoga Parkway to their build-to-suit in River
Ridge. They will occupy 900,000 square feet and lease the remaining 200,000
square feet, short term.
Institutional activity continued in Louisville with three transactions this
quarter. IAC purchased the 325,000-square-foot building at 9101 Minor Lane
for $77.00 per square foot and Stoltz purchased the 210,000-square-foot
building at 5101 Jeff Commerce Boulevard for $85.00 per square foot. Said
buildings are currently leased to Amazon and McKesson, respectively and
transferred at 5.2 percent and 5.1 percent cap rates. Additionally, MDH
purchased Park 65 Business Center that is 60.0 percent vacant for over
$60.00 per square foot and Tratt purchased 301 Logistics in River Ridge that
is nearly 30% vacant.
As expected development announcements have continued to gain
momentum. Several institutional developers have secured land positions
that could introduce over 3-million square feet to the market in the next 9 to
18 months.
Outlook
Despite the slowdown in leasing the Louisville market remains strong. The
unprecedented absorption of the past 12-months was unsustainable in the
long term given the lack of product being delivered. However, interest in
both purchasing and spec development continues to show the viability of
Louisville as a major market for institutional players within the industrial
sector.
Fundamentals Forecast
YTD net absorption 3,347,497 s.f. ▼
QTD net absorption 1,189,080 s.f. ▼
Under construction 2,175,768 s.f. ▼
Total vacancy 6.99 % ▼
Average asking rent (NNN) $3.90 p.s.f. ▲
Tenant improvements Stable ▶
0
4,000,000
8,000,000
2015 2016 2017 2018 2019
Supply and demand (s.f.) Net absorption
Deliveries
Strong institutional investment interest continues
5.7%
8.7%
11.7%
9.4%
7.0%
2015 2016 2017 2018 2019
Total vacancy
$3.20
$3.40
$3.60
$3.80
$4.00
2014 2015 2016 2017 2018 2019
Average asking rents ($/s.f.)
© 2019 Jones Lang LaSalle IP, Inc. All rights reserved. All information contained herein is from sources deemed reliable; however, no representation or warranty is made to the accuracy thereof.
Top trends and activity
• Stoltz and IAC purchased fully leased assets in the Airport submarkets.
• MDH purchased the 60% vacant Park 65 Business Center.
• Modern bulk vacancy dipped below 7.00 percent, continuing a
downward trend.
© 2017 Jones Lang LaSalle IP, Inc. All rights reserved. All information contained herein is from sources deemed reliable; however, no representation or warranty is made to the accuracy thereof.
Inventory
(s.f.)
YTD
total net
absorption
(s.f.)
YTD
total net
absorption
(% of inventory)
Total
Vacancy (%)
Average
total asking
rent
($ p.s.f.)
YTD
completions
(s.f.)
Under
construction
(s.f.)
Airport 24,304,863 1,607,500 6.6% 3.2% $4.11 447,000 834,728
Bullitt County 13,647,026 -302,500 -2.2% 12.4% $4.06 0 572,000
East 5,985,608 0 0.0% 0.0% $5.95 0 150,040
Riverport 12,557,133 636,380 5.1% 7.0% $3.62 230,000 0
Southern Indiana 11,316,172 1,406,117 12.4% 12.2% $3.76 1,100,000 619,000
Louisville Totals 67,810,802 3,347,497 4.9% 7.0% $3.90 1,777,000 2,175,768
Analyzes all industrial buidings greater than 100,000 s.f. with a minimum clear height of 24'
2,234,648
1,934,181 2,059,001
2,742,889
3,029,702
3,843,783
2,568,298
5,710,124
3,347,497
0
1,000,000
2,000,000
3,000,000
4,000,000
5,000,000
6,000,000
2011 2012 2013 2014 2015 2016 2017 2018 Q2 2019
Q2 2019
Statistics
Louisville Industrial Outlook
9.2%
8.3%
7.2%
6.6%
5.7%
8.7%
11.7%
9.4%
7.0%
2.0%
5.0%
8.0%
11.0%
14.0%
2011 2012 2013 2014 2015 2016 2017 2018 Q2 2019
© 2019 Jones Lang LaSalle IP, Inc. All rights reserved. All information contained herein is from sources deemed reliable; however, no representation or warranty is made to the accuracy thereof.
Total Vacancy Rate %
Total Net Absorption
© 2017 Jones Lang LaSalle IP, Inc. All rights reserved. All information contained herein is from sources deemed reliable; however, no representation or warranty is made to the accuracy thereof.
$187,037,809
10
$68
5.75%-6.25%
98.5%
2.5%
Top sales transactions last 12 months
Size (s.f.) $ p.s.f. Sale date
2621 Technology Drive WPT Industrial REIT WPT Capital Advisors 224,000 $17,900,000 $80 Sep-18
120 Velocity Way Granite Capital Browning 721,000 $68 Dec-18
7251 Logistics Drive Paul & Eleanor Sade Trust Panattoni 356,000 $66 May-18
250 Hilton Drive GLP Van Trust 592,800 $38,400,000 $65 Apr-18
857 Park Loop Road* Colony Capital Dermody 546,000 $26,489,801 $47 Feb-19
Dream Industrial REIT Transwestern 302,500 $13,491,668 $45 Feb-19
1234 Gardiner Lane GSK Properties 162,000 $4,610,000 $28 Dec-18
Sales price $
12 month sales volume $ by submarket
$48,696,340
*Purchased as part of portfolio
Dry Ridge Capital
$23,500,000
3208 E. Blue Lick Road*
Building address Buyer company
Transactions details
Seller company
Average Class A sale price p.s.f.
12 month transaction volume at a glance
Total volume
Number of transactions
Average Class A cap rate
Sales activity by building type last 12 months
Warehouse/Dist. sales volume as % of
total
Manufacturing sales volume as % of
total
Top sellers (s.f.)Top buyers (s.f.)
$182,287,809
$4,750,000
0 s.f.
500,000 s.f.
1,000,000 s.f.
1,500,000 s.f.
2,000,000 s.f.
2,500,000 s.f.
3,000,000 s.f.
3,500,000 s.f.
$0
$50,000,000
$100,000,000
$150,000,000
$200,000,000
Warehouse / Distribution Manufacturing
Sum of Price ($) Sum of RBA (SF)
20%
16%
15%13%
10%
8%
6%
Granite GLP
Colony Capital Sazerac
Paul & Eleanor Sade Trust Dream Industrial REIT
WPT Industrial REIT GSK Properties
Sperber Familly Trust Greif
20%
16%
15%13%
10%
8%
6%
Browning Van Trust
Dermody New Mill Capital Holdings
Panattoni Transwestern
WPT Capital Advisors Dry Ridge Capital
Atalaya Investments Alemap
$88,677,809
$43,150,000
$27,200,000
$17,900,000
$10,110,000
Bullitt County
Southern Indiana
Riverport
East
Airport
Q2 2019
Sales
Louisville Industrial Outlook
This report analyzes all industrial sales > 75,000 s.f. year-to-date
© 2019 Jones Lang LaSalle IP, Inc. All rights reserved. All information contained herein is from sources deemed reliable; however, no representation or warranty is made to the accuracy thereof.
$187,037,809
10
$68
5.75%-6.25%
98.5%
2.5%
Top sales transactions last 12 months
Size (s.f.) $ p.s.f. Sale date
2621 Technology Drive WPT Industrial REIT WPT Capital Advisors 224,000 $17,900,000 $80 Sep-18
120 Velocity Way Granite Capital Browning 721,000 $68 Dec-18
7251 Logistics Drive Paul & Eleanor Sade Trust Panattoni 356,000 $66 May-18
250 Hilton Drive GLP Van Trust 592,800 $38,400,000 $65 Apr-18
857 Park Loop Road* Colony Capital Dermody 546,000 $26,489,801 $47 Feb-19
Dream Industrial REIT Transwestern 302,500 $13,491,668 $45 Feb-19
1234 Gardiner Lane GSK Properties 162,000 $4,610,000 $28 Dec-18
Sales price $
12 month sales volume $ by submarket
$48,696,340
*Purchased as part of portfolio
Dry Ridge Capital
$23,500,000
3208 E. Blue Lick Road*
Building address Buyer company
Transactions details
Seller company
Average Class A sale price p.s.f.
12 month transaction volume at a glance
Total volume
Number of transactions
Average Class A cap rate
Sales activity by building type last 12 months
Warehouse/Dist. sales volume as % of
total
Manufacturing sales volume as % of
total
Top sellers (s.f.)Top buyers (s.f.)
$182,287,809
$4,750,000
0 s.f.
500,000 s.f.
1,000,000 s.f.
1,500,000 s.f.
2,000,000 s.f.
2,500,000 s.f.
3,000,000 s.f.
3,500,000 s.f.
$0
$50,000,000
$100,000,000
$150,000,000
$200,000,000
Warehouse / Distribution Manufacturing
Sum of Price ($) Sum of RBA (SF)
20%
16%
15%13%
10%
8%
6%
Granite GLP
Colony Capital Sazerac
Paul & Eleanor Sade Trust Dream Industrial REIT
WPT Industrial REIT GSK Properties
Sperber Familly Trust Greif
20%
16%
15%13%
10%
8%
6%
Browning Van Trust
Dermody New Mill Capital Holdings
Panattoni Transwestern
WPT Capital Advisors Dry Ridge Capital
Atalaya Investments Alemap
$88,677,809
$43,150,000
$27,200,000
$17,900,000
$10,110,000
Bullitt County
Southern Indiana
Riverport
East
Airport
$179,237,809
10
$66
5.00% - 5.75%
100.0%
0.0%
Top sales transactions last 12 months
Size (s.f.) $ p.s.f. Sale date
Stoltz Real Estate Jefferson United 210,000 $17,850,000 $85 May-19
WPT Industrial REIT WPT Capital Advisors 224,000 $17,900,000 $80 Sep-18
9101 Minor Lane IAC 324,991 $77 May-19
120 Velocity Way Granite Capital Browning 721,000 $68 Dec-18
100 Brooks Way MDH 259,960 $16,500,000 $64 May-19
857 Park Loop Road* Colony Capital Dermody 546,000 $26,489,801 $47 Feb-19
Dream Industrial REIT Transwestern 302,500 $13,491,668 $45 Feb-19
2621 Technology Drive
5101 Jeff Commerce Drive
$48,696,340
Kelly Development
3208 E. Blue Lick Road*
*Purchased as part of portfolio
Building address Buyer company
Transactions details
Seller company
12 month sales volume $ by submarket
Average Class A sale price p.s.f.
12 month transaction volume at a glance
Total volume
Number of transactions
Average Class A cap rate range
Sales activity by building type last 12 months
Warehouse/Dist. sales volume as % of
total
Manufacturing sales volume as % of
total
Johnson Development
Top sellers (s.f.)Top buyers (s.f.)
Sales price $
$24,500,000
$179,237,809
3,007,971 s.f.
0 s.f.
500,000 s.f.
1,000,000 s.f.
1,500,000 s.f.
2,000,000 s.f.
2,500,000 s.f.
3,000,000 s.f.
3,500,000 s.f.
$0
$50,000,000
$100,000,000
$150,000,000
$200,000,000
Warehouse / Distribution
Sum of Price ($) Sum of RBA (SF)
24%
18%
11%
10%
9%
8%
7%
Granite Colony Capital
IAC Dream Industrial REIT
MDH WPT Industrial REIT
Stoltz Real Estate GSK Properties
Sperber Familly Trust Greif
24%
18%
11%
10%
9%
7%
7%
Browning Dermody
Kelly Development Transwestern
Johnson Development WPT Capital Advisors
Jefferson United Dry Ridge Capital
Atalaya Investments Alemap
$105,177,809
$52,460,000
$17,900,000
$3,700,000
Bullitt County
Airport
East
Riverport
$186,537,809
11
$66
5.00% - 5.75%
100.0%
0.0%
Top sales transactions last 12 months
Size (s.f.) $ p.s.f. Sale date
Stoltz Real Estate Jefferson United 210,000 $17,850,000 $85 May-19
WPT Industrial REIT WPT Capital Advisors 224,000 $17,900,000 $80 Sep-18
9101 Minor Lane IAC 324,991 $77 May-19
120 Velocity Way Granite Capital Browning 721,000 $68 Dec-18
100 Brooks Way MDH 259,960 $16,500,000 $64 May-19
857 Park Loop Road* Colony Capital Dermody 546,000 $26,489,801 $47 Feb-19
Dream Industrial REIT Transwestern 302,500 $13,491,668 $45 Feb-19
Sales price $
$24,500,000
Top sellers (s.f.)Top buyers (s.f.)
Average Class A sale price p.s.f.
12 month transaction volume at a glance
Total volume
Number of transactions
Average Class A cap rate range
Sales activity by building type last 12 months
Warehouse/Dist. sales volume as % of
total
Manufacturing sales volume as % of
total
Building address Buyer company
Transactions details
Seller company
12 month sales volume $ by submarket
*Purchased as part of portfolio
2621 Technology Drive
5101 Jeff Commerce Drive
$48,696,340
Kelly Development
3208 E. Blue Lick Road*
Johnson Development
3,122,971 s.f.
$186,537,809
0 s.f.
500,000 s.f.
1,000,000 s.f.
1,500,000 s.f.
2,000,000 s.f.
2,500,000 s.f.
3,000,000 s.f.
3,500,000 s.f.
$0
$50,000,000
$100,000,000
$150,000,000
$200,000,000
Warehouse / Distribution
Sum of Price ($) Sum of RBA (SF)
23%
18%
10%10%
8%
7%
7%
Granite Colony Capital
IAC Dream Industrial REIT
MDH WPT Industrial REIT
Stoltz Real Estate GSK Properties
Sperber Familly Trust Exeter
Greif
23%
17%
10%10%
8%
7%
7%
Browning Dermody
Kelly Development Transwestern
Johnson Development WPT Capital Advisors
Jefferson United Dry Ridge Capital
Atalaya Investments FCI
Alemap
$105,177,809
$52,460,000
$25,200,000
$3,700,000
Bullitt County
Airport
East
Riverport
$212,137,809
11
$66
5.00% - 5.75%
100.0%
0.0%
Top sales transactions last 12 months
Size (s.f.) $ p.s.f. Sale date
Stoltz Real Estate Jefferson United 210,000 $17,850,000 $85 May-19
WPT Industrial REIT WPT Capital Advisors 224,000 $17,900,000 $80 Sep-18
9101 Minor Lane IAC 324,991 $77 May-19
120 Velocity Way Granite Capital Browning 721,000 $68 Dec-18
100 Brooks Way MDH 259,960 $16,500,000 $64 May-19
301 Logistics Avenue* Tratt Opus 426,450 $25,600,000 $60 Jun-19
857 Park Loop Road* Colony Capital Dermody 546,000 $26,489,801 $47 Feb-19
Dream Industrial REIT Transwestern 302,500 $13,491,668 $45 Feb-19
Sales price $
$24,500,000
Top sellers (s.f.)Top buyers (s.f.)
Average Class A sale price p.s.f.
12 month transaction volume at a glance
Total volume
Number of transactions
Average Class A cap rate range
Sales activity by building type last 12 months
Warehouse/Dist. sales volume as % of
total
Manufacturing sales volume as % of
total
Building address Buyer company
Transactions details
Seller company
12 month sales volume $ by submarket
*Purchased as part of portfolio
2621 Technology Drive
5101 Jeff Commerce Drive
$48,696,340
Kelly Development
3208 E. Blue Lick Road*
Johnson Development
3,131,721 s.f.
426,450 s.f.
$186,537,809
$25,600,000
0 s.f.
500,000 s.f.
1,000,000 s.f.
1,500,000 s.f.
2,000,000 s.f.
2,500,000 s.f.
3,000,000 s.f.
3,500,000 s.f.
$0
$50,000,000
$100,000,000
$150,000,000
$200,000,000
Warehouse / Distribution (blank)
Sum of Price ($) Sum of RBA (SF)
20%
15%
12%
9%
9%
7%
6%
6%
Granite Colony Capital
Tratt Properties IAC
Dream Industrial REIT MDH
WPT Industrial REIT Stoltz Real Estate
GSK Properties Sperber Familly Trust
Exeter Greif
20%
15%
12%
9%
9%
7%
6%
6%
Browning Dermody
Opus Kelly Development
Transwestern Johnson Development
WPT Capital Advisors Jefferson United
Dry Ridge Capital Atalaya Investments
FCI Alemap
$105,177,809
$52,460,000
$25,600,000
$25,200,000
$3,700,000
Bullitt County
Airport
Southern Indiana
East
Riverport
$212,137,809
12
$66
5.00% - 5.75%
100.0%
0.0%
Top sales transactions last 12 months
Size (s.f.) $ p.s.f. Sale date
Stoltz Real Estate Jefferson United 210,000 $17,850,000 $85 May-19
WPT Industrial REIT WPT Capital Advisors 224,000 $17,900,000 $80 Sep-18
9101 Minor Lane IAC 324,991 $77 May-19
120 Velocity Way Granite Capital Browning 721,000 $68 Dec-18
100 Brooks Way MDH 259,960 $16,500,000 $64 May-19
301 Logistics Avenue* Tratt Opus 426,450 $25,600,000 $60 Jun-19
857 Park Loop Road* Colony Capital Dermody 546,000 $26,489,801 $47 Feb-19
Dream Industrial REIT Transwestern 302,500 $13,491,668 $45 Feb-19
Sales price $
$24,500,000
Top sellers (s.f.)Top buyers (s.f.)
Average Class A sale price p.s.f.
12+B9:N51 month transaction volume at a glance
Total volume
Number of transactions
Average Class A cap rate range
Sales activity by building type last 12 months
Warehouse/Dist. sales volume as % of
total
Manufacturing sales volume as % of
total
Building address Buyer company
Transactions details
Seller company
12 month sales volume $ by submarket
*Purchased as part of portfolio
2621 Technology Drive
5101 Jeff Commerce Drive
$48,696,340
Kelly Development
3208 E. Blue Lick Road*
Johnson Development
3,131,721 s.f.
426,450 s.f.
$186,537,809
$25,600,000
0 s.f.
500,000 s.f.
1,000,000 s.f.
1,500,000 s.f.
2,000,000 s.f.
2,500,000 s.f.
3,000,000 s.f.
3,500,000 s.f.
$0
$50,000,000
$100,000,000
$150,000,000
$200,000,000
Warehouse / Distribution (blank)
Sum of Price ($) Sum of RBA (SF)
20%
15%
12%
9%
9%
7%
6%
6%
Granite Colony Capital
Tratt Properties IAC
Dream Industrial REIT MDH
WPT Industrial REIT Stoltz Real Estate
GSK Properties Sperber Familly Trust
Exeter Greif
20%
15%
12%
9%
9%
7%
6%
6%
Browning Dermody
Opus Kelly Development
Transwestern Johnson Development
WPT Capital Advisors Jefferson United
Dry Ridge Capital Atalaya Investments
FCI Alemap
$105,177,809
$52,460,000
$25,600,000
$25,200,000
$3,700,000
Bullitt County
Airport
Southern Indiana
East
Riverport
$212,137,809
12
$66
5.00% - 5.75%
100.0%
0.0%
Top sales transactions last 12 months
Size (s.f.) $ p.s.f. Sale date
Stoltz Real Estate Jefferson United 210,000 $17,850,000 $85 May-19
WPT Industrial REIT WPT Capital Advisors 224,000 $17,900,000 $80 Sep-18
9101 Minor Lane IAC 324,991 $77 May-19
120 Velocity Way Granite Capital Browning 721,000 $68 Dec-18
100 Brooks Way MDH 259,960 $16,500,000 $64 May-19
301 Logistics Avenue* Tratt Opus 426,450 $25,600,000 $60 Jun-19
857 Park Loop Road* Colony Capital Dermody 546,000 $26,489,801 $47 Feb-19
Dream Industrial REIT Transwestern 302,500 $13,491,668 $45 Feb-19
2621 Technology Drive
5101 Jeff Commerce Drive
$48,696,340
Kelly Development
3208 E. Blue Lick Road*
Johnson Development
*Purchased as part of portfolio
Building address Buyer company
Transactions details
Seller company
12 month sales volume $ by submarket
Average Class A sale price p.s.f.
Last 12 month transaction volume at a glance
Total volume
Number of transactions
Average Class A cap rate range
Sales activity by building type last 12 months
Warehouse/Dist. sales volume as % of
total
Manufacturing sales volume as % of
total
Sales price $
$24,500,000
Top sellers (s.f.)Top buyers (s.f.)
3,558,171 s.f.
$212,137,809
0 s.f.
500,000 s.f.
1,000,000 s.f.
1,500,000 s.f.
2,000,000 s.f.
2,500,000 s.f.
3,000,000 s.f.
3,500,000 s.f.
4,000,000 s.f.
$0
$50,000,000
$100,000,000
$150,000,000
$200,000,000
$250,000,000
Warehouse / Distribution
Sum of Price ($) Sum of RBA (SF)
20%
15%
12%
9%
9%
7%
6%
6%
Granite Colony Capital
Tratt Properties IAC
Dream Industrial REIT MDH
WPT Industrial REIT Stoltz Real Estate
GSK Properties Sperber Familly Trust
Exeter Greif
20%
15%
12%
9%
9%
7%
6%
6%
Browning Dermody
Opus Kelly Development
Transwestern Johnson Development
WPT Capital Advisors Jefferson United
Dry Ridge Capital Atalaya Investments
FCI Alemap
$105,177,809
$52,460,000
$25,600,000
$25,200,000
$3,700,000
Bullitt County
Airport
Southern Indiana
East
Riverport
© 2017 Jones Lang LaSalle IP, Inc. All rights reserved. All information contained herein is from sources deemed reliable; however, no representation or warranty is made to the accuracy thereof.
Total leased at delivery (%) 7.9%
Total speculative at delivery (s.f.) 1,639,130
Total BTS at delivery (s.f.) 481,000
Total owner-user at delivery (s.f.) 2,718,000
Total # of properties delivered 11
Asking rental rate (low - high) $4.25 - $5.50
Largest projects delivered past 12 months
Building/Address RBA (s.f.) Delivery date
Leased at
delivery (%)
W.W. Grainger 1,300,000 Q3 2018 100%
Medline Distribution Center 1,100,000 Q2 2019 100%
Exeter River Ridge 506,117 Q3 2018 0%
Skyway 350 350,000 Q3 2018 0%
4301 Produce Road 318,000 Q2 2019 100%
2349 E. Miller Lane 251,000 Q4 2018 100%
Total pre-leased (%) 25.3%
Total speculative under construction (s.f.) 1,706,768
Total BTS under construction (s.f.) -
Total Owner-user under construction (s.f.) 469,000
Total # of properties UC 7
Asking rental rate (low - high) $3.90 - $4.65
Largest projects currently under construction
Building RBA (s.f.) Delivery date Pre-leased (%)
Logistics River Ridge 469,000 Q2 2019 100%
Dermody Renaissance South 352,800 Q3 2020 0%
New Cut Center Bldg 2 331,928 Q2 2019 0%
Eastpoint Business Center B 150,040 Q3 2019 21%
401 Salem 150,000 Q4 2019 0%Speculative
Speculative
Owner Construction type
Speculative
America Place
Boland
Main Street Realty
Dermody
Niagara Bottling
Speculative
Owner-user
Southern Indiana
East
Airport
Airport
Southern Indiana
Construction typeOwnerSubmarket
Airport
Airport
Southern Indiana
Southern Indiana
Airport
Premier Packaging
The Schroering Co.
Exeter Property Group
Medline
W.W. Grainger
Owner-user
Owner-user
New and historical deliveries
Completions in-depth
4,838,130
Total delivered past 12 months (s.f.)
Speculative
Speculative
Owner-user
Submarket
Under construction
2,175,768
Under construction (s.f.)
Under construction in-depth
Upcoming deliveries by year (s.f., excludes YTD completions)
Airport Advance Distribution Services BTS
0
1,000,000
2,000,000
3,000,000
4,000,000
5,000,000
6,000,000
7,000,000
2012 2013 2014 2015 2016 2017 2018 2019
0
200,000
400,000
600,000
800,000
1,000,000
1,200,000
1,400,000
1,600,000
1,800,000
2,000,000
2019 2020
Owner-user Speculative
Q2 2019
Construction
Louisville Industrial Outlook
This report analyzes all industrial developments under construction & new deliveries > 100,000 s.f.
© 2019 Jones Lang LaSalle IP, Inc. All rights reserved. All information contained herein is from sources deemed reliable; however, no representation or warranty is made to the accuracy thereof.
© 2017 Jones Lang LaSalle IP, Inc. All rights reserved. All information contained herein is from sources deemed reliable; however, no representation or warranty is made to the accuracy thereof.
Q2 2019
Construction
Louisville Industrial Outlook
1
Location: 6200 New Cut Road
Square feet: 331,928
Tenant(s): None
Landlord: Main Street
1
2
Location: 401 Salem Road
Square feet: 150,000
Tenant(s): None
Landlord: America Place
2
3
Address: Logistics Avenue
Square feet: 469,000
Tenant(s): Owner-user
Landlord: Niagara Bottling
3
© 2019 Jones Lang LaSalle IP, Inc. All rights reserved. All information contained herein is from sources deemed reliable; however, no representation or warranty is made to the accuracy thereof.
4
3
Address: 2825 Transglobal
Drive
Square feet: 352,800
Tenant(s): None
Landlord: Dermody
© 2017 Jones Lang LaSalle IP, Inc. All rights reserved. All information contained herein is from sources deemed reliable; however, no representation or warranty is made to the accuracy thereof.
22%
15%
13%12%
11%
10%
7%
Trade, Transportation & Utilities
Educational & Health Services
Professional & Business Services
Manufacturing
Government
Leisure & Hospitality
Financial Activities
Mining, Logging & Construction
Other Services
Information
Q2 2019
Employment
Louisville Industrial Outlook
3.6%U.S. unemployment
1.5%U.S. 12-month job growth
3.5%Louisville unemployment
0.8%Louisville 12-month job growth
4.0%Kentucky unemployment
1.0%Kentucky 12-month job growth
-3.0
2.0
7.0
12.0
17.0
22.0
2014 2015 2016 2017 2018
Trade, Transportation & Utilities Manufacturing
Other Services Mining Logging & Construction
2019
0%
4%
8%
400,000
500,000
600,000
700,000
800,000
2015 2016 2017 2018 2019
Employment Unemployment
Employment vs. unemployment rate
Employment by industry
Job growth (12-month change)
-3,700
-2,900
-1,000
-900
-500
0
500
1,500
3,600
5,400
-6,500 -4,500 -2,500 -500 1,500 3,500 5,500 7,500
Professional & Business…
Leisure & Hospitality
Other Services
Trade, Transportation & Utilities
Information
Financial Activities
Government
Mining, Logging & Construction
Manufacturing
Educational & Health Services
Job growth*
Historical employment Job growth by sector*
Employment by industry Industrial employment*
* Represents 12-month change in employment. All charts represent the latest economic data available from the Bureau of Labor Statistics as of May 2019.
© 2019 Jones Lang LaSalle IP, Inc. All rights reserved. All information contained herein is from sources deemed reliable; however, no representation or warranty is made to the accuracy thereof.
-1.0%
-0.3%
0.4%
1.1%
1.8%
2.5%
3.2%
3.9%
2015 2016 2017 2018
Louisville U.S.
2019
Andrew Batson
Vice President, Director of Research
+1 216 937 4374
andrew.batson@am.jll.com
Alex Westcott
Research Analyst
+1 502 394 2504
alex.westcott@am.jll.com
About JLL
JLL (NYSE: JLL) is a leading professional services firm that
specializes in real estate and investment management. Our vision
is to reimagine the world of real estate, creating rewarding
opportunities and amazing spaces where people can achieve
their ambitions. In doing so, we will build a better tomorrow for
our clients, our people and our communities. JLL is a Fortune 500
company with annual revenue of $16.3 billion, operations in over
80 countries and a global workforce of over 90,000 as of
December 31, 2018. JLL is the brand name, and a registered
trademark, of Jones Lang LaSalle Incorporated. For further
information, visit jll.com
About JLL Research
JLL’s research team delivers intelligence, analysis and insight
through market-leading reports and services that illuminate
today’s commercial real estate dynamics and identify tomorrow’s
challenges and opportunities. Our more than 400 global research
professionals track and analyze economic and property trends
and forecast future conditions in over 60 countries, producing
unrivalled local and global perspectives. Our research and
expertise, fueled by real-time information and innovative thinking
around the world, creates a competitive advantage for our clients
and drives successful strategies and optimal real estate
decisions.
© 2018 Jones Lang LaSalle IP, Inc. All rights reserved. All information contained herein is from sources deemed reliable; however, no representation or warranty is made to the accuracy thereof.

More Related Content

What's hot

JLL Cincinnati Industrial Outlook Q4 2020
JLL Cincinnati Industrial Outlook Q4 2020JLL Cincinnati Industrial Outlook Q4 2020
JLL Cincinnati Industrial Outlook Q4 2020Abby Armbruster
 
JLL Louisville Industrial Outlook - Q3 2018
JLL Louisville Industrial Outlook - Q3 2018JLL Louisville Industrial Outlook - Q3 2018
JLL Louisville Industrial Outlook - Q3 2018Alex Westcott
 
JLL Columbus Industrial Outlook - Q4 2020
JLL Columbus Industrial Outlook - Q4 2020JLL Columbus Industrial Outlook - Q4 2020
JLL Columbus Industrial Outlook - Q4 2020Emma Gresky
 
JLL Cincinnati Industrial Outlook Q3 2020
JLL Cincinnati Industrial Outlook Q3 2020JLL Cincinnati Industrial Outlook Q3 2020
JLL Cincinnati Industrial Outlook Q3 2020Abby Armbruster
 
JLL Louisville Industrial Outlook - Q1 2017
JLL Louisville Industrial Outlook - Q1 2017 JLL Louisville Industrial Outlook - Q1 2017
JLL Louisville Industrial Outlook - Q1 2017 Ross Bratcher
 
JLL Cleveland Industrial Outlook: Q3 2018
JLL Cleveland Industrial Outlook: Q3 2018JLL Cleveland Industrial Outlook: Q3 2018
JLL Cleveland Industrial Outlook: Q3 2018Andrew Batson
 
Jll cincinnati industrial outlook q1 2017
Jll cincinnati industrial outlook   q1 2017Jll cincinnati industrial outlook   q1 2017
Jll cincinnati industrial outlook q1 2017Abby Armbruster
 
Jll Louisville Industrial Outlook - Q1 2021
Jll Louisville Industrial Outlook - Q1 2021Jll Louisville Industrial Outlook - Q1 2021
Jll Louisville Industrial Outlook - Q1 2021Alex Westcott
 
JLL Cleveland Industrial Outlook: Q2 2020
JLL Cleveland Industrial Outlook: Q2 2020JLL Cleveland Industrial Outlook: Q2 2020
JLL Cleveland Industrial Outlook: Q2 2020Andrew Batson
 
JLL Cincinnati Industrial Outlook Q1 2021
JLL Cincinnati Industrial Outlook Q1 2021JLL Cincinnati Industrial Outlook Q1 2021
JLL Cincinnati Industrial Outlook Q1 2021Abby Armbruster
 
JLL Pittsburgh Industrial Insight & Statistics - Q3 2021
JLL Pittsburgh Industrial Insight & Statistics - Q3 2021JLL Pittsburgh Industrial Insight & Statistics - Q3 2021
JLL Pittsburgh Industrial Insight & Statistics - Q3 2021Tobiah Bilski
 
JLL Pittsburgh Industrial Insight & Statistics - Q4 2021
JLL Pittsburgh Industrial Insight & Statistics - Q4 2021JLL Pittsburgh Industrial Insight & Statistics - Q4 2021
JLL Pittsburgh Industrial Insight & Statistics - Q4 2021Tobiah Bilski
 
JLL Pittsburgh Industrial Insight & Statistics - Q2 2021
JLL Pittsburgh Industrial Insight & Statistics - Q2 2021JLL Pittsburgh Industrial Insight & Statistics - Q2 2021
JLL Pittsburgh Industrial Insight & Statistics - Q2 2021Tobiah Bilski
 
JLL Detroit Industrial Insight & Statistics - Q2 2017
JLL Detroit Industrial Insight & Statistics - Q2 2017JLL Detroit Industrial Insight & Statistics - Q2 2017
JLL Detroit Industrial Insight & Statistics - Q2 2017Harrison West
 
JLL Cleveland Industrial Outlook: Q4 2016
JLL Cleveland Industrial Outlook: Q4 2016JLL Cleveland Industrial Outlook: Q4 2016
JLL Cleveland Industrial Outlook: Q4 2016Andrew Batson
 
JLL Pittsburgh Industrial Insight & Statistics - Q2 2020
JLL Pittsburgh Industrial Insight & Statistics - Q2 2020JLL Pittsburgh Industrial Insight & Statistics - Q2 2020
JLL Pittsburgh Industrial Insight & Statistics - Q2 2020Tobiah Bilski
 
Cushman & Wakefield Q1 2017 Industrial Calgary Marketbeat
Cushman & Wakefield Q1 2017 Industrial Calgary MarketbeatCushman & Wakefield Q1 2017 Industrial Calgary Marketbeat
Cushman & Wakefield Q1 2017 Industrial Calgary MarketbeatNicole Chan
 
JLL Cleveland Industrial Outlook: Q4 2020
JLL Cleveland Industrial Outlook: Q4 2020JLL Cleveland Industrial Outlook: Q4 2020
JLL Cleveland Industrial Outlook: Q4 2020Andrew Batson
 
JLL Louisville Industrial Outlook - Q3 2016
JLL Louisville Industrial Outlook - Q3 2016JLL Louisville Industrial Outlook - Q3 2016
JLL Louisville Industrial Outlook - Q3 2016Ross Bratcher
 

What's hot (20)

JLL Cincinnati Industrial Outlook Q4 2020
JLL Cincinnati Industrial Outlook Q4 2020JLL Cincinnati Industrial Outlook Q4 2020
JLL Cincinnati Industrial Outlook Q4 2020
 
JLL Louisville Industrial Outlook - Q3 2018
JLL Louisville Industrial Outlook - Q3 2018JLL Louisville Industrial Outlook - Q3 2018
JLL Louisville Industrial Outlook - Q3 2018
 
JLL Columbus Industrial Outlook - Q4 2020
JLL Columbus Industrial Outlook - Q4 2020JLL Columbus Industrial Outlook - Q4 2020
JLL Columbus Industrial Outlook - Q4 2020
 
JLL Cincinnati Industrial Outlook Q3 2020
JLL Cincinnati Industrial Outlook Q3 2020JLL Cincinnati Industrial Outlook Q3 2020
JLL Cincinnati Industrial Outlook Q3 2020
 
JLL Louisville Industrial Outlook - Q1 2017
JLL Louisville Industrial Outlook - Q1 2017 JLL Louisville Industrial Outlook - Q1 2017
JLL Louisville Industrial Outlook - Q1 2017
 
JLL Cleveland Industrial Outlook: Q3 2018
JLL Cleveland Industrial Outlook: Q3 2018JLL Cleveland Industrial Outlook: Q3 2018
JLL Cleveland Industrial Outlook: Q3 2018
 
Jll cincinnati industrial outlook q1 2017
Jll cincinnati industrial outlook   q1 2017Jll cincinnati industrial outlook   q1 2017
Jll cincinnati industrial outlook q1 2017
 
Jll Louisville Industrial Outlook - Q1 2021
Jll Louisville Industrial Outlook - Q1 2021Jll Louisville Industrial Outlook - Q1 2021
Jll Louisville Industrial Outlook - Q1 2021
 
JLL Cleveland Industrial Outlook: Q2 2020
JLL Cleveland Industrial Outlook: Q2 2020JLL Cleveland Industrial Outlook: Q2 2020
JLL Cleveland Industrial Outlook: Q2 2020
 
JLL Cincinnati Industrial Outlook Q1 2021
JLL Cincinnati Industrial Outlook Q1 2021JLL Cincinnati Industrial Outlook Q1 2021
JLL Cincinnati Industrial Outlook Q1 2021
 
JLL Pittsburgh Industrial Insight & Statistics - Q3 2021
JLL Pittsburgh Industrial Insight & Statistics - Q3 2021JLL Pittsburgh Industrial Insight & Statistics - Q3 2021
JLL Pittsburgh Industrial Insight & Statistics - Q3 2021
 
JLL Pittsburgh Industrial Insight & Statistics - Q4 2021
JLL Pittsburgh Industrial Insight & Statistics - Q4 2021JLL Pittsburgh Industrial Insight & Statistics - Q4 2021
JLL Pittsburgh Industrial Insight & Statistics - Q4 2021
 
JLL Pittsburgh Industrial Insight & Statistics - Q2 2021
JLL Pittsburgh Industrial Insight & Statistics - Q2 2021JLL Pittsburgh Industrial Insight & Statistics - Q2 2021
JLL Pittsburgh Industrial Insight & Statistics - Q2 2021
 
JLL Detroit Industrial Insight & Statistics - Q2 2017
JLL Detroit Industrial Insight & Statistics - Q2 2017JLL Detroit Industrial Insight & Statistics - Q2 2017
JLL Detroit Industrial Insight & Statistics - Q2 2017
 
JLL Cleveland Industrial Outlook: Q4 2016
JLL Cleveland Industrial Outlook: Q4 2016JLL Cleveland Industrial Outlook: Q4 2016
JLL Cleveland Industrial Outlook: Q4 2016
 
JLL Pittsburgh Industrial Insight & Statistics - Q2 2020
JLL Pittsburgh Industrial Insight & Statistics - Q2 2020JLL Pittsburgh Industrial Insight & Statistics - Q2 2020
JLL Pittsburgh Industrial Insight & Statistics - Q2 2020
 
Cushman & Wakefield Q1 2017 Industrial Calgary Marketbeat
Cushman & Wakefield Q1 2017 Industrial Calgary MarketbeatCushman & Wakefield Q1 2017 Industrial Calgary Marketbeat
Cushman & Wakefield Q1 2017 Industrial Calgary Marketbeat
 
JLL Cleveland Industrial Outlook: Q4 2020
JLL Cleveland Industrial Outlook: Q4 2020JLL Cleveland Industrial Outlook: Q4 2020
JLL Cleveland Industrial Outlook: Q4 2020
 
Q2 2014 Austin Office Market Research Report
Q2 2014 Austin Office Market Research ReportQ2 2014 Austin Office Market Research Report
Q2 2014 Austin Office Market Research Report
 
JLL Louisville Industrial Outlook - Q3 2016
JLL Louisville Industrial Outlook - Q3 2016JLL Louisville Industrial Outlook - Q3 2016
JLL Louisville Industrial Outlook - Q3 2016
 

Similar to Louisville Industrial Outlook Analysis

JLL Louisville Industrial Outlook - Q4 2018
JLL Louisville Industrial Outlook - Q4 2018JLL Louisville Industrial Outlook - Q4 2018
JLL Louisville Industrial Outlook - Q4 2018Alex Westcott
 
JLL Louisville Industrial Outlook Q4 - 2018
JLL Louisville Industrial Outlook Q4 - 2018JLL Louisville Industrial Outlook Q4 - 2018
JLL Louisville Industrial Outlook Q4 - 2018Alex Westcott
 
JLL Louisville Industrial Outlook - Q1 2019
JLL Louisville Industrial Outlook - Q1 2019JLL Louisville Industrial Outlook - Q1 2019
JLL Louisville Industrial Outlook - Q1 2019Alex Westcott
 
JLL Louisville Industrial Outlook - Q1 2019
JLL Louisville Industrial Outlook - Q1 2019JLL Louisville Industrial Outlook - Q1 2019
JLL Louisville Industrial Outlook - Q1 2019Alex Westcott
 
JLL Louisville Industrial Outlook - Q3 2019
JLL Louisville Industrial Outlook - Q3 2019JLL Louisville Industrial Outlook - Q3 2019
JLL Louisville Industrial Outlook - Q3 2019Alex Westcott
 
JLL Louisville Industrial Outlook - Q3 2019
JLL Louisville Industrial Outlook - Q3 2019JLL Louisville Industrial Outlook - Q3 2019
JLL Louisville Industrial Outlook - Q3 2019Alex Westcott
 
JLL Louisville Industrial Outlook - Q3 2019
JLL Louisville Industrial Outlook - Q3 2019JLL Louisville Industrial Outlook - Q3 2019
JLL Louisville Industrial Outlook - Q3 2019Alex Westcott
 
Jll Louisville Industrial Outlook - Q1 2020
Jll Louisville Industrial Outlook - Q1 2020Jll Louisville Industrial Outlook - Q1 2020
Jll Louisville Industrial Outlook - Q1 2020Alex Westcott
 
Jll memphis industrial review q1 2017
Jll memphis industrial review q1 2017Jll memphis industrial review q1 2017
Jll memphis industrial review q1 2017Hensley Loeb
 
JLL Louisville Industrial Outlook - Q4 2016
JLL Louisville Industrial Outlook - Q4 2016JLL Louisville Industrial Outlook - Q4 2016
JLL Louisville Industrial Outlook - Q4 2016Ross Bratcher
 
JLL Louisville Office Outlook - Q2 2019
JLL Louisville Office Outlook - Q2 2019JLL Louisville Office Outlook - Q2 2019
JLL Louisville Office Outlook - Q2 2019Alex Westcott
 
JLL West Michigan Industrial Insight & Statistics - Q1 2020
JLL West Michigan Industrial Insight & Statistics - Q1 2020JLL West Michigan Industrial Insight & Statistics - Q1 2020
JLL West Michigan Industrial Insight & Statistics - Q1 2020Harrison West
 
JLL Detroit Industrial Insight & Statistics - Q1 2017
JLL Detroit Industrial Insight & Statistics - Q1 2017JLL Detroit Industrial Insight & Statistics - Q1 2017
JLL Detroit Industrial Insight & Statistics - Q1 2017Harrison West
 
JLL Cleveland Office Outlook: Q1 2018
JLL Cleveland Office Outlook: Q1 2018JLL Cleveland Office Outlook: Q1 2018
JLL Cleveland Office Outlook: Q1 2018Andrew Batson
 
JLL Cleveland Office Outlook: Q1 2018
JLL Cleveland Office Outlook: Q1 2018JLL Cleveland Office Outlook: Q1 2018
JLL Cleveland Office Outlook: Q1 2018Andrew Batson
 
JLL Cincinnati Industrial Outlook Q3 2017
JLL Cincinnati Industrial Outlook  Q3 2017JLL Cincinnati Industrial Outlook  Q3 2017
JLL Cincinnati Industrial Outlook Q3 2017Abby Armbruster
 
JLL Cleveland Industrial Outlook Q3 2017
JLL Cleveland Industrial Outlook Q3 2017JLL Cleveland Industrial Outlook Q3 2017
JLL Cleveland Industrial Outlook Q3 2017Andrew Batson
 
JLL Cleveland Industrial Outlook: Q3 2017
JLL Cleveland Industrial Outlook: Q3 2017JLL Cleveland Industrial Outlook: Q3 2017
JLL Cleveland Industrial Outlook: Q3 2017Andrew Batson
 
JLL Cleveland Industrial Outlook: Q4 2018
JLL Cleveland Industrial Outlook: Q4 2018JLL Cleveland Industrial Outlook: Q4 2018
JLL Cleveland Industrial Outlook: Q4 2018Andrew Batson
 
JLL Cleveland Industrial Outlook: Q4 2018
JLL Cleveland Industrial Outlook: Q4 2018JLL Cleveland Industrial Outlook: Q4 2018
JLL Cleveland Industrial Outlook: Q4 2018Andrew Batson
 

Similar to Louisville Industrial Outlook Analysis (20)

JLL Louisville Industrial Outlook - Q4 2018
JLL Louisville Industrial Outlook - Q4 2018JLL Louisville Industrial Outlook - Q4 2018
JLL Louisville Industrial Outlook - Q4 2018
 
JLL Louisville Industrial Outlook Q4 - 2018
JLL Louisville Industrial Outlook Q4 - 2018JLL Louisville Industrial Outlook Q4 - 2018
JLL Louisville Industrial Outlook Q4 - 2018
 
JLL Louisville Industrial Outlook - Q1 2019
JLL Louisville Industrial Outlook - Q1 2019JLL Louisville Industrial Outlook - Q1 2019
JLL Louisville Industrial Outlook - Q1 2019
 
JLL Louisville Industrial Outlook - Q1 2019
JLL Louisville Industrial Outlook - Q1 2019JLL Louisville Industrial Outlook - Q1 2019
JLL Louisville Industrial Outlook - Q1 2019
 
JLL Louisville Industrial Outlook - Q3 2019
JLL Louisville Industrial Outlook - Q3 2019JLL Louisville Industrial Outlook - Q3 2019
JLL Louisville Industrial Outlook - Q3 2019
 
JLL Louisville Industrial Outlook - Q3 2019
JLL Louisville Industrial Outlook - Q3 2019JLL Louisville Industrial Outlook - Q3 2019
JLL Louisville Industrial Outlook - Q3 2019
 
JLL Louisville Industrial Outlook - Q3 2019
JLL Louisville Industrial Outlook - Q3 2019JLL Louisville Industrial Outlook - Q3 2019
JLL Louisville Industrial Outlook - Q3 2019
 
Jll Louisville Industrial Outlook - Q1 2020
Jll Louisville Industrial Outlook - Q1 2020Jll Louisville Industrial Outlook - Q1 2020
Jll Louisville Industrial Outlook - Q1 2020
 
Jll memphis industrial review q1 2017
Jll memphis industrial review q1 2017Jll memphis industrial review q1 2017
Jll memphis industrial review q1 2017
 
JLL Louisville Industrial Outlook - Q4 2016
JLL Louisville Industrial Outlook - Q4 2016JLL Louisville Industrial Outlook - Q4 2016
JLL Louisville Industrial Outlook - Q4 2016
 
JLL Louisville Office Outlook - Q2 2019
JLL Louisville Office Outlook - Q2 2019JLL Louisville Office Outlook - Q2 2019
JLL Louisville Office Outlook - Q2 2019
 
JLL West Michigan Industrial Insight & Statistics - Q1 2020
JLL West Michigan Industrial Insight & Statistics - Q1 2020JLL West Michigan Industrial Insight & Statistics - Q1 2020
JLL West Michigan Industrial Insight & Statistics - Q1 2020
 
JLL Detroit Industrial Insight & Statistics - Q1 2017
JLL Detroit Industrial Insight & Statistics - Q1 2017JLL Detroit Industrial Insight & Statistics - Q1 2017
JLL Detroit Industrial Insight & Statistics - Q1 2017
 
JLL Cleveland Office Outlook: Q1 2018
JLL Cleveland Office Outlook: Q1 2018JLL Cleveland Office Outlook: Q1 2018
JLL Cleveland Office Outlook: Q1 2018
 
JLL Cleveland Office Outlook: Q1 2018
JLL Cleveland Office Outlook: Q1 2018JLL Cleveland Office Outlook: Q1 2018
JLL Cleveland Office Outlook: Q1 2018
 
JLL Cincinnati Industrial Outlook Q3 2017
JLL Cincinnati Industrial Outlook  Q3 2017JLL Cincinnati Industrial Outlook  Q3 2017
JLL Cincinnati Industrial Outlook Q3 2017
 
JLL Cleveland Industrial Outlook Q3 2017
JLL Cleveland Industrial Outlook Q3 2017JLL Cleveland Industrial Outlook Q3 2017
JLL Cleveland Industrial Outlook Q3 2017
 
JLL Cleveland Industrial Outlook: Q3 2017
JLL Cleveland Industrial Outlook: Q3 2017JLL Cleveland Industrial Outlook: Q3 2017
JLL Cleveland Industrial Outlook: Q3 2017
 
JLL Cleveland Industrial Outlook: Q4 2018
JLL Cleveland Industrial Outlook: Q4 2018JLL Cleveland Industrial Outlook: Q4 2018
JLL Cleveland Industrial Outlook: Q4 2018
 
JLL Cleveland Industrial Outlook: Q4 2018
JLL Cleveland Industrial Outlook: Q4 2018JLL Cleveland Industrial Outlook: Q4 2018
JLL Cleveland Industrial Outlook: Q4 2018
 

More from Alex Westcott

JLL Louisville Office Outlook - Q4 2020
JLL Louisville Office Outlook - Q4 2020JLL Louisville Office Outlook - Q4 2020
JLL Louisville Office Outlook - Q4 2020Alex Westcott
 
JLL Louisville Office Outlook - Q4 2019
JLL Louisville Office Outlook - Q4 2019JLL Louisville Office Outlook - Q4 2019
JLL Louisville Office Outlook - Q4 2019Alex Westcott
 
JLL Louisville Office Outlook - Q3 2019
JLL Louisville Office Outlook - Q3 2019JLL Louisville Office Outlook - Q3 2019
JLL Louisville Office Outlook - Q3 2019Alex Westcott
 
JLL Louisville Office Outlook - Q1 2019
JLL Louisville Office Outlook - Q1 2019JLL Louisville Office Outlook - Q1 2019
JLL Louisville Office Outlook - Q1 2019Alex Westcott
 
JLL Louisville Office Outlook - Q4 2018
JLL Louisville Office Outlook - Q4 2018JLL Louisville Office Outlook - Q4 2018
JLL Louisville Office Outlook - Q4 2018Alex Westcott
 
JLL Louisville Office Outlook - Q3 2018
JLL Louisville Office Outlook - Q3 2018JLL Louisville Office Outlook - Q3 2018
JLL Louisville Office Outlook - Q3 2018Alex Westcott
 
JLL Louisville Industrial Outlook - Q2 2018
JLL Louisville Industrial Outlook - Q2 2018JLL Louisville Industrial Outlook - Q2 2018
JLL Louisville Industrial Outlook - Q2 2018Alex Westcott
 
JLL Louisville Office Outlook - Q2 2018
JLL Louisville Office Outlook - Q2 2018JLL Louisville Office Outlook - Q2 2018
JLL Louisville Office Outlook - Q2 2018Alex Westcott
 
JLL Louisville Office Outlook Q4 2017
JLL Louisville Office Outlook Q4 2017JLL Louisville Office Outlook Q4 2017
JLL Louisville Office Outlook Q4 2017Alex Westcott
 

More from Alex Westcott (9)

JLL Louisville Office Outlook - Q4 2020
JLL Louisville Office Outlook - Q4 2020JLL Louisville Office Outlook - Q4 2020
JLL Louisville Office Outlook - Q4 2020
 
JLL Louisville Office Outlook - Q4 2019
JLL Louisville Office Outlook - Q4 2019JLL Louisville Office Outlook - Q4 2019
JLL Louisville Office Outlook - Q4 2019
 
JLL Louisville Office Outlook - Q3 2019
JLL Louisville Office Outlook - Q3 2019JLL Louisville Office Outlook - Q3 2019
JLL Louisville Office Outlook - Q3 2019
 
JLL Louisville Office Outlook - Q1 2019
JLL Louisville Office Outlook - Q1 2019JLL Louisville Office Outlook - Q1 2019
JLL Louisville Office Outlook - Q1 2019
 
JLL Louisville Office Outlook - Q4 2018
JLL Louisville Office Outlook - Q4 2018JLL Louisville Office Outlook - Q4 2018
JLL Louisville Office Outlook - Q4 2018
 
JLL Louisville Office Outlook - Q3 2018
JLL Louisville Office Outlook - Q3 2018JLL Louisville Office Outlook - Q3 2018
JLL Louisville Office Outlook - Q3 2018
 
JLL Louisville Industrial Outlook - Q2 2018
JLL Louisville Industrial Outlook - Q2 2018JLL Louisville Industrial Outlook - Q2 2018
JLL Louisville Industrial Outlook - Q2 2018
 
JLL Louisville Office Outlook - Q2 2018
JLL Louisville Office Outlook - Q2 2018JLL Louisville Office Outlook - Q2 2018
JLL Louisville Office Outlook - Q2 2018
 
JLL Louisville Office Outlook Q4 2017
JLL Louisville Office Outlook Q4 2017JLL Louisville Office Outlook Q4 2017
JLL Louisville Office Outlook Q4 2017
 

Recently uploaded

Call Girls In Madipur Metro Delhi꧁ +91)8447779280꧂Low Rate 2 short 2000 full ...
Call Girls In Madipur Metro Delhi꧁ +91)8447779280꧂Low Rate 2 short 2000 full ...Call Girls In Madipur Metro Delhi꧁ +91)8447779280꧂Low Rate 2 short 2000 full ...
Call Girls In Madipur Metro Delhi꧁ +91)8447779280꧂Low Rate 2 short 2000 full ...asmaqueen5
 
Listing Turkey Sylvana Istanbul - Bahcesehir
Listing Turkey Sylvana Istanbul - BahcesehirListing Turkey Sylvana Istanbul - Bahcesehir
Listing Turkey Sylvana Istanbul - BahcesehirListing Turkey
 
Low Rate Call Girls in Triveni Complex Delhi Call 9990771857
Low Rate Call Girls in Triveni Complex Delhi Call 9990771857Low Rate Call Girls in Triveni Complex Delhi Call 9990771857
Low Rate Call Girls in Triveni Complex Delhi Call 9990771857delhimodel235
 
Low Rate Call Girls In Madipur Slum Quarter +91)8447779280Low Rate 2 short 2...
Low Rate Call Girls In Madipur Slum Quarter  +91)8447779280Low Rate 2 short 2...Low Rate Call Girls In Madipur Slum Quarter  +91)8447779280Low Rate 2 short 2...
Low Rate Call Girls In Madipur Slum Quarter +91)8447779280Low Rate 2 short 2...asmaqueen5
 
Purva Palm Hills Devanahalli, Bangalore E- Brochure.pdf
Purva Palm Hills Devanahalli, Bangalore E- Brochure.pdfPurva Palm Hills Devanahalli, Bangalore E- Brochure.pdf
Purva Palm Hills Devanahalli, Bangalore E- Brochure.pdffaheemali990101
 
Low Rate Call Girls in Akshardham Delhi Call 9990771857
Low Rate Call Girls in Akshardham   Delhi Call 9990771857Low Rate Call Girls in Akshardham   Delhi Call 9990771857
Low Rate Call Girls in Akshardham Delhi Call 9990771857delhimodel235
 
9990771857 Call Girls in Noida Sector 11 Noida (Call Girls) Delhi
9990771857 Call Girls in Noida Sector 11 Noida (Call Girls) Delhi9990771857 Call Girls in Noida Sector 11 Noida (Call Girls) Delhi
9990771857 Call Girls in Noida Sector 11 Noida (Call Girls) Delhidelhimodel235
 
The Omaxe State Dwarka Delhi-broucher.pdf.pdf
The Omaxe State Dwarka Delhi-broucher.pdf.pdfThe Omaxe State Dwarka Delhi-broucher.pdf.pdf
The Omaxe State Dwarka Delhi-broucher.pdf.pdfkratirudram
 
Rustomjee The Panorama At Pali Hill, Bandra West, Mumbai - Brochure.pdf
Rustomjee The Panorama At Pali Hill, Bandra West, Mumbai - Brochure.pdfRustomjee The Panorama At Pali Hill, Bandra West, Mumbai - Brochure.pdf
Rustomjee The Panorama At Pali Hill, Bandra West, Mumbai - Brochure.pdfmonikasharma630
 
Call Girls in shastri nagar Delhi 8264348440 ✅ call girls ❤️
Call Girls in shastri nagar Delhi 8264348440 ✅ call girls ❤️Call Girls in shastri nagar Delhi 8264348440 ✅ call girls ❤️
Call Girls in shastri nagar Delhi 8264348440 ✅ call girls ❤️soniya singh
 
Call Girls In Mayur Vihar-1 Delhi ❤️8860477959 Good Looking Escorts In 24/7 D...
Call Girls In Mayur Vihar-1 Delhi ❤️8860477959 Good Looking Escorts In 24/7 D...Call Girls In Mayur Vihar-1 Delhi ❤️8860477959 Good Looking Escorts In 24/7 D...
Call Girls In Mayur Vihar-1 Delhi ❤️8860477959 Good Looking Escorts In 24/7 D...lizamodels9
 
Call Girls in Sarai Kale Khan Delhi 💯Call Us 🔝8264348440🔝
Call Girls in Sarai Kale Khan Delhi 💯Call Us 🔝8264348440🔝Call Girls in Sarai Kale Khan Delhi 💯Call Us 🔝8264348440🔝
Call Girls in Sarai Kale Khan Delhi 💯Call Us 🔝8264348440🔝soniya singh
 
Telibagh & Call Girls Lucknow - 450+ Call Girl Cash Payment 🎂 8923113531 🎪 Ne...
Telibagh & Call Girls Lucknow - 450+ Call Girl Cash Payment 🎂 8923113531 🎪 Ne...Telibagh & Call Girls Lucknow - 450+ Call Girl Cash Payment 🎂 8923113531 🎪 Ne...
Telibagh & Call Girls Lucknow - 450+ Call Girl Cash Payment 🎂 8923113531 🎪 Ne...gurkirankumar98700
 
Call Girls in Janakpuri ↫8447779280↫Short 1500 Night 6000-Escorts Service In ...
Call Girls in Janakpuri ↫8447779280↫Short 1500 Night 6000-Escorts Service In ...Call Girls in Janakpuri ↫8447779280↫Short 1500 Night 6000-Escorts Service In ...
Call Girls in Janakpuri ↫8447779280↫Short 1500 Night 6000-Escorts Service In ...asmaqueen5
 
Call Girls In The Lalit New Delhi ❤️8860477959 Good Looking Escorts In 24/7 D...
Call Girls In The Lalit New Delhi ❤️8860477959 Good Looking Escorts In 24/7 D...Call Girls In The Lalit New Delhi ❤️8860477959 Good Looking Escorts In 24/7 D...
Call Girls In The Lalit New Delhi ❤️8860477959 Good Looking Escorts In 24/7 D...lizamodels9
 
9711199012 Call {Girls Delhi} Very Low rate Vaishali DownLoad PDF
9711199012 Call {Girls Delhi} Very Low rate Vaishali DownLoad PDF9711199012 Call {Girls Delhi} Very Low rate Vaishali DownLoad PDF
9711199012 Call {Girls Delhi} Very Low rate Vaishali DownLoad PDFMs Riya
 
9990771857 Call Girls in Noida Sector 03 Noida (Call Girls) Delhi
9990771857 Call Girls in Noida Sector 03 Noida (Call Girls) Delhi9990771857 Call Girls in Noida Sector 03 Noida (Call Girls) Delhi
9990771857 Call Girls in Noida Sector 03 Noida (Call Girls) Delhidelhimodel235
 
Call Girls In Mundka Industrial Metro@꧂8447779280 ↬Enjoy ꧂Escort Service in ...
Call Girls In Mundka Industrial Metro@꧂8447779280 ↬Enjoy ꧂Escort Service in  ...Call Girls In Mundka Industrial Metro@꧂8447779280 ↬Enjoy ꧂Escort Service in  ...
Call Girls In Mundka Industrial Metro@꧂8447779280 ↬Enjoy ꧂Escort Service in ...asmaqueen5
 
9990771857 Call Girls in Noida Sector 1 Noida (Call Girls) Delhi
9990771857 Call Girls in Noida Sector 1 Noida (Call Girls) Delhi9990771857 Call Girls in Noida Sector 1 Noida (Call Girls) Delhi
9990771857 Call Girls in Noida Sector 1 Noida (Call Girls) Delhidelhimodel235
 
SSPL The Strand Abodes Kharadi Pune Brochure.pdf
SSPL The Strand Abodes Kharadi Pune Brochure.pdfSSPL The Strand Abodes Kharadi Pune Brochure.pdf
SSPL The Strand Abodes Kharadi Pune Brochure.pdfabbu831446
 

Recently uploaded (20)

Call Girls In Madipur Metro Delhi꧁ +91)8447779280꧂Low Rate 2 short 2000 full ...
Call Girls In Madipur Metro Delhi꧁ +91)8447779280꧂Low Rate 2 short 2000 full ...Call Girls In Madipur Metro Delhi꧁ +91)8447779280꧂Low Rate 2 short 2000 full ...
Call Girls In Madipur Metro Delhi꧁ +91)8447779280꧂Low Rate 2 short 2000 full ...
 
Listing Turkey Sylvana Istanbul - Bahcesehir
Listing Turkey Sylvana Istanbul - BahcesehirListing Turkey Sylvana Istanbul - Bahcesehir
Listing Turkey Sylvana Istanbul - Bahcesehir
 
Low Rate Call Girls in Triveni Complex Delhi Call 9990771857
Low Rate Call Girls in Triveni Complex Delhi Call 9990771857Low Rate Call Girls in Triveni Complex Delhi Call 9990771857
Low Rate Call Girls in Triveni Complex Delhi Call 9990771857
 
Low Rate Call Girls In Madipur Slum Quarter +91)8447779280Low Rate 2 short 2...
Low Rate Call Girls In Madipur Slum Quarter  +91)8447779280Low Rate 2 short 2...Low Rate Call Girls In Madipur Slum Quarter  +91)8447779280Low Rate 2 short 2...
Low Rate Call Girls In Madipur Slum Quarter +91)8447779280Low Rate 2 short 2...
 
Purva Palm Hills Devanahalli, Bangalore E- Brochure.pdf
Purva Palm Hills Devanahalli, Bangalore E- Brochure.pdfPurva Palm Hills Devanahalli, Bangalore E- Brochure.pdf
Purva Palm Hills Devanahalli, Bangalore E- Brochure.pdf
 
Low Rate Call Girls in Akshardham Delhi Call 9990771857
Low Rate Call Girls in Akshardham   Delhi Call 9990771857Low Rate Call Girls in Akshardham   Delhi Call 9990771857
Low Rate Call Girls in Akshardham Delhi Call 9990771857
 
9990771857 Call Girls in Noida Sector 11 Noida (Call Girls) Delhi
9990771857 Call Girls in Noida Sector 11 Noida (Call Girls) Delhi9990771857 Call Girls in Noida Sector 11 Noida (Call Girls) Delhi
9990771857 Call Girls in Noida Sector 11 Noida (Call Girls) Delhi
 
The Omaxe State Dwarka Delhi-broucher.pdf.pdf
The Omaxe State Dwarka Delhi-broucher.pdf.pdfThe Omaxe State Dwarka Delhi-broucher.pdf.pdf
The Omaxe State Dwarka Delhi-broucher.pdf.pdf
 
Rustomjee The Panorama At Pali Hill, Bandra West, Mumbai - Brochure.pdf
Rustomjee The Panorama At Pali Hill, Bandra West, Mumbai - Brochure.pdfRustomjee The Panorama At Pali Hill, Bandra West, Mumbai - Brochure.pdf
Rustomjee The Panorama At Pali Hill, Bandra West, Mumbai - Brochure.pdf
 
Call Girls in shastri nagar Delhi 8264348440 ✅ call girls ❤️
Call Girls in shastri nagar Delhi 8264348440 ✅ call girls ❤️Call Girls in shastri nagar Delhi 8264348440 ✅ call girls ❤️
Call Girls in shastri nagar Delhi 8264348440 ✅ call girls ❤️
 
Call Girls In Mayur Vihar-1 Delhi ❤️8860477959 Good Looking Escorts In 24/7 D...
Call Girls In Mayur Vihar-1 Delhi ❤️8860477959 Good Looking Escorts In 24/7 D...Call Girls In Mayur Vihar-1 Delhi ❤️8860477959 Good Looking Escorts In 24/7 D...
Call Girls In Mayur Vihar-1 Delhi ❤️8860477959 Good Looking Escorts In 24/7 D...
 
Call Girls in Sarai Kale Khan Delhi 💯Call Us 🔝8264348440🔝
Call Girls in Sarai Kale Khan Delhi 💯Call Us 🔝8264348440🔝Call Girls in Sarai Kale Khan Delhi 💯Call Us 🔝8264348440🔝
Call Girls in Sarai Kale Khan Delhi 💯Call Us 🔝8264348440🔝
 
Telibagh & Call Girls Lucknow - 450+ Call Girl Cash Payment 🎂 8923113531 🎪 Ne...
Telibagh & Call Girls Lucknow - 450+ Call Girl Cash Payment 🎂 8923113531 🎪 Ne...Telibagh & Call Girls Lucknow - 450+ Call Girl Cash Payment 🎂 8923113531 🎪 Ne...
Telibagh & Call Girls Lucknow - 450+ Call Girl Cash Payment 🎂 8923113531 🎪 Ne...
 
Call Girls in Janakpuri ↫8447779280↫Short 1500 Night 6000-Escorts Service In ...
Call Girls in Janakpuri ↫8447779280↫Short 1500 Night 6000-Escorts Service In ...Call Girls in Janakpuri ↫8447779280↫Short 1500 Night 6000-Escorts Service In ...
Call Girls in Janakpuri ↫8447779280↫Short 1500 Night 6000-Escorts Service In ...
 
Call Girls In The Lalit New Delhi ❤️8860477959 Good Looking Escorts In 24/7 D...
Call Girls In The Lalit New Delhi ❤️8860477959 Good Looking Escorts In 24/7 D...Call Girls In The Lalit New Delhi ❤️8860477959 Good Looking Escorts In 24/7 D...
Call Girls In The Lalit New Delhi ❤️8860477959 Good Looking Escorts In 24/7 D...
 
9711199012 Call {Girls Delhi} Very Low rate Vaishali DownLoad PDF
9711199012 Call {Girls Delhi} Very Low rate Vaishali DownLoad PDF9711199012 Call {Girls Delhi} Very Low rate Vaishali DownLoad PDF
9711199012 Call {Girls Delhi} Very Low rate Vaishali DownLoad PDF
 
9990771857 Call Girls in Noida Sector 03 Noida (Call Girls) Delhi
9990771857 Call Girls in Noida Sector 03 Noida (Call Girls) Delhi9990771857 Call Girls in Noida Sector 03 Noida (Call Girls) Delhi
9990771857 Call Girls in Noida Sector 03 Noida (Call Girls) Delhi
 
Call Girls In Mundka Industrial Metro@꧂8447779280 ↬Enjoy ꧂Escort Service in ...
Call Girls In Mundka Industrial Metro@꧂8447779280 ↬Enjoy ꧂Escort Service in  ...Call Girls In Mundka Industrial Metro@꧂8447779280 ↬Enjoy ꧂Escort Service in  ...
Call Girls In Mundka Industrial Metro@꧂8447779280 ↬Enjoy ꧂Escort Service in ...
 
9990771857 Call Girls in Noida Sector 1 Noida (Call Girls) Delhi
9990771857 Call Girls in Noida Sector 1 Noida (Call Girls) Delhi9990771857 Call Girls in Noida Sector 1 Noida (Call Girls) Delhi
9990771857 Call Girls in Noida Sector 1 Noida (Call Girls) Delhi
 
SSPL The Strand Abodes Kharadi Pune Brochure.pdf
SSPL The Strand Abodes Kharadi Pune Brochure.pdfSSPL The Strand Abodes Kharadi Pune Brochure.pdf
SSPL The Strand Abodes Kharadi Pune Brochure.pdf
 

Louisville Industrial Outlook Analysis

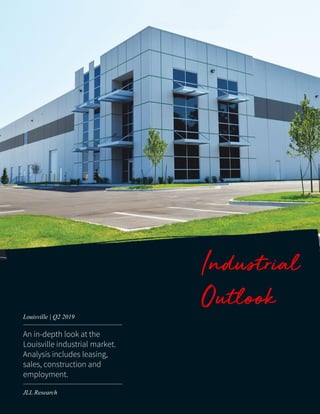
  • 1. Industrial Outlook An in-depth look at the Louisville industrial market. Analysis includes leasing, sales, construction and employment. Louisville | Q2 2019 JLL Research
  • 2. © 2017 Jones Lang LaSalle IP, Inc. All rights reserved. All information contained herein is from sources deemed reliable; however, no representation or warranty is made to the accuracy thereof. Q2 2019 Insight Louisville Industrial Outlook Leasing in the second quarter slowed slightly as availabilities remain somewhat limited. APL signed the biggest lease of the quarter taking the 527,250-square-foot building at 700 Omega Parkway and will relocate in late 2019 from their current 382,000-square-foot facility. Medline has transitioned from 1065 Conestoga Parkway to their build-to-suit in River Ridge. They will occupy 900,000 square feet and lease the remaining 200,000 square feet, short term. Institutional activity continued in Louisville with three transactions this quarter. IAC purchased the 325,000-square-foot building at 9101 Minor Lane for $77.00 per square foot and Stoltz purchased the 210,000-square-foot building at 5101 Jeff Commerce Boulevard for $85.00 per square foot. Said buildings are currently leased to Amazon and McKesson, respectively and transferred at 5.2 percent and 5.1 percent cap rates. Additionally, MDH purchased Park 65 Business Center that is 60.0 percent vacant for over $60.00 per square foot and Tratt purchased 301 Logistics in River Ridge that is nearly 30% vacant. As expected development announcements have continued to gain momentum. Several institutional developers have secured land positions that could introduce over 3-million square feet to the market in the next 9 to 18 months. Outlook Despite the slowdown in leasing the Louisville market remains strong. The unprecedented absorption of the past 12-months was unsustainable in the long term given the lack of product being delivered. However, interest in both purchasing and spec development continues to show the viability of Louisville as a major market for institutional players within the industrial sector. Fundamentals Forecast YTD net absorption 3,347,497 s.f. ▼ QTD net absorption 1,189,080 s.f. ▼ Under construction 2,175,768 s.f. ▼ Total vacancy 6.99 % ▼ Average asking rent (NNN) $3.90 p.s.f. ▲ Tenant improvements Stable ▶ 0 4,000,000 8,000,000 2015 2016 2017 2018 2019 Supply and demand (s.f.) Net absorption Deliveries Strong institutional investment interest continues 5.7% 8.7% 11.7% 9.4% 7.0% 2015 2016 2017 2018 2019 Total vacancy $3.20 $3.40 $3.60 $3.80 $4.00 2014 2015 2016 2017 2018 2019 Average asking rents ($/s.f.) © 2019 Jones Lang LaSalle IP, Inc. All rights reserved. All information contained herein is from sources deemed reliable; however, no representation or warranty is made to the accuracy thereof. Top trends and activity • Stoltz and IAC purchased fully leased assets in the Airport submarkets. • MDH purchased the 60% vacant Park 65 Business Center. • Modern bulk vacancy dipped below 7.00 percent, continuing a downward trend.
  • 3. © 2017 Jones Lang LaSalle IP, Inc. All rights reserved. All information contained herein is from sources deemed reliable; however, no representation or warranty is made to the accuracy thereof. Inventory (s.f.) YTD total net absorption (s.f.) YTD total net absorption (% of inventory) Total Vacancy (%) Average total asking rent ($ p.s.f.) YTD completions (s.f.) Under construction (s.f.) Airport 24,304,863 1,607,500 6.6% 3.2% $4.11 447,000 834,728 Bullitt County 13,647,026 -302,500 -2.2% 12.4% $4.06 0 572,000 East 5,985,608 0 0.0% 0.0% $5.95 0 150,040 Riverport 12,557,133 636,380 5.1% 7.0% $3.62 230,000 0 Southern Indiana 11,316,172 1,406,117 12.4% 12.2% $3.76 1,100,000 619,000 Louisville Totals 67,810,802 3,347,497 4.9% 7.0% $3.90 1,777,000 2,175,768 Analyzes all industrial buidings greater than 100,000 s.f. with a minimum clear height of 24' 2,234,648 1,934,181 2,059,001 2,742,889 3,029,702 3,843,783 2,568,298 5,710,124 3,347,497 0 1,000,000 2,000,000 3,000,000 4,000,000 5,000,000 6,000,000 2011 2012 2013 2014 2015 2016 2017 2018 Q2 2019 Q2 2019 Statistics Louisville Industrial Outlook 9.2% 8.3% 7.2% 6.6% 5.7% 8.7% 11.7% 9.4% 7.0% 2.0% 5.0% 8.0% 11.0% 14.0% 2011 2012 2013 2014 2015 2016 2017 2018 Q2 2019 © 2019 Jones Lang LaSalle IP, Inc. All rights reserved. All information contained herein is from sources deemed reliable; however, no representation or warranty is made to the accuracy thereof. Total Vacancy Rate % Total Net Absorption
  • 4. © 2017 Jones Lang LaSalle IP, Inc. All rights reserved. All information contained herein is from sources deemed reliable; however, no representation or warranty is made to the accuracy thereof. $187,037,809 10 $68 5.75%-6.25% 98.5% 2.5% Top sales transactions last 12 months Size (s.f.) $ p.s.f. Sale date 2621 Technology Drive WPT Industrial REIT WPT Capital Advisors 224,000 $17,900,000 $80 Sep-18 120 Velocity Way Granite Capital Browning 721,000 $68 Dec-18 7251 Logistics Drive Paul & Eleanor Sade Trust Panattoni 356,000 $66 May-18 250 Hilton Drive GLP Van Trust 592,800 $38,400,000 $65 Apr-18 857 Park Loop Road* Colony Capital Dermody 546,000 $26,489,801 $47 Feb-19 Dream Industrial REIT Transwestern 302,500 $13,491,668 $45 Feb-19 1234 Gardiner Lane GSK Properties 162,000 $4,610,000 $28 Dec-18 Sales price $ 12 month sales volume $ by submarket $48,696,340 *Purchased as part of portfolio Dry Ridge Capital $23,500,000 3208 E. Blue Lick Road* Building address Buyer company Transactions details Seller company Average Class A sale price p.s.f. 12 month transaction volume at a glance Total volume Number of transactions Average Class A cap rate Sales activity by building type last 12 months Warehouse/Dist. sales volume as % of total Manufacturing sales volume as % of total Top sellers (s.f.)Top buyers (s.f.) $182,287,809 $4,750,000 0 s.f. 500,000 s.f. 1,000,000 s.f. 1,500,000 s.f. 2,000,000 s.f. 2,500,000 s.f. 3,000,000 s.f. 3,500,000 s.f. $0 $50,000,000 $100,000,000 $150,000,000 $200,000,000 Warehouse / Distribution Manufacturing Sum of Price ($) Sum of RBA (SF) 20% 16% 15%13% 10% 8% 6% Granite GLP Colony Capital Sazerac Paul & Eleanor Sade Trust Dream Industrial REIT WPT Industrial REIT GSK Properties Sperber Familly Trust Greif 20% 16% 15%13% 10% 8% 6% Browning Van Trust Dermody New Mill Capital Holdings Panattoni Transwestern WPT Capital Advisors Dry Ridge Capital Atalaya Investments Alemap $88,677,809 $43,150,000 $27,200,000 $17,900,000 $10,110,000 Bullitt County Southern Indiana Riverport East Airport Q2 2019 Sales Louisville Industrial Outlook This report analyzes all industrial sales > 75,000 s.f. year-to-date © 2019 Jones Lang LaSalle IP, Inc. All rights reserved. All information contained herein is from sources deemed reliable; however, no representation or warranty is made to the accuracy thereof. $187,037,809 10 $68 5.75%-6.25% 98.5% 2.5% Top sales transactions last 12 months Size (s.f.) $ p.s.f. Sale date 2621 Technology Drive WPT Industrial REIT WPT Capital Advisors 224,000 $17,900,000 $80 Sep-18 120 Velocity Way Granite Capital Browning 721,000 $68 Dec-18 7251 Logistics Drive Paul & Eleanor Sade Trust Panattoni 356,000 $66 May-18 250 Hilton Drive GLP Van Trust 592,800 $38,400,000 $65 Apr-18 857 Park Loop Road* Colony Capital Dermody 546,000 $26,489,801 $47 Feb-19 Dream Industrial REIT Transwestern 302,500 $13,491,668 $45 Feb-19 1234 Gardiner Lane GSK Properties 162,000 $4,610,000 $28 Dec-18 Sales price $ 12 month sales volume $ by submarket $48,696,340 *Purchased as part of portfolio Dry Ridge Capital $23,500,000 3208 E. Blue Lick Road* Building address Buyer company Transactions details Seller company Average Class A sale price p.s.f. 12 month transaction volume at a glance Total volume Number of transactions Average Class A cap rate Sales activity by building type last 12 months Warehouse/Dist. sales volume as % of total Manufacturing sales volume as % of total Top sellers (s.f.)Top buyers (s.f.) $182,287,809 $4,750,000 0 s.f. 500,000 s.f. 1,000,000 s.f. 1,500,000 s.f. 2,000,000 s.f. 2,500,000 s.f. 3,000,000 s.f. 3,500,000 s.f. $0 $50,000,000 $100,000,000 $150,000,000 $200,000,000 Warehouse / Distribution Manufacturing Sum of Price ($) Sum of RBA (SF) 20% 16% 15%13% 10% 8% 6% Granite GLP Colony Capital Sazerac Paul & Eleanor Sade Trust Dream Industrial REIT WPT Industrial REIT GSK Properties Sperber Familly Trust Greif 20% 16% 15%13% 10% 8% 6% Browning Van Trust Dermody New Mill Capital Holdings Panattoni Transwestern WPT Capital Advisors Dry Ridge Capital Atalaya Investments Alemap $88,677,809 $43,150,000 $27,200,000 $17,900,000 $10,110,000 Bullitt County Southern Indiana Riverport East Airport $179,237,809 10 $66 5.00% - 5.75% 100.0% 0.0% Top sales transactions last 12 months Size (s.f.) $ p.s.f. Sale date Stoltz Real Estate Jefferson United 210,000 $17,850,000 $85 May-19 WPT Industrial REIT WPT Capital Advisors 224,000 $17,900,000 $80 Sep-18 9101 Minor Lane IAC 324,991 $77 May-19 120 Velocity Way Granite Capital Browning 721,000 $68 Dec-18 100 Brooks Way MDH 259,960 $16,500,000 $64 May-19 857 Park Loop Road* Colony Capital Dermody 546,000 $26,489,801 $47 Feb-19 Dream Industrial REIT Transwestern 302,500 $13,491,668 $45 Feb-19 2621 Technology Drive 5101 Jeff Commerce Drive $48,696,340 Kelly Development 3208 E. Blue Lick Road* *Purchased as part of portfolio Building address Buyer company Transactions details Seller company 12 month sales volume $ by submarket Average Class A sale price p.s.f. 12 month transaction volume at a glance Total volume Number of transactions Average Class A cap rate range Sales activity by building type last 12 months Warehouse/Dist. sales volume as % of total Manufacturing sales volume as % of total Johnson Development Top sellers (s.f.)Top buyers (s.f.) Sales price $ $24,500,000 $179,237,809 3,007,971 s.f. 0 s.f. 500,000 s.f. 1,000,000 s.f. 1,500,000 s.f. 2,000,000 s.f. 2,500,000 s.f. 3,000,000 s.f. 3,500,000 s.f. $0 $50,000,000 $100,000,000 $150,000,000 $200,000,000 Warehouse / Distribution Sum of Price ($) Sum of RBA (SF) 24% 18% 11% 10% 9% 8% 7% Granite Colony Capital IAC Dream Industrial REIT MDH WPT Industrial REIT Stoltz Real Estate GSK Properties Sperber Familly Trust Greif 24% 18% 11% 10% 9% 7% 7% Browning Dermody Kelly Development Transwestern Johnson Development WPT Capital Advisors Jefferson United Dry Ridge Capital Atalaya Investments Alemap $105,177,809 $52,460,000 $17,900,000 $3,700,000 Bullitt County Airport East Riverport $186,537,809 11 $66 5.00% - 5.75% 100.0% 0.0% Top sales transactions last 12 months Size (s.f.) $ p.s.f. Sale date Stoltz Real Estate Jefferson United 210,000 $17,850,000 $85 May-19 WPT Industrial REIT WPT Capital Advisors 224,000 $17,900,000 $80 Sep-18 9101 Minor Lane IAC 324,991 $77 May-19 120 Velocity Way Granite Capital Browning 721,000 $68 Dec-18 100 Brooks Way MDH 259,960 $16,500,000 $64 May-19 857 Park Loop Road* Colony Capital Dermody 546,000 $26,489,801 $47 Feb-19 Dream Industrial REIT Transwestern 302,500 $13,491,668 $45 Feb-19 Sales price $ $24,500,000 Top sellers (s.f.)Top buyers (s.f.) Average Class A sale price p.s.f. 12 month transaction volume at a glance Total volume Number of transactions Average Class A cap rate range Sales activity by building type last 12 months Warehouse/Dist. sales volume as % of total Manufacturing sales volume as % of total Building address Buyer company Transactions details Seller company 12 month sales volume $ by submarket *Purchased as part of portfolio 2621 Technology Drive 5101 Jeff Commerce Drive $48,696,340 Kelly Development 3208 E. Blue Lick Road* Johnson Development 3,122,971 s.f. $186,537,809 0 s.f. 500,000 s.f. 1,000,000 s.f. 1,500,000 s.f. 2,000,000 s.f. 2,500,000 s.f. 3,000,000 s.f. 3,500,000 s.f. $0 $50,000,000 $100,000,000 $150,000,000 $200,000,000 Warehouse / Distribution Sum of Price ($) Sum of RBA (SF) 23% 18% 10%10% 8% 7% 7% Granite Colony Capital IAC Dream Industrial REIT MDH WPT Industrial REIT Stoltz Real Estate GSK Properties Sperber Familly Trust Exeter Greif 23% 17% 10%10% 8% 7% 7% Browning Dermody Kelly Development Transwestern Johnson Development WPT Capital Advisors Jefferson United Dry Ridge Capital Atalaya Investments FCI Alemap $105,177,809 $52,460,000 $25,200,000 $3,700,000 Bullitt County Airport East Riverport $212,137,809 11 $66 5.00% - 5.75% 100.0% 0.0% Top sales transactions last 12 months Size (s.f.) $ p.s.f. Sale date Stoltz Real Estate Jefferson United 210,000 $17,850,000 $85 May-19 WPT Industrial REIT WPT Capital Advisors 224,000 $17,900,000 $80 Sep-18 9101 Minor Lane IAC 324,991 $77 May-19 120 Velocity Way Granite Capital Browning 721,000 $68 Dec-18 100 Brooks Way MDH 259,960 $16,500,000 $64 May-19 301 Logistics Avenue* Tratt Opus 426,450 $25,600,000 $60 Jun-19 857 Park Loop Road* Colony Capital Dermody 546,000 $26,489,801 $47 Feb-19 Dream Industrial REIT Transwestern 302,500 $13,491,668 $45 Feb-19 Sales price $ $24,500,000 Top sellers (s.f.)Top buyers (s.f.) Average Class A sale price p.s.f. 12 month transaction volume at a glance Total volume Number of transactions Average Class A cap rate range Sales activity by building type last 12 months Warehouse/Dist. sales volume as % of total Manufacturing sales volume as % of total Building address Buyer company Transactions details Seller company 12 month sales volume $ by submarket *Purchased as part of portfolio 2621 Technology Drive 5101 Jeff Commerce Drive $48,696,340 Kelly Development 3208 E. Blue Lick Road* Johnson Development 3,131,721 s.f. 426,450 s.f. $186,537,809 $25,600,000 0 s.f. 500,000 s.f. 1,000,000 s.f. 1,500,000 s.f. 2,000,000 s.f. 2,500,000 s.f. 3,000,000 s.f. 3,500,000 s.f. $0 $50,000,000 $100,000,000 $150,000,000 $200,000,000 Warehouse / Distribution (blank) Sum of Price ($) Sum of RBA (SF) 20% 15% 12% 9% 9% 7% 6% 6% Granite Colony Capital Tratt Properties IAC Dream Industrial REIT MDH WPT Industrial REIT Stoltz Real Estate GSK Properties Sperber Familly Trust Exeter Greif 20% 15% 12% 9% 9% 7% 6% 6% Browning Dermody Opus Kelly Development Transwestern Johnson Development WPT Capital Advisors Jefferson United Dry Ridge Capital Atalaya Investments FCI Alemap $105,177,809 $52,460,000 $25,600,000 $25,200,000 $3,700,000 Bullitt County Airport Southern Indiana East Riverport $212,137,809 12 $66 5.00% - 5.75% 100.0% 0.0% Top sales transactions last 12 months Size (s.f.) $ p.s.f. Sale date Stoltz Real Estate Jefferson United 210,000 $17,850,000 $85 May-19 WPT Industrial REIT WPT Capital Advisors 224,000 $17,900,000 $80 Sep-18 9101 Minor Lane IAC 324,991 $77 May-19 120 Velocity Way Granite Capital Browning 721,000 $68 Dec-18 100 Brooks Way MDH 259,960 $16,500,000 $64 May-19 301 Logistics Avenue* Tratt Opus 426,450 $25,600,000 $60 Jun-19 857 Park Loop Road* Colony Capital Dermody 546,000 $26,489,801 $47 Feb-19 Dream Industrial REIT Transwestern 302,500 $13,491,668 $45 Feb-19 Sales price $ $24,500,000 Top sellers (s.f.)Top buyers (s.f.) Average Class A sale price p.s.f. 12+B9:N51 month transaction volume at a glance Total volume Number of transactions Average Class A cap rate range Sales activity by building type last 12 months Warehouse/Dist. sales volume as % of total Manufacturing sales volume as % of total Building address Buyer company Transactions details Seller company 12 month sales volume $ by submarket *Purchased as part of portfolio 2621 Technology Drive 5101 Jeff Commerce Drive $48,696,340 Kelly Development 3208 E. Blue Lick Road* Johnson Development 3,131,721 s.f. 426,450 s.f. $186,537,809 $25,600,000 0 s.f. 500,000 s.f. 1,000,000 s.f. 1,500,000 s.f. 2,000,000 s.f. 2,500,000 s.f. 3,000,000 s.f. 3,500,000 s.f. $0 $50,000,000 $100,000,000 $150,000,000 $200,000,000 Warehouse / Distribution (blank) Sum of Price ($) Sum of RBA (SF) 20% 15% 12% 9% 9% 7% 6% 6% Granite Colony Capital Tratt Properties IAC Dream Industrial REIT MDH WPT Industrial REIT Stoltz Real Estate GSK Properties Sperber Familly Trust Exeter Greif 20% 15% 12% 9% 9% 7% 6% 6% Browning Dermody Opus Kelly Development Transwestern Johnson Development WPT Capital Advisors Jefferson United Dry Ridge Capital Atalaya Investments FCI Alemap $105,177,809 $52,460,000 $25,600,000 $25,200,000 $3,700,000 Bullitt County Airport Southern Indiana East Riverport $212,137,809 12 $66 5.00% - 5.75% 100.0% 0.0% Top sales transactions last 12 months Size (s.f.) $ p.s.f. Sale date Stoltz Real Estate Jefferson United 210,000 $17,850,000 $85 May-19 WPT Industrial REIT WPT Capital Advisors 224,000 $17,900,000 $80 Sep-18 9101 Minor Lane IAC 324,991 $77 May-19 120 Velocity Way Granite Capital Browning 721,000 $68 Dec-18 100 Brooks Way MDH 259,960 $16,500,000 $64 May-19 301 Logistics Avenue* Tratt Opus 426,450 $25,600,000 $60 Jun-19 857 Park Loop Road* Colony Capital Dermody 546,000 $26,489,801 $47 Feb-19 Dream Industrial REIT Transwestern 302,500 $13,491,668 $45 Feb-19 2621 Technology Drive 5101 Jeff Commerce Drive $48,696,340 Kelly Development 3208 E. Blue Lick Road* Johnson Development *Purchased as part of portfolio Building address Buyer company Transactions details Seller company 12 month sales volume $ by submarket Average Class A sale price p.s.f. Last 12 month transaction volume at a glance Total volume Number of transactions Average Class A cap rate range Sales activity by building type last 12 months Warehouse/Dist. sales volume as % of total Manufacturing sales volume as % of total Sales price $ $24,500,000 Top sellers (s.f.)Top buyers (s.f.) 3,558,171 s.f. $212,137,809 0 s.f. 500,000 s.f. 1,000,000 s.f. 1,500,000 s.f. 2,000,000 s.f. 2,500,000 s.f. 3,000,000 s.f. 3,500,000 s.f. 4,000,000 s.f. $0 $50,000,000 $100,000,000 $150,000,000 $200,000,000 $250,000,000 Warehouse / Distribution Sum of Price ($) Sum of RBA (SF) 20% 15% 12% 9% 9% 7% 6% 6% Granite Colony Capital Tratt Properties IAC Dream Industrial REIT MDH WPT Industrial REIT Stoltz Real Estate GSK Properties Sperber Familly Trust Exeter Greif 20% 15% 12% 9% 9% 7% 6% 6% Browning Dermody Opus Kelly Development Transwestern Johnson Development WPT Capital Advisors Jefferson United Dry Ridge Capital Atalaya Investments FCI Alemap $105,177,809 $52,460,000 $25,600,000 $25,200,000 $3,700,000 Bullitt County Airport Southern Indiana East Riverport
  • 5. © 2017 Jones Lang LaSalle IP, Inc. All rights reserved. All information contained herein is from sources deemed reliable; however, no representation or warranty is made to the accuracy thereof. Total leased at delivery (%) 7.9% Total speculative at delivery (s.f.) 1,639,130 Total BTS at delivery (s.f.) 481,000 Total owner-user at delivery (s.f.) 2,718,000 Total # of properties delivered 11 Asking rental rate (low - high) $4.25 - $5.50 Largest projects delivered past 12 months Building/Address RBA (s.f.) Delivery date Leased at delivery (%) W.W. Grainger 1,300,000 Q3 2018 100% Medline Distribution Center 1,100,000 Q2 2019 100% Exeter River Ridge 506,117 Q3 2018 0% Skyway 350 350,000 Q3 2018 0% 4301 Produce Road 318,000 Q2 2019 100% 2349 E. Miller Lane 251,000 Q4 2018 100% Total pre-leased (%) 25.3% Total speculative under construction (s.f.) 1,706,768 Total BTS under construction (s.f.) - Total Owner-user under construction (s.f.) 469,000 Total # of properties UC 7 Asking rental rate (low - high) $3.90 - $4.65 Largest projects currently under construction Building RBA (s.f.) Delivery date Pre-leased (%) Logistics River Ridge 469,000 Q2 2019 100% Dermody Renaissance South 352,800 Q3 2020 0% New Cut Center Bldg 2 331,928 Q2 2019 0% Eastpoint Business Center B 150,040 Q3 2019 21% 401 Salem 150,000 Q4 2019 0%Speculative Speculative Owner Construction type Speculative America Place Boland Main Street Realty Dermody Niagara Bottling Speculative Owner-user Southern Indiana East Airport Airport Southern Indiana Construction typeOwnerSubmarket Airport Airport Southern Indiana Southern Indiana Airport Premier Packaging The Schroering Co. Exeter Property Group Medline W.W. Grainger Owner-user Owner-user New and historical deliveries Completions in-depth 4,838,130 Total delivered past 12 months (s.f.) Speculative Speculative Owner-user Submarket Under construction 2,175,768 Under construction (s.f.) Under construction in-depth Upcoming deliveries by year (s.f., excludes YTD completions) Airport Advance Distribution Services BTS 0 1,000,000 2,000,000 3,000,000 4,000,000 5,000,000 6,000,000 7,000,000 2012 2013 2014 2015 2016 2017 2018 2019 0 200,000 400,000 600,000 800,000 1,000,000 1,200,000 1,400,000 1,600,000 1,800,000 2,000,000 2019 2020 Owner-user Speculative Q2 2019 Construction Louisville Industrial Outlook This report analyzes all industrial developments under construction & new deliveries > 100,000 s.f. © 2019 Jones Lang LaSalle IP, Inc. All rights reserved. All information contained herein is from sources deemed reliable; however, no representation or warranty is made to the accuracy thereof.
  • 6. © 2017 Jones Lang LaSalle IP, Inc. All rights reserved. All information contained herein is from sources deemed reliable; however, no representation or warranty is made to the accuracy thereof. Q2 2019 Construction Louisville Industrial Outlook 1 Location: 6200 New Cut Road Square feet: 331,928 Tenant(s): None Landlord: Main Street 1 2 Location: 401 Salem Road Square feet: 150,000 Tenant(s): None Landlord: America Place 2 3 Address: Logistics Avenue Square feet: 469,000 Tenant(s): Owner-user Landlord: Niagara Bottling 3 © 2019 Jones Lang LaSalle IP, Inc. All rights reserved. All information contained herein is from sources deemed reliable; however, no representation or warranty is made to the accuracy thereof. 4 3 Address: 2825 Transglobal Drive Square feet: 352,800 Tenant(s): None Landlord: Dermody
  • 7. © 2017 Jones Lang LaSalle IP, Inc. All rights reserved. All information contained herein is from sources deemed reliable; however, no representation or warranty is made to the accuracy thereof. 22% 15% 13%12% 11% 10% 7% Trade, Transportation & Utilities Educational & Health Services Professional & Business Services Manufacturing Government Leisure & Hospitality Financial Activities Mining, Logging & Construction Other Services Information Q2 2019 Employment Louisville Industrial Outlook 3.6%U.S. unemployment 1.5%U.S. 12-month job growth 3.5%Louisville unemployment 0.8%Louisville 12-month job growth 4.0%Kentucky unemployment 1.0%Kentucky 12-month job growth -3.0 2.0 7.0 12.0 17.0 22.0 2014 2015 2016 2017 2018 Trade, Transportation & Utilities Manufacturing Other Services Mining Logging & Construction 2019 0% 4% 8% 400,000 500,000 600,000 700,000 800,000 2015 2016 2017 2018 2019 Employment Unemployment Employment vs. unemployment rate Employment by industry Job growth (12-month change) -3,700 -2,900 -1,000 -900 -500 0 500 1,500 3,600 5,400 -6,500 -4,500 -2,500 -500 1,500 3,500 5,500 7,500 Professional & Business… Leisure & Hospitality Other Services Trade, Transportation & Utilities Information Financial Activities Government Mining, Logging & Construction Manufacturing Educational & Health Services Job growth* Historical employment Job growth by sector* Employment by industry Industrial employment* * Represents 12-month change in employment. All charts represent the latest economic data available from the Bureau of Labor Statistics as of May 2019. © 2019 Jones Lang LaSalle IP, Inc. All rights reserved. All information contained herein is from sources deemed reliable; however, no representation or warranty is made to the accuracy thereof. -1.0% -0.3% 0.4% 1.1% 1.8% 2.5% 3.2% 3.9% 2015 2016 2017 2018 Louisville U.S. 2019
  • 8. Andrew Batson Vice President, Director of Research +1 216 937 4374 andrew.batson@am.jll.com Alex Westcott Research Analyst +1 502 394 2504 alex.westcott@am.jll.com About JLL JLL (NYSE: JLL) is a leading professional services firm that specializes in real estate and investment management. Our vision is to reimagine the world of real estate, creating rewarding opportunities and amazing spaces where people can achieve their ambitions. In doing so, we will build a better tomorrow for our clients, our people and our communities. JLL is a Fortune 500 company with annual revenue of $16.3 billion, operations in over 80 countries and a global workforce of over 90,000 as of December 31, 2018. JLL is the brand name, and a registered trademark, of Jones Lang LaSalle Incorporated. For further information, visit jll.com About JLL Research JLL’s research team delivers intelligence, analysis and insight through market-leading reports and services that illuminate today’s commercial real estate dynamics and identify tomorrow’s challenges and opportunities. Our more than 400 global research professionals track and analyze economic and property trends and forecast future conditions in over 60 countries, producing unrivalled local and global perspectives. Our research and expertise, fueled by real-time information and innovative thinking around the world, creates a competitive advantage for our clients and drives successful strategies and optimal real estate decisions. © 2018 Jones Lang LaSalle IP, Inc. All rights reserved. All information contained herein is from sources deemed reliable; however, no representation or warranty is made to the accuracy thereof.