💕SONAM KUMAR💕Premium Call Girls Jaipur ↘️9257276172 ↙️One Night Stand With Lo...
2011 jou huang
1. J Periodontol • March 2011
The Biomechanical Analysis of Relative
Position Between Implant and Alveolar
Bone: Finite Element Method
Cheng-Chun Huang,*†‡ Ting-Hsun Lan,§ Huey-Er Lee,§ and Chau-Hsiang Wang§
Background: The purpose of this study is to analyze bio-
mechanical interactions in the alveolar bone surrounding
implants with smaller-diameter abutments by changing posi-
tion of the fixture–abutment interface, loading direction, and
thickness of cortical bone using the finite element method.
Methods: Twenty different finite element models including
four types of cortical bone thickness (0.5, 1, 1.5, and 2 mm)
E
xcellent outcomes for implants
and five implant positions relative to bone crest (subcrestal have been documented, yet im-
1, implant shoulder 1 mm below bone crest; subcrestal 0.5, plant failures are still reported.1
implant shoulder 0.5 mm below bone crest; at crestal implant Implant failures after loading primarily
shoulder even with bone crest; supracrestal 0.5, implant result from cortical bone loss,2 and one
shoulder 0.5 mm above bone crest; and supracrestal 1, im- important factor contributing to cortical
plant shoulder 1 mm above bone crest) were analyzed. All bone loss is the position of the fixture–
models were simulated under two different loading angles abutment interface relative to the alveo-
(0 and 45 degrees) relative to the long axis of the implant, lar crest.3,4 Buser et al.5 indicated that
respectively. The three factors of implant position, loading the fixture–abutment interface should
type, and thickness of cortical bone were computed for all be placed subcrestally to compensate for
models. the loss of vertical bone height in the first
Results: The results revealed that loading type and implant year after implant placement. Davar-
position were the main factors affecting the stress distribution panah et al.6 found that a supracrestal
in bone. The stress values of implants in the supracrestal 1 position of the fixture–abutment interface
position were higher than all other implant positions. Addition- is favorable for prosthetic fabrication.
ally, compared with models under axial load, the stress values Furthermore, two studies7,8 emphasized
of models under off-axis load increased significantly. that inflammatory cells aggregate in the
Conclusions: Both loading type and implant position were microgap between the fixture and abut-
crucial for stress distribution in bone. The supracrestal 1 im- ment, which leads to bone loss. Placing
plant position may not be ideal to avoid overloading the alve- implants subcrestally relative to the
olar bone surrounding implants. J Periodontol 2011;82:489- initial cortical bone crest resulted in
496. greater bone loss than placing implants
supracrestally.9,10 Broggni et al.8 inves-
KEY WORDS
tigated bone loss among implants with
Abutment; biomechanics; bone loss; dental implant; various apico-coronal locations of the
finite element analysis. fixture–abutment interface and found that
subcrestal interfaces accumulated more
* Department of Dentistry, Chang Gung Memorial Hospital, Kaohsiung, Taiwan. neutrophils than supracrestal interfaces,
† Graduate Institute of Dental Sciences, Kaohsiung Medical University, Kaohsiung, Taiwan.
‡ Department of Stomatology, National Cheng Kung University Hospital, Tainan, Taiwan. resulting in significant bone loss. Thus,
§ Department of Prosthodontics, School of Dentistry, Kaohsiung Medical University a supracrestal position of the fixture–
Hospital, Kaohsiung Medical University.
abutment interface not only diminished
the amount of bone loss but facilitated
the fabrication of prosthesis.
In esthetic sites, a more apically posi-
tioned interface is advised to avoid the
unesthetic appearance of metal crown
doi: 10.1902/jop.2010.100388
489
2. Biomechanical Analysis of Different Implant Positions Volume 82 • Number 3
margin, especially for patients with a high smiling
line. Besides, placing the implant shoulder subcres-
tally is favorable for an ideal emergence profile.11
However, subcrestal location of the fixture–abutment
interface leads to a greater amount of bone loss
than placing the interface supracrestally.
It is generally believed that the vertical position of
the fixture–abutment interface greatly influences bone
resorption and soft tissue dimensions.3,4,12 The per-
spective of implant designs should reduce the amount
of bone resorption that results from the microgap be-
tween fixture and abutment to improve the esthetic
outcome. Placing a smaller-diameter abutment rela-
tive to the platform of the fixture is applied progres-
sively to decrease bone loss. This is referred to as
‘‘platform switching.’’13 Lazzara and Porter14 reported
that the amount of bone loss was less when using im-
plants with non-matching diameters of fixture and
abutment rather than using the same diameters.
Hurzeler et al.15 indicated that changing the horizontal
¨
relationship between fixture and abutment by reposi-
tioning the fixture–abutment interface inwardly could
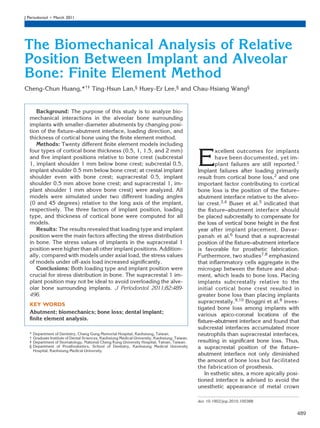
effectively abate bone resorption. Jung et al.16 and Figure 1.
Cochran et al.17 evaluated the bone loss around the The three-dimensional finite element models of an implant-supported
implants with non-matching diameters of fixtures system used in the study. A) Abutment. B) Fixture. C) Metal framework.
D) Porcelain. E) Cortical and cancellous bone. F) All models were
and abutments by radiographic and histologic ana- combined by Boolean operations.
lyses. The fixture–abutment interfaces were placed
at three different locations: 1 mm above bone crest,
even with bone crest, and 1 mm below bone crest. and decreasing the thickness of cortical bone would
Both radiographic and histologic results indicated that lead to more stress concentration.
bone loss surrounding the fixture with a smaller-diam-
eter abutment was much less than the implant with MATERIALS AND METHODS
a butt–joint connection between fixture and abutment According to the mandibular buccal and lingual mean
regardless of the implant position. In addition, radio- cortical thickness over the cervical area,18 a three-
graphic analyses revealed that no significant dif- dimensional FE model of a mandibular segment from
ferences in bone loss in various positions of the second premolar to second molar was constructed
fixture–abutment interface were observed,16 but the using a computer-aided design program.¶ A solid
histologic results did identify significant differences screw-type implant model# with a narrow-diameter
in the amount of bone loss among implants with dif- abutment that combined a horizontal offset and a
ferent positions.17 Morse taper connection was placed in the mandibular
According to the studies of Jung et al.16 and first molar area. The thickness of cortical bone was
Cochran et al.,17 application of the implant with non- changed to 0.5, 1, 1.5, and 2 mm to investigate the
matching diameters of fixture and abutment could effect on cortical bone thickness. The geometry of
diminish bone loss. The position of fixture–abutment the implant-supported crown of the mandibular first
surface would significantly affect the bone loss around molar was created as previously described.19 The
implants. However, there is insufficient biomechanical simulated crown consisted of framework material
evidence concerning implants with non-matching di- and porcelain, and the porcelain thickness used in
ameters of fixture and abutment. The purpose of this this study was 1.5 mm (Fig. 1).
study is to analyze the stress distribution in the bone The effect of various positions of the fixture–abut-
surrounding implants with smaller-diameter abutments ment interface relative to the alveolar bone crest
to investigate the effects of loading direction, position of and the thickness of cortical bone were investigated
the fixture–abutment interface, and thickness of cortical in 20 FE models. The models were divided into five
bone by the finite element (FE) method. The interac- groups based on the position of the fixture–abutment
tions between these three factors were also evaluated.
The hypothesis of the study was that placing the fix- ¶ Pro/ENGINEER, Parametric Technology, Boston, MA.
ture–abutment interface in a supracrestal position # 3.5 mm in diameter and 11 mm in length, Ankylos, Mannheim, Germany.
490
3. J Periodontol • March 2011 Huang, Lan, Lee, Wang
Table 1. compressive stresses are more substantial than ten-
sile stresses and provide reliable information for
Description of the Five Different Groups
analyzing bone resorption leading to the loss of os-
Used in the Study seointegration between alveolar bone and implants.22
Therefore, this study investigates the stress distribu-
Group Description tion of cortical bone by peak compressive stress. To
A Subcrestal 1: the position of fixture–abutment simplify the results, the main effect of each level of
interface was 1 mm below alveolar bone crest the three investigated factors (position of fixture–
abutment interface, loading type, and thickness of
B Subcrestal 0.5: the position of fixture–abutment cortical bone) was analyzed statistically.20,26 The
interface was 0.5 mm below alveolar bone crest
data from simulated results were compared using
C At crestal: the position of fixture–abutment a three-way analysis of variance (ANOVA) by the
interface was even with alveolar bone crest statistical program.††
D Supracrestal 0.5: the position of fixture–abutment RESULTS
interface was 0.5 mm above alveolar bone crest
The peak compressive stress values of cortical bone
E Supracrestal 1: the position of fixture–abutment under axial and off-axis loads are illustrated in Figure
interface was 1 mm above alveolar bone crest 2. The compressive stress distribution of cortical bone
with a thickness of 2 mm and different implant posi-
tions under axial and off-axis load are illustrated in
interface. These were designated with a first symbol of Figure 3. The maximum stress in the alveolar bone
‘‘A,’’ ‘‘B,’’ ‘‘C,’’ ‘‘D,’’ and ‘‘E,’’ respectively, as de- was concentrated at the buccal and lingual cervical
scribed in Table 1. In addition, a second group of sym- areas in the cortical bone when axial and off-axis
bols (1 through 4) represented the thickness of loads were applied, respectively. The stress values
cortical bone (0.5, 1, 1.5, and 2 mm, respectively). of models with the at crestal implant position were
After all models were assembled by Boolean oper- lower than models with other implant positions (Fig.
ations, a convergence test was conducted by applying 3). To evaluate the relative importance of the investi-
element refinement methodology. The criterion be- gated factors and their interaction effects, ANOVA
tween mesh refinements was a change of <5% for was performed, and the results are summarized in
models with variant mesh size.20 According to the re- Table 4. The relative importance of each factor that
sults of the convergence test, all models were meshed affects the stress values was expressed as a per-
by the FE program** with a mesh size of 0.8 mm. centage of the total sum of squares. 20,27 Loading
The interface between implant and alveolar bone type was the main factor affecting stress distribution
was bonded to simulate ideal osseointegration. An of cortical bone. The results revealed that loading type
occlusal force of 100 N was applied to the mesio-buc- significantly (P <0.01) dominated the magnitude of
cal and disto-buccal cusps axially and at 45 degrees the peak compressive stress values and the percent-
to the long axis of the implant from the buccal to lin- age contribution was 62.39% (Table 4). The high
gual side, respectively. Table 2 provides a detailed value of percentage of the total sum of squares means
classification of the thickness of cortical bone, the po- that loading type was a crucial factor determining the
sition of the fixture–abutment interface, and loading stress distribution relative to other factors. Generally,
types for all FE models. All materials were presumed off-axis load evidently increased the peak compres-
to be linear elastic, homogeneous, and isotropic; the sive stress values regardless of the position of fixture–
material properties are described in Table 3.21-23 In abutment interface and the thickness of cortical bone
addition, nodes over the mesial and distal border compared to the axial load.
surfaces of the bone model were constrained in all The position of the fixture–abutment interface sig-
directions as the boundary conditions. nificantly affected the peak compressive stress values
Presently, the ideal stresses used in the calcula- of cortical bone (P = 0.02) and the percentage con-
tions are not clearly defined. Based on previous re- tribution was 30.49%. The peak compressive stress
search,22,24,25 von Mises stress values are defined as values of the group C models were smaller than the
the ductile material, such as metallic implants, and other groups (Figs. 2A and 2B), which indicated that
principal stress offers the possibility of making a dis- the stress values were lowest when the position of
tinction between tensile and compressive stress. Posi- fixture–abutment interface was at the crest regard-
tive values of principle stress represent tensile stress; less of the loading types and thickness of cortical
negative values represent compressive stresses. That
is, the most negative stress (minimum principal stress) ** ANSYS, v11.0, Swanson Analysis System, Houston, PA.
stands for the peak compressive stress. In general, †† SPSS, v11.0, IBM, Chicago, IL.
491
4. Biomechanical Analysis of Different Implant Positions Volume 82 • Number 3
Table 2.
Detailed Thickness of Cortical Bone, Position of Fixture–Abutment Surface, Loading
Types, and Sequence of Simulated Finite-Element Models in This Study
Position of Fixture–Abutment Interface
(A, subcrestal 1 mm; B, subcrestal
0.5 mm; C, at crestal; D, supracrestal
Thickness of Cortical Bone 0.5 mm; E, supracrestal 1 mm) Sequences: Vertical Load Sequences: Off-Axis Load
1) Thickness of cortical bone: 0.5 mm A 1 21
B 2 22
C 3 23
D 4 24
E 5 25
2) Thickness of cortical bone: 1 mm A 6 26
B 7 27
C 8 28
D 9 29
E 10 30
3) Thickness of cortical bone: 1.5 mm A 11 31
B 12 32
C 13 33
D 14 34
E 15 35
4) Thickness of cortical bone: 2 mm A 16 36
B 17 37
C 18 38
D 19 39
E 20 40
Table 3. bone thickness, the ANOVA results failed to identify
Material Properties Used in the any apparent effect on the stress values of cortical
Finite-Element Models bone and the percentage contribution was only
1.78%.
The interaction effects among the three factors (load-
Young Modulus
ing type, position of the fixture–abutment interface, and
Materials (MPa) Poisson Ratio References
thickness of cortical bone) were also investigated and
Porcelain 69,000 0.28 20 the results are summarized in Table 4. The cofactor
(loading type · position) was a significant factor for
Titanium 117,000 0.35 21
the stress value in cortical bone (P <0.01), but only
Trabecular bone 1,850 0.30 21 a small percentage contribution (3.47%) was noted.
Cortical bone 13,700 0.30 21 DISCUSSION
Low-gold alloy 120,000 0.33 22 Excessive stress at the implant–bone interface has
(Au-Pd-Pt) been considered a potential cause for peri-implant
bone loss and failure of osseointegration. Based on
previous studies, the magnitude of the stresses in
bone. Post hoc analyses suggested that the stress bone was highly correlated with the thickness of cor-
values of models with the supracrestal 1 position were tical bone. As the thickness of cortical bone increased,
significantly greater than the models with the position the maximum stress values concentrated in the corti-
of supracrestal 0.5 and at crestal (Fig. 4); however, cal bone decreased.28,29 In this study, as the thickness
some group differences were marginally significant of cortical bone increases from 0.5 to 2 mm, peak
(i.e., group A versus group E and group B versus compressive stress reduces despite the loading type;
group E, both P = 0.07). As to the effect of cortical however, no significant difference is observed among
492
5. J Periodontol • March 2011 Huang, Lan, Lee, Wang
Figure 2.
A) The stress values of cortical bone in all models under axial load. B) The stress values of cortical bone in all models under off-axis load.
Figure 3.
A) The compressive stress distribution and values of cortical bone with a thickness of 2 mm and different implant positions under axial load. The peak
compressive stress positions were located at the buccal cervical area in the cortical bone of the implant side. B) The peak compressive stress distribution and
values of cortical bone with a thickness of 2 mm and different implant positions under off-axis load. The peak compressive stress positions were located at the
lingual cervical area in the cortical bone of the implant side.
the models with different cortical bone thickness. ing moment that increased stress compared to that
This might be because the force applied in this study generated by axial load. This result is in agreement
is too small to present the loading effect. Moreover, with previous reports,20,25,27,30 which found loading
the von Mises stress was adopted in previous studies type was one important factor affecting the stress dis-
to evaluate the condition of stress distribution in tribution for alveolar bone.
bone, but the peak compressive stress is instead Clinically, placement of the fixture–abutment inter-
used in this study, which might influence the results. face needs to take into account anatomic limitations
The study also found that loading type was a critical and esthetic requirements. Placing the fixture–abut-
factor for stress distribution. The peak compressive ment interface below the alveolar crest (a subcrestal
stress values were significantly higher in models un- placement) could achieve satisfying esthetic outcome
der off-axis load than models under axial load, which and a favorable emergence profile, which is desirable
implied that an off-axis load generated a larger bend- for esthetic and hygienic reasons.11 However, the
493
6. Biomechanical Analysis of Different Implant Positions Volume 82 • Number 3
Table 4.
Summary of the Analysis of Variance Showing the Statistical Results of Peak
Compressive Stress With Respect to Cortical Bone
Source df SS MS % TSS P Value
Loading type 1 129,857.65 129,857.65 62.39 <0.01
Position 4 63,469.56 15,867.39 30.49 0.02
Thickness of cortical bone 3 3,694.80 1,231.60 1.78 0.90
Loading type · position 3 7,224.05 1,806.01 3.47 <0.01
Loading type · thickness of cortical bone 4 1,453.93 484.64 0.70 0.80
Position · thickness of cortical bone 6 2,433.70 202.81 1.17 1.00
Total 208,133.69 100
df = degrees of freedom; SS = sum of square; MS = mean square; % TSS = total sum of squares.
The major finding of this study is that the position of
the fixture–abutment interface significantly affects the
magnitude of the peak compressive stress for cortical
bone. Post hoc analyses revealed the stress values
of models with a supracrestal 1 position were signifi-
cantly greater than models with the supracrestal 0.5
and at crestal positions. Furthermore, marginal signif-
icant differences were noted between groups A and E
and between groups B and E. These results implied
that under the same magnitude of loading, the peak
compressive stress values were higher in models with
a supracrestal 1 position than in models with other
positions despite the thickness of cortical bone and
loading type. Hansson24 also found that placing the
fixture–abutment interface supracrestally caused a
higher peak compressive value in bone than that even
Figure 4. with alveolar bone crest. Eccentric loading applied
Means and standard errors of stress values in models with different to the occlusal plane of the implant-supported pros-
implant positions (* P <0.05). thesis causes a bending of the implant, and a bending
moment for cortical bone was generated. The bending
subcrestal microgap was thought to promote a moment was greater in models with supracrestal 1
remarkably greater amount of inflammatory reaction implant position because of the longer resistance
correlated with bone destruction than supracrestal arm. In addition, there is a direct connection between
microgaps.7,8 Placing the microgap at a fixture– alveolar bone and the implants used in our study. It
abutment connection subcrestally had been per- was assumed that the force applied to the implant-
ceived as a contraindication for maintaining vertical supported prosthesis would be transferred directly
bone height until the concept of platform switching to the alveolar bone. Therefore, the amount of contact
was introduced. Platform switching means that the area between the implant and alveolar bone could
abutment with narrower diameter is connected to influence the stress distribution in alveolar bone. The
the fixture, which has been reported to decrease the overall area of the implant–bone interface was smaller
vertical bone loss.14,15 Maeda et al.31 indicated that in models with the supracrestal 1 position than in any
the platform switching configuration has the biome- of the other models. This might explain why models
chanical advantage of shifting the stress concentra- with the supracrestal 1 position had the highest peak
tion away from the bone–implant interface. In our compressive stress.
study, a fixture with narrower diameter of abutment In the present study, the position of the fixture–
connection is used to simulate the platform switching abutment interface has a significant impact on stress
structure. values of alveolar bone. It is generally believed that
494
7. J Periodontol • March 2011 Huang, Lan, Lee, Wang
excessive stress concentration causes bone destruc- accuracy of our study. The bending of the mandible
tion.28 Jung et al.16 assessed the amount of bone loss during mastication is not considered in our study,
by radiography to determine the bone response to and it is impossible to simulate entire chewing pat-
various positions of the fixture–abutment interfaces. terns by the FE method. The assumptions of loading
This research group reported that position of the fix- types in this study are simplified and represent only
ture–abutment interface did not significantly affect two possible occlusal contacts in clinical situations.
bone loss, which was inconsistent with our findings. From a biomechanical viewpoint, FE analyses pro-
Image distortion, insufficient resolution, and poor re- vide a general idea regarding bone response to occlu-
sponse to minor bony changes lead to errors in den- sal force. Further studies involving different implant
tal radiography,32,33 which might potentially explain positions and long-term clinical results are required.
why the results of Jung et al.16 differ from the present
study. In contrast, Cochran et al.17 investigated bone CONCLUSIONS
loss by histologic analyses for implants with platform Considering the limitations of the study, we conclude
switching configuration and found that position of the the following: 1) the position of the fixture–abutment
implant shoulder was an important factor affecting bone interface had an important role on the stress distri-
destruction. Moreover, placing the implant shoulder 1 bution in alveolar bone; 2) the stress values of the
mm above the bone crest resulted in mild bone growth models under off-axis load were higher than those un-
surrounding the implant instead of bone loss. Our re- der axial load; 3) the cofactor (loading type · position)
sults suggested that peak compressive stress values was a prominent factor affecting stress distribution;
were highest in models with the supracrestal 1 posi- and 4) realizing how clinical variables affect stress dis-
tion. This implied that the bone loss surrounding the tribution facilitates optimal prosthesis fabrication and
implants in this position would be more severe than may lead to a decrease in mechanical complications
in other positions. The differences between the pres- and improve implant longevity. According to the
ent study and the results of Cochran et al.17 are likely simulation results, locating the fixture–abutment in-
attributable to various factors. Cochran et al.17 used terface 1 mm above the bone crest may not be an
dogs in their study, and differences in chewing pat- appropriate option to prevent the bone surrounding
terns, the different cortical thickness of the implant implants from overloading.
placing areas, and loading types were some of the
main factors that were difficult to control and could ACKNOWLEDGMENTS
explain, at least in part, the different results. Drs. Ting-Hsun Lan and Chau-Hsiang Wang equally
Another key finding of this study is that the cofactor contributed to this article. The authors thank National
(loading type · position) is a crucial factor affecting Kaohsiung University of Applied Science, Kaohsiung,
the stress values. Both loading type and the position Taiwan, for technical support. The authors report no
of fixture–abutment interface greatly influenced the conflicts of interest related to this study.
stress values. In a clinical situation, chewing forces,
especially off-axis forces, act on the implant and sur- REFERENCES
rounding bone via a lever. The bending moments ¨ ¨
1. Bragger U, Aeschlimann S, Burgin W, Hammerle CH,
¨
acting on the implant and surrounding bone in the Lang NP. Biological and technical complications and
failures with fixed partial dentures (FPD) on implants
posterior area are higher in patients with the occlusal
and teeth after four to five years of function. Clin Oral
pattern of group function guidance than in patients Implants Res 2001;12:26-34.
with canine guidance. At present, although there is 2. Isidor F. Loss of osseointegration caused by occlusal
insufficient evidence to support the hypothesis that load of oral implants. A clinical and radiographic study
bruxism causes an overload of dental implants and in monkeys. Clin Oral Implants Res 1996;7:143-152.
surrounding bone, practitioners are encouraged to 3. Hermann JS, Cochran DL, Nummikoski PV, Buser D.
proceed more carefully when planning implant pro- Crestal bone changes around titanium implants. A
radiographic evaluation of unloaded nonsubmerged
cedures in patients with bruxism.34 Based on our re-
and submerged implants in the canine mandible. J
sults, placing implants in the supracrestal 1 position Periodontol 1997;68:1117-1130.
may not be suggested to avoid the excessive stress 4. Hermann JS, Buser D, Schenk RK, Schoolfield JD,
concentration caused by a bending moment, espe- Cochran DL. Biologic width around one- and two-
cially for patients with bruxism and the occlusal pat- piece titanium implants. Clin Oral Implants Res 2001;
tern of group function guidance. 12:559-571.
The three-dimensional FE method is considered 5. Buser D, Dula K, Belser U, Hirt HP, Berthold H.
Localized ridge augmentation using guided bone re-
a powerful tool for stress distribution, but there are still generation. 1. Surgical procedure in the maxilla. Int J
limitations with these analyses. We standardized the Periodontics Restorative Dent 1993;13(1):29-45.
material property of alveolar bone as homogeneous, 6. Davarpanah M, Martinez H, Tecucianu JF. Apical-
isotropic, and linear elastic, which likely affects the coronal implant position: Recent surgical proposals.
495
8. Biomechanical Analysis of Different Implant Positions Volume 82 • Number 3
Technical note. Int J Oral Maxillofac Implants 2000; x x ˘
22. Akca K, Iplikcioglu H. Evaluation of the effect of the
15:865-872. residual bone angulation on implant-supported fixed
7. Broggini N, McManus LM, Hermann JS, et al. Persis- prosthesis in mandibular posterior edentulism. Part II:
tent acute inflammation at the implant-abutment in- 3-D finite element stress analysis. Implant Dent 2001;
terface. J Dent Res 2003;82:232-237. 10:238-245.
8. Broggini N, McManus LM, Hermann JS, et al. Peri- 23. Roberts HW, Berzins DW, Moore BK, Charlton DG.
implant inflammation defined by the implant-abut- Metal-ceramic alloys in dentistry: A review. J Prostho-
ment interface. J Dent Res 2006;85:473-478. dont 2009;18:188-194.
9. Todescan FF, Pustiglioni FE, Imbronito AV, Albrektsson 24. Hansson S. A conical implant-abutment interface at
T, Gioso M. Influence of the microgap in the peri- the level of the marginal bone improves the distribu-
implant hard and soft tissues: A histomorphometric tion of stresses in the supporting bone. An axisym-
study in dogs. Int J Oral Maxillofac Implants 2002;17:
metric finite element analysis. Clin Oral Implants Res
467-472.
2003;14:286-293.
10. Piattelli A, Vrespa G, Petrone G, Iezzi G, Annibali S,
25. Hsu ML, Chen FC, Kao HC, Cheng CK. Influence of
Scarano A. Role of the microgap between implant and
abutment: A retrospective histologic evaluation in off-axis loading of an anterior maxillary implant: A 3-
monkeys. J Periodontol 2003;74:346-352. dimensional finite element analysis. Int J Oral Max-
11. Buser D, von Arx T. Surgical procedures in partially illofac Implants 2007;22:301-309.
edentulous patients with ITI implants. Clin Oral Im- 26. Dar FH, Meakin JR, Aspden RM. Statistical methods
plants Res 2000;11(Suppl. 1):83-100. in finite element analysis. J Biomech 2002;35:1155-
12. Hermann JS, Schoolfield JD, Schenk RK, Buser D, 1161.
Cochran DL. Influence of the size of the microgap on 27. Lan TH, Pan CY, Lee HE, Huang HL, Wang CH. Bone
crestal bone changes around titanium implants. A stress analysis of various angulations of mesiodistal
histometric evaluation of unloaded non-submerged implants with splinted crowns in the posterior mandi-
implants in the canine mandible. J Periodontol 2001; ble: A three-dimensional finite element study. Int J
72:1372-1383. Oral Maxillofac Implants 2010;25:763-770.
13. Gardner DM. Platform switching as a means to achieving 28. Kitagawa T, Tanimoto Y, Nemoto K, Aida M. Influence
implant esthetics. N Y State Dent J 2005;71:34-37. of cortical bone quality on stress distribution in bone
14. Lazzara RJ, Porter SS. Platform switching: A new around dental implant. Dent Mater J 2005;24:219-
concept in implant dentistry for controlling postrestor- 224.
ative crestal bone levels. Int J Periodontics Restorative 29. Lin CL, Wang JC, Ramp LC, Liu PR. Biomechanical
Dent 2006;26(1):9-17. response of implant systems placed in the maxillary
15. Hurzeler M, Fickl S, Zuhr O, Wachtel HC. Peri-implant
¨ posterior region under various conditions of angula-
bone level around implants with platform-switched tion, bone density, and loading. Int J Oral Maxillofac
abutments: Preliminary data from a prospective study. Implants 2008;23:57-64.
J Oral Maxillofac Surg 2007;65(Suppl. 17):33-39. 30. Lin CL, Wang JC, Chang WJ. Biomechanical interac-
16. Jung RE, Jones AA, Higginbottom FL, et al. The
tions in tooth-implant-supported fixed partial dentures
influence of non-matching implant and abutment di-
with variations in the number of splinted teeth and
ameters on radiographic crestal bone levels in dogs. J
Periodontol 2008;79:260-270. connector type: A finite element analysis. Clin Oral
17. Cochran DL, Bosshardt DD, Grize L, et al. Bone Implants Res 2008;19:107-117.
response to loaded implants with non-matching im- 31. Maeda Y, Miura J, Taki I, Sogo M. Biomechanical
plant-abutment diameters in the canine mandible. J analysis on platform switching: Is there any biome-
Periodontol 2009;80:609-617. chanical rationale? Clin Oral Implants Res 2007;18:
18. Lan TH, Huang HL, Wu JH, Lee HE, Wang CH. Stress 581-584.
analysis of different angulations of implant installation: 32. Fortier AP. Common errors in dental radiography. J
The finite element method. Kaohsiung J Med Sci 2008; Dent Educ 1979;43:683-684.
24:138-143. 33. Patel JR. Intraoral radiographic errors. Oral Surg Oral
19. Ash MM, Nelson S. Wheeler’s Dental Anatomy. Phys- Med Oral Pathol 1979;48:479-483.
iology and Occlusion, 9th ed. St. Louis: Saunders/ 34. Lobbezoo F, Brouwers JE, Cune MS, Naeije M. Dental
Elsevier; 2010:189-199. implants in patients with bruxing habits. J Oral Rehabil
20. Lin CL, Wang JC, Chang SH, Chen ST. Evaluation of 2006;33:152-159.
stress induced by implant type, number of splinted
teeth, and variations in periodontal support in tooth- Correspondence: Dr. Chau-Hsiang Wang, Department of
implant-supported fixed partial dentures: A non-linear Prosthodontics, Kaohsiung Medical University Hospital,
finite element analysis. J Periodontol 2010;81:121-130. 100 Tz-You 1st Road, Kaohsiung 80756, Taiwan. Fax:
21. Kamposiora P, Papavasilious G, Bayne SC, Felton DA. 886-7-3157024; e-mail: christurkey@yahoo.com.tw.
Finite element analysis estimates of cement micro-
fracture under complete veneer crowns. J Prosthet Submitted June 26, 2010; accepted for publication August
Dent 1994;71:435-441. 28, 2010.
496