
Recommended
More Related Content
Similar to Object Oriented Technique Fundamentals for Computer Science
Similar to Object Oriented Technique Fundamentals for Computer Science (20)
Recently uploaded
Recently uploaded (20)
Object Oriented Technique Fundamentals for Computer Science
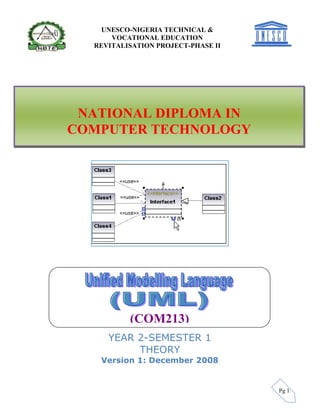
- 1. Pg 1 YEAR 2-SEMESTER 1 THEORY Version 1: December 2008 UNESCO-NIGERIA TECHNICAL & VOCATIONAL EDUCATION REVITALISATION PROJECT-PHASE II NATIONAL DIPLOMA IN COMPUTER TECHNOLOGY (COM213)
- 2. Pg 2 TABLE OF CONTENTS Table of Contents OJECT ORIENTED TECHNIQUE ....................................................................... 3 Overview............................................................................................................ 3 Fundamental concepts.................................................................................. 4 History................................................................................................................ 7 UNIFIED MODELLING LANGUAGE (UML) – The General Overview ............... 12 History.............................................................................................................. 12 Before UML 1.x.......................................................................................... 13 UML 1.x........................................................................................................ 13 Development toward UML 2.0 ............................................................... 14 Unified Modeling Language topics ........................................................... 14 Methods........................................................................................................ 14 Modelling...................................................................................................... 15 Diagrams overview................................................................................... 15 THE STRUCTURE DIAGRAM –....................................................................... 21 COMPOSITE DIAGRAM....................................................................................... 42 THE COMPONENT DIAGRAM .......................................................................... 48 OBJECT AND PACKAGE DIAGRAM.................................................................. 56 THE BEHAVIOUR DIAGRAM........................................................................... 64 THE USE CASE MODEL.................................................................................... 73 THE STATE MACHINE MODEL....................................................................... 79 THE INTERACTION DIAGRAM....................................................................... 89 THE INTERACTION OVERVIEW DIAGRAM An interaction overview diagram is a form of activity diagram in which the nodes represent interaction diagrams......................................................................................101 THE UML TOOLS ................................................................................................106 Features in UML Tools.......................................................................106 Popular UML Tools...............................................................................109 Integration of UML Tools with Integrated Development Environments (IDEs).........................................................................111 CASE TOOL APPLICATION .............................................................................112 WEEK 1 WEEK 2 WEEK 3-4 WEEK 5 WEEK 6 WEEK 7 WEEK 8 DEPLOYMENT...................................................................................................... 60 WEEK 9 WEEK 10 WEEK 11 WEEK 12 WEEK 13 WEEK 14 WEEK 15
- 3. Pg 3 WEEK One OJECT ORIENTED TECHNIQUE Introduction Overview Object-oriented programming can trace its roots to the 1960s. As hardware and software became increasingly complex, quality was often compromised. Researchers studied ways in which software quality could be maintained. Object-oriented programming was deployed in part as an attempt to address this problem by strongly emphasizing discrete units of programming logic and re-usability in software. The computer programming methodology focuses on data rather than processes, with programs composed of self-sufficient modules (objects) containing all the information needed within its own data structure for manipulation. The Simula programming language was the first to introduce the concepts underlying object-oriented programming (objects, classes, subclasses, virtual methods, coroutines, garbage collection, and discrete event simulation) as a superset of Algol. Simula was used for physical modeling, such as models to study and improve the movement of ships and their content through cargo ports. Smalltalk was the first programming language to be called "object-oriented". Object-oriented programming may be seen as a collection of cooperating objects, as opposed to a traditional view in which a program may be seen as a group of tasks to compute ("subroutines"). In OOP, each object is capable of receiving messages, processing data, and sending messages to other objects. Each object can be viewed as an independent little machine with a distinct role or responsibility. The actions or "operators" on the objects are closely associated with the object. For example, in object oriented programming, the data structures tend to carry their own operators around with them (or at least "inherit" them from a similar object or "class"). The traditional approach tends to view and consider data and behavior separately.
- 4. Pg 4 Fundamental concepts A survey by Deborah J. Armstrong of nearly 40 years of computing literature identified a number of ‘quarks’, or fundamental concepts, found in the strong majority of definitions of OOP. They are the following: Class Defines the abstract characteristics of a thing (object), including the thing's characteristics (its attributes, fields or properties) and the thing's behaviors (the things it can do, or methods, operations or features). One might say that a class is a blueprint or factory that describes the nature of something. For example, the class Dog would consist of traits shared by all dogs, such as breed and fur color (characteristics), and the ability to bark and sit (behaviors). Classes provide modularity and structure in an object-oriented computer program. A class should typically be recognizable to a non-programmer familiar with the problem domain, meaning that the characteristics of the class should make sense in context. Also, the code for a class should be relatively self-contained (generally using encapsulation). Collectively, the properties and methods defined by a class are called members. Object A pattern (exemplar) of a class. The class of Dog defines all possible dogs by listing the characteristics and behaviors they can have; the object Lassie is one particular dog, with particular versions of the characteristics. A Dog has fur; Lassie has brown-and-white fur. Instance One can have an instance of a class or a particular object. The instance is the actual object created at runtime. In programmer jargon, the Lassie object is an instance of the Dog class. The set of values of the attributes of a particular object is called its state. The object consists of state and the behaviour that's defined in the object's class. Method An object's abilities. In language, methods are verbs. Lassie, being a Dog, has the ability to bark. So bark() is one of Lassie's methods. She may have other methods as well, for example sit() or eat() or walk() or save_timmy(). Within the program, using a method usually affects only one particular object; all Dogs can bark, but you need only one particular dog to do the barking. Message passing
- 5. Pg 5 “The process by which an object sends data to another object or asks the other object to invoke a method.” [1] Also known to some programming languages as interfacing. E.g. the object called Breeder may tell the Lassie object to sit by passing a 'sit' message which invokes Lassie's 'sit' method. The syntax varies between languages, for example: [Lassie sit] in Objective-C. In Java code-level message passing corresponds to "method calling". Some dynamic languages use double- dispatch or multi-dispatch to find and pass messages. Inheritance ‘Subclasses’ are more specialized versions of a class, which inherit attributes and behaviors from their parent classes, and can introduce their own. For example, the class Dog might have sub-classes called Collie, Chihuahua, and GoldenRetriever. In this case, Lassie would be an instance of the Collie subclass. Suppose the Dog class defines a method called bark() and a property called furColor. Each of its sub-classes (Collie, Chihuahua, and GoldenRetriever) will inherit these members, meaning that the programmer only needs to write the code for them once. Each subclass can alter its inherited traits. For example, the Collie class might specify that the default furColor for a collie is brown-and-white. The Chihuahua subclass might specify that the bark() method produces a high pitch by default. Subclasses can also add new members. The Chihuahua subclass could add a method called tremble(). So an individual chihuahua instance would use a high-pitched bark() from the Chihuahua subclass, which in turn inherited the usual bark() from Dog. The chihuahua object would also have the tremble() method, but Lassie would not, because she is a Collie, not a Chihuahua. In fact, inheritance is an ‘is-a’ relationship: Lassie is a Collie. A Collie is a Dog. Thus, Lassie inherits the methods of both Collies and Dogs. Multiple inheritance is inheritance from more than one ancestor class, neither of these ancestors being an ancestor of the other. For example, independent classes could define Dogs and Cats, and a Chimera object could be created from these two which inherits all the (multiple) behavior of cats and dogs. This is not always supported, as it can be hard both to implement and to use well. Abstraction Abstraction is simplifying complex reality by modelling classes appropriate to the problem, and working at the most appropriate level of inheritance for a given aspect of the problem. For example, Lassie the Dog may be treated as a Dog much of the time, a Collie when necessary to access Collie-specific
- 6. Pg 6 attributes or behaviors, and as an Animal (perhaps the parent class of Dog) when counting Timmy's pets. Abstraction is also achieved through Composition. For example, a class Car would be made up of an Engine, Gearbox, Steering objects, and many more components. To build the Car class, one does not need to know how the different components work internally, but only how to interface with them, i.e., send messages to them, receive messages from them, and perhaps make the different objects composing the class interact with each other. Encapsulation Encapsulation conceals the functional details of a class from objects that send messages to it. For example, the Dog class has a bark() method. The code for the bark() method defines exactly how a bark happens (e.g., by inhale() and then exhale(), at a particular pitch and volume). Timmy, Lassie's friend, however, does not need to know exactly how she barks. Encapsulation is achieved by specifying which classes may use the members of an object. The result is that each object exposes to any class a certain interface — those members accessible to that class. The reason for encapsulation is to prevent clients of an interface from depending on those parts of the implementation that are likely to change in future, thereby allowing those changes to be made more easily, that is, without changes to clients. For example, an interface can ensure that puppies can only be added to an object of the class Dog by code in that class. Members are often specified as public, protected or private, determining whether they are available to all classes, sub-classes or only the defining class. Some languages go further: Java uses the default access modifier to restrict access also to classes in the same package, C# and VB.NET reserve some members to classes in the same assembly using keywords internal (C#) or Friend (VB.NET), and Eiffel and C++ allow one to specify which classes may access any member. Polymorphism Polymorphism allows the programmer to treat derived class members just like their parent class' members. More precisely, Polymorphism in object-oriented programming is the ability of objects belonging to different data types to respond to method calls of methods of the same name, each one according to an appropriate type-specific behavior. One method, or an operator such as +, -, or *, can be abstractly applied in many different situations. If a Dog is commanded to speak(), this may elicit a bark(). However, if a Pig is commanded to speak(), this may elicit an oink(). They both inherit speak()
- 7. Pg 7 from Animal, but their derived class methods override the methods of the parent class; this is Overriding Polymorphism. Overloading Polymorphism is the use of one method signature, or one operator such as ‘+’, to perform several different functions depending on the implementation. The ‘+’ operator, for example, may be used to perform integer addition, float addition, list concatenation, or string concatenation. Any two subclasses of Number, such as Integer and Double, are expected to add together properly in an OOP language. The language must therefore overload the addition operator, ‘+’, to work this way. This helps improve code readability. How this is implemented varies from language to language, but most OOP languages support at least some level of overloading polymorphism. Many OOP languages also support Parametric Polymorphism, where code is written without mention of any specific type and thus can be used transparently with any number of new types. Pointers are an example of a simple polymorphic routine that can be used with many different types of objects.[2] Decoupling Decoupling allows for the separation of object interactions from classes and inheritance into distinct layers of abstraction. A common use of decoupling is to polymorphically decouple the encapsulation, which is the practice of using reusable code to prevent discrete code modules from interacting with each other. Not all of the above concepts are to be found in all object-oriented programming languages, and so object-oriented programming that uses classes is called sometimes class-based programming. In particular, prototype-based programming does not typically use classes. As a result, a significantly different yet analogous terminology is used to define the concepts of object and instance. History The concept of objects and instances in computing had its first major breakthrough with the PDP-1 system at MIT which was probably the earliest example of capability based architecture. Another early example was Sketchpad made by Ivan Sutherland in 1963; however, this was an application and not a programming paradigm. Objects as programming entities were introduced in the 1960s in Simula 67, a programming language designed for making simulations, created by Ole-Johan Dahl and Kristen Nygaard of the Norwegian Computing Center in Oslo. (Reportedly, the story is that they were working on ship simulations, and were confounded by the
- 8. Pg 8 combinatorial explosion of how the different attributes from different ships could affect one another. The idea occurred to group the different types of ships into different classes of objects, each class of objects being responsible for defining its own data and behavior.)[citation needed] Such an approach was a simple extrapolation of concepts earlier used in analog programming. On analog computers, mapping from real-world phenomena/objects to analog phenomena/objects (and conversely), was (and is) called 'simulation'. Simula not only introduced the notion of classes, but also of instances of classes, which is probably the first explicit use of those notions. The ideas of Simula 67 influenced many later languages, especially Smalltalk and derivatives of Lisp and Pascal. The Smalltalk language, which was developed at Xerox PARC in the 1970s, introduced the term Object-oriented programming to represent the pervasive use of objects and messages as the basis for computation. Smalltalk creators were influenced by the ideas introduced in Simula 67, but Smalltalk was designed to be a fully dynamic system in which classes could be created and modified dynamically rather than statically as in Simula 67[3] . Smalltalk and with it OOP were introduced to a wider audience by the August 1981 issue of Byte magazine. In the 1970s, Kay's Smalltalk work had influenced the Lisp community to incorporate object-based techniques which were introduced to developers via the Lisp machine. In the 1980s, there were a few attempts to design processor architectures which included hardware support for objects in memory but these were not successful. Examples include the Intel iAPX 432 and the Linn Smart Rekursiv. Object-oriented programming developed as the dominant programming methodology during the mid-1990s, largely due to the influence of C++[citation needed] . Its dominance was further enhanced by the rising popularity of graphical user interfaces, for which object-oriented programming seems to be well-suited. An example of a closely related dynamic GUI library and OOP language can be found in the Cocoa frameworks on Mac OS X, written in Objective C, an object-oriented, dynamic messaging extension to C based on Smalltalk. OOP toolkits also enhanced the popularity of event-driven programming (although this concept is not limited to OOP). Some feel that association with GUIs (real or perceived) was what propelled OOP into the programming mainstream. At ETH Zürich, Niklaus Wirth and his colleagues had also been investigating such topics as data abstraction and modular programming. Modula-2 included both, and their succeeding design, Oberon, included a distinctive approach to object orientation,
- 9. Pg 9 classes, and such. The approach is unlike Smalltalk, and very unlike C++. Object-oriented features have been added to many existing languages during that time, including Ada, BASIC, Fortran, Pascal, and others. Adding these features to languages that were not initially designed for them often led to problems with compatibility and maintainability of code. In the past decade Java has emerged in wide use partially because of its similarity to C and to C++, but perhaps more importantly because of its implementation using a virtual machine that is intended to run code unchanged on many different platforms. This last feature has made it very attractive to larger development shops with heterogeneous environments. Microsoft's .NET initiative has a similar objective and includes/supports several new languages, or variants of older ones with the important caveat that it is, of course, restricted to the Microsoft platform. More recently, a number of languages have emerged that are primarily object-oriented yet compatible with procedural methodology, such as Python and Ruby. Besides Java, probably the most commercially important recent object-oriented languages are Visual Basic .NET (VB.NET) and C#, both designed for Microsoft's .NET platform. VB.NET and C# both support cross-language inheritance, allowing classes defined in one language to subclass classes defined in the other language. Recently many universities have begun to teach Object-oriented design in introductory computer science classes. Just as procedural programming led to refinements of techniques such as structured programming, modern object-oriented software design methods include refinements such as the use of design patterns, design by contract, and modeling languages (such as UML). PROCEDURAL, STRUCTURED, AND OBJECT-ORIENTED PROGRAMMING Until recently, programs were thought of as a series of procedures that acted upon data. A Procedure, or function, is a set of specific instructions executed one after the other. The data was quite separate from the procedures, and the trick in programming was to
- 10. Pg 10 keep track of which functions called which other functions, and what data was changed. To make sense of this potentially confusing situation, structured programming was created. The principle idea behind Structured Programming is as simple as the idea of divide and conquers. A computer program can be thought of as consisting of a set of tasks. Any task that is too complex to be described simply would be broken down into a set of smaller component tasks, until the tasks were sufficiently small and self-contained enough that they were easily understood. Structured programming remains an enormously successful approach for dealing with complex problems. By the late 1980s, however, some of the deficiencies of structured programming had became all too clear. - First, it is natural to think of your data (employee records, for example) and what you can do with your data (sort, edit, and so on) as related ideas. - Second, programmers found themselves constantly reinventing new solutions to old problems. This is often called "reinventing the wheel," and is the opposite of reusability. The idea behind reusability is to build components that have known properties, and then to be able to plug them into your program as you need them. This is modelled after the hardware world--when an engineer needs a new transistor, he doesn't usually invent one, he goes to the big bin of transistors and finds one that works the way he needs it to, or perhaps modifies it. There was no similar option for a software engineer. The way we are now using computers--with menus and buttons and windows--fosters a more interactive, event- driven approach to computer programming. Event-driven means that an event happens--the user presses a button or chooses from a menu--and the program must respond. Programs are becoming increasingly interactive, and it has become important to design for that kind of functionality. Old-fashioned programs forced the user to proceed step-by-step through a series of screens. Modern event- driven programs present all the choices at once and respond to the user's actions. Object-Oriented Programming (OOP) attempts to respond to these needs, providing techniques for managing enormous complexity, achieving reuse of software components, and coupling data with the tasks that manipulate that data. The essence of object-oriented programming is to treat data and the procedures that act upon the data as a single "object"--a self- contained entity with an identity and certain characteristics of its own.
- 11. Pg 11 The Pillars of OOP Development When working with computers, it is very important to be fashionable! In the 1960s, the new fashion was what were called high-level languages such as FORTRAN and COBOL, in which the programmer did not have to understand the machine instructions. In the 1970s, people realized that there were better ways to program than with a jumble of GOTO statements, and the structured programming languages such as COBOL were invented. In the 1980s, much time was invested in trying to get good results out of fourth-generation languages (4Gls), in which complicated programming structures could be coded in a few words (if you could find the right words with so many words to choose from). There were also schemes such as Analyst Workbenches, which made systems analysts into highly paid and overqualified programmers. The fashion of the 1990s is most definitely object-oriented programming. Importance of OOP Definition: Object-oriented programming is a productivity tool. Each of these features is a step on the road to reliable and productive programming. By using pre-built libraries of code, you can save time and still have the flexibility of altering the way that they work to suit your own needs. With OOP there are lots of extra features that encourage putting thought into structuring programs so that they are more maintainable. By gathering code into CLASSES, large programs are divided into small manageable sections, in the same way that you divide small programs into functions. This is very important, because the difficulty of understanding pieces of code increases exponentially.
- 12. Pg 12 WEEK Two UNIFIED MODELLING LANGUAGE (UML) – The General Overview Introduction The Unified Modelling Language (UML) is a graphical language for visualizing, specifying and constructing the artifacts of a software- intensive system. The Unified Modelling Language offers a standard way to write a system's blueprints, including conceptual things such as business processes and system functions as well as concrete things such as programming language statements, database schemas, and reusable software components. One of the purposes of UML was to provide the development community with a stable and common design language that could be used to develop and build computer applications. UML brought forth a unified standard modelling notation that IT professionals had been wanting for years. Using UML, IT professionals could now read and disseminate system structure and design plans -- just as construction workers have been doing for years with blueprints of buildings. It is now the twenty-first century and UML has gained traction in our profession. UML combines the best practice from data modelling concepts such as entity relationship diagrams, business modelling (work flow), object modelling and component modelling. It can be used with all processes, throughout the software development life cycle, and across different implementation technologies. Standardization UML is officially defined by the Object Management Group (OMG) as the UML metamodel, a Meta-Object Facility metamodel (MOF). Like other MOF-based specifications, UML has allowed software developers to concentrate more on design and architecture. UML models may be automatically transformed to other representations (e.g. Java) by means of QVT-like transformation languages, supported by the OMG. History History of Object Oriented methods and notation.
- 13. Pg 13 Before UML 1.x After Rational Software Corporation hired James Rumbaugh from General Electric in 1994, the company became the source for the two most popular object-oriented modeling approaches of the day: Rumbaugh's OMT, which was better for object-oriented analysis (OOA), and Grady Booch's Booch method, which was better for object-oriented design (OOD). Together Rumbaugh and Booch attempted to reconcile their two approaches and started work on a Unified Method. They were soon assisted in their efforts by Ivar Jacobson, the creator of the object-oriented software engineering (OOSE) method. Jacobson joined Rational in 1995, after his company, Objectory, was acquired by Rational. The three methodologists were collectively referred to as the Three Amigos, since they were well known to argue frequently with each other regarding methodological preferences. In 1996 Rational concluded that the abundance of modeling languages was slowing the adoption of object technology, so repositioning the work on a Unified Method, they tasked the Three Amigos with the development of a non-proprietary Unified Modeling Language. Representatives of competing Object Technology companies were consulted during OOPSLA '96, and chose boxes for representing classes over Grady Booch's Booch method's notation that used cloud symbols. Under the technical leadership of the Three Amigos, an international consortium called the UML Partners was organized in 1996 to complete the Unified Modeling Language (UML) specification, and propose it as a response to the OMG RFP. The UML Partners' UML 1.0 specification draft was proposed to the OMG in January 1997. During the same month the UML Partners formed a Semantics Task Force, chaired by Cris Kobryn and administered by Ed Eykholt, to finalize the semantics of the specification and integrate it with other standardization efforts. The result of this work, UML 1.1, was submitted to the OMG in August 1997 and adopted by the OMG in November 1997[3] . UML 1.x As a modeling notation, the influence of the OMT notation dominates (e. g., using rectangles for classes and objects). Though the Booch "cloud" notation was dropped, the Booch capability to specify lower-level design detail was embraced. The use case notation from Objectory and the component notation from Booch were integrated with the rest of the notation, but the semantic integration was relatively weak in UML 1.1, and was not really fixed until the UML 2.0 major revision.
- 14. Pg 14 Concepts from many other OO methods were also loosely integrated with UML with the intent that UML would support all OO methods. For example CRC Cards (circa 1989 from Kent Beck and Ward Cunningham), and OORam were retained. Many others contributed too with their approaches flavoring the many models of the day including: Tony Wasserman and Peter Pircher with the "Object- Oriented Structured Design (OOSD)" notation (not a method), Ray Buhr's "Systems Design with Ada", Archie Bowen's use case and timing analysis, Paul Ward's data analysis and David Harel's "Statecharts", as the group tried to ensure broad coverage in the real-time systems domain. As a result, UML is useful in a variety of engineering problems, from single process, single user applications to concurrent, distributed systems, making UML rich but large. The Unified Modeling Language is an international standard: Development toward UML 2.0 UML has matured significantly since UML 1.1. Several minor revisions (UML 1.3, 1.4, and 1.5) fixed shortcomings and bugs with the first version of UML, followed by the UML 2.0 major revision that was adopted by the OMG in 2005. There are four parts to the UML 2.x specification: the Superstructure that defines the notation and semantics for diagrams and their model elements; the Infrastructure that defines the core metamodel on which the Superstructure is based; the Object Constraint Language (OCL) for defining rules for model elements; and the UML Diagram Interchange that defines how UML 2 diagram layouts are exchanged. The current versions of these standards follow: UML Superstructure version 2.1.2, UML Infrastructure version 2.1.2, OCL version 2.0, and UML Diagram Interchange version 1.0. Although many UML tools support some of the new features of UML 2.x, the OMG provides no test suite to objectively test compliance with its specifications. Unified Modeling Language topics Methods UML is not a method by itself; however, it was designed to be compatible with the leading object-oriented software development methods of its time (for example OMT, Booch method, Objectory). Since UML has evolved, some of these methods have been recast to take advantage of the new notations (for example OMT), and new methods have been created based on UML. The best known is IBM Rational Unified Process (RUP). There are many other UML-based methods like Abstraction Method, Dynamic Systems Development
- 15. Pg 15 Method, and others, designed to provide more specific solutions, or achieve different objectives. Modelling It is very important to distinguish between the UML model and the set of diagrams of a system. A diagram is a partial graphical representation of a system's model. The model also contains a "semantic backplane" — documentation such as written use cases that drive the model elements and diagrams. UML diagrams represent three different views of a system model: • Functional requirements view: Emphasizes the functional requirements of the system from the user's point of view. And includes use case diagrams. • Static structural view: Emphasizes the static structure of the system using objects, attributes, operations and relationships. And includes class diagrams and composite structure diagrams. • Dynamic behavior view: Emphasizes the dynamic behavior of the system by showing collaborations among objects and changes to the internal states of objects. And includes sequence diagrams, activity diagrams and state machine diagrams. UML models can be exchanged among UML tools by using the XMI interchange format. Diagrams overview UML 2.0 has 13 types of diagrams divided into three categories: Six diagram types represent structure application structure, three represent general types of behavior, and four represent different aspects of interactions. These diagrams can be categorized hierarchically as shown in the following Class diagram:
- 16. Pg 16 UML does not restrict UML element types to a certain diagram type. In general, every UML element may appear on almost all types of diagrams. This flexibility has been partially restricted in UML 2.0. In keeping with the tradition of engineering drawings, a comment or note explaining usage, constraint, or intent is always allowed in a UML diagram. Structure diagrams Structure diagrams emphasize what things must be in the system being modeled: • Class diagram: describes the structure of a system by showing the system's classes, their attributes, and the relationships among the classes. • Component diagram: depicts how a software system is split up into components and shows the dependencies among these components. • Composite structure diagram: describes the internal structure of a class and the collaborations that this structure makes possible. • Deployment diagram serves to model the hardware used in system implementations, the components deployed on the hardware, and the associations among those components. • Object diagram: shows a complete or partial view of the structure of a modeled system at a specific time. • Package diagram: depicts how a system is split up into logical groupings by showing the dependencies among these groupings. Class diagram Component diagram Composite structure diagrams Deployment diagram Object diagram Package diagram
- 17. Pg 17 Behavior diagrams Behavior diagrams emphasize what must happen in the system being modeled: • Activity diagram: represents the business and operational step-by-step workflows of components in a system. An activity diagram shows the overall flow of control. • State diagram: standardized notation to describe many systems, from computer programs to business processes. • Use case diagram: shows the functionality provided by a system in terms of actors, their goals represented as use cases, and any dependencies among those use cases. UML Activity DiagramState Machine diagram Use case diagram Interaction diagrams Interaction diagrams, a subset of behavior diagrams, emphasize the flow of control and data among the things in the system being modelled: • Communication diagram shows the interactions between objects or parts in terms of sequenced messages. They represent a combination of information taken from Class, Sequence, and Use Case Diagrams describing both the static structure and dynamic behavior of a system. • Interaction overview diagram: a type of activity diagram in which the nodes represent interaction diagrams. • Sequence diagram: shows how objects communicate with each other in terms of a sequence of messages. Also indicates the lifespans of objects relative to those messages. • Timing diagrams: are a specific type of interaction diagram, where the focus is on timing constraints. Communication diagram Interaction overview diagram Sequence diagram The Protocol State Machine is a sub-variant of the State Machine. It may be used to model network communication protocols.
- 18. Pg 18 The Relevance of UML to Software People all over the world use common notations usually pictorial to depict events, actions, operations or activities. Example is in the fields of mathematics where signs such as +, =, - etc are common and generally accepted arithmetic notations. With little or no explanation everyone can easily understand what they mean. Another mathematic example is diagram such as the one below; Now this triangle is unambiguously a right angle triangle, because the little square attached is a worldwide convention meaning "right angle." Furthermore, the sides of the triangle can be labelled A, B, and C: And, immediately, we can write down that A2 + B2 = C2 Now this has a few very endearing properties. First, it is once again an example of a universal notation. Right angles, right triangles, and the symbols representing them are the same all over the world; someone from ancient Egypt could in principle reason about right triangles with a modern Peruvian by drawing such diagrams. What's more, once the diagram for the right triangle has been written down, the relationship of A, B, and C is defined. A, B, and C can no longer have completely arbitrary values; once any two of them are specified, the third is determined as well. The diagram implies the Pythagorean Theorem. One could even go so far as to say that the diagram has some "semantics," that there is a well-understood relationship between the picture and the values implied by the letters.
- 19. Pg 19 What is truly amazing about this example is that anyone with a high school education can understand it. If the person has seen any geometry at all, they have seen triangles and right triangles, and if they remember anything at all from their geometry, it is good old Pythagoras. We can say that not only in mathematics but in all other fields progress is made by having a common notation that can be used to express concepts, and how diagrams begin to take on precision and meaning once we attach semantics to the pictures. The most useful of these notations are understood the world over. But before 1996 there was no common notation for software. Before the UML became an international standard, two software engineers, even if they spoke the same language, had no way to talk about their software. There were no conventions that were universally accepted around the world for describing software. No wonder progress was slow! With the advent of the UML, however, software engineers have a common graphic vocabulary for talking about software. They can draw progressively complex diagrams to represent their software, just the way electrical engineers can draw progressively complex diagrams to represent their circuits. An electrical circuit Things like nested diagrams become possible, so different levels of abstraction can now be expressed. Rational's contribution in this area is huge. By formulating the UML and bringing the world's most influential companies -- IBM, Microsoft, HP, Oracle, etc.-- to agree on it was a major step. Getting an international standards body -- the Object Management Group – (OMG) to ratify it as a standard was the formal process
- 20. Pg 20 that irreversibly cast the die. Everyone agreed to end the Tower of Babel approach and also agreed about how to talk about software. The significance of the UML is now established, and we can move on.
- 21. Pg 21 WEEK Three THE STRUCTURE DIAGRAM – Introduction The structure diagrams show the static structure of the system being modelled; focusing on the elements of a system, irrespective of time. Static structure is conveyed by showing the types and their instances in the system. Besides showing system types and their instances, structure diagrams also show at least some of the relationships among and between these elements and potentially even show their internal structure. Structure diagrams are useful throughout the software lifecycle for a variety of team members. In general, these diagrams allow for design validation and design communication between individuals and teams. For example, business analysts can use class or object diagrams to model a business's current assets and resources, such as account ledgers, products, or geographic hierarchy. Architects can use the component and deployment diagrams to test/verify that their design is sound. Developers can use class diagrams to design and document the system's coded (or soon-to-be-coded) classes. The Structure diagrams and its various components are highlighted as below. The class diagram
- 22. Pg 22 The Class diagram describes the structure of a system by showing the system's classes, their attributes, and the relationships among the classes. UML 2 considers structure diagrams as a classification; there is no diagram itself called a "Structure Diagram." However, the class diagram offers a prime example of the structure diagram type, and provides us with an initial set of notation elements that all other structure diagrams use. And because the class diagram is so foundational, the remainder of this article will focus on the class diagram's notation set. By the end of this article you should have an understanding of how to draw a UML 2 class diagram and have a solid footing for understanding other structure diagrams when we cover them in later articles. The basics of Class Diagram It is more important than ever in UML 2 to understand the basics of the class diagram. This is because the class diagram provides the basic building blocks for all other structure diagrams, such as the component or object diagrams. As mentioned earlier, the purpose of the class diagram is to show the types being modelled within the system. In most UML models these types include: • a class • an interface • a data type • a component. UML uses a special name for these types: "classifiers." Generally, you can think of a classifier as a class, but technically a classifier is a more general term that refers to the other three types above as well. Class name The UML representation of a class is a rectangle containing three compartments stacked vertically, as shown in Figure 3.1. The top compartment shows the class's name. The middle compartment lists the class's attributes. The bottom compartment lists the class's operations. When drawing a class element on a class diagram, you must use the top compartment, and the bottom two compartments
- 23. Pg 23 are optional. (The bottom two would be unnecessary on a diagram depicting a higher level of detail in which the purpose is to show only the relationship between the classifiers.) Figure 3.1 shows an airline flight modelled as a UML class. As we can see, the name is Flight, and in the middle compartment we see that the Flight class has three attributes: flightNumber, departureTime, and flightDuration. In the bottom compartment we see that the Flight class has two operations: delayFlight and getArrivalTime. Figure 1: Class diagram for the class Flight Class attribute list The attribute section of a class (the middle compartment) lists each of the class's attributes on a separate line. The attribute section is optional, but when used it contains each attribute of the class displayed in a list format. The line uses the following format: name : attribute type flightNumber : Integer Continuing with our Flight class example, we can describe the class's attributes with the attribute type information, as shown in Table 3.1. Table 3.1: The Flight class's attribute names with their associated types Attribute Name Attribute Type flightNumber Integer departureTime Date flightDuration Minutes
- 24. Pg 24 In business class diagrams, the attribute types usually correspond to units that make sense to the likely readers of the diagram (i.e., minutes, dollars, etc.). However, a class diagram that will be used to generate code needs classes whose attribute types are limited to the types provided by the programming language, or types included in the model that will also be implemented in the system. Sometimes it is useful to show on a class diagram that a particular attribute has a default value. (For example, in a banking account application a new bank account would start off with a zero balance.) The UML specification allows for the identification of default values in the attribute list section by using the following notation: name : attribute type = default value For example: balance : Dollars = 0 Showing a default value for attributes is optional; Figure 3.2 shows a Bank Account class with an attribute called balance, which has a default value of 0. Figure 3.2: A Bank Account class diagram showing the balance attribute's value defaulted to zero dollars. Class operations list The class's operations are documented in the third (lowest) compartment of the class diagram's rectangle, which again is optional. Like the attributes, the operations of a class are displayed in a list format, with each operation on its own line. Operations are documented using the following notation: name(parameter list) : type of value returned The Flight class's operations are mapped in Table 2 below.
- 25. Pg 25 Table 3.2: Flight class's operations mapped from Figure 3.2 Operation Name Parameters Return Value Type delayFlight Name Type numberOfMinutes Minutes N/A getArrivalTime N/A Date Figure 3.3 shows that the delayFlight operation has one input parameter -- numberOfMinutes -- of the type Minutes. However, the delayFlight operation does not have a return value. When an operation has parameters, they are put inside the operation's parentheses; each parameter uses the format "parameter name : parameter type". Figure 3.3: The Flight class operations parameters include the optional "in" marking. When documenting an operation's parameters, you may use an optional indicator to show whether or not the parameter is input to, or output from, the operation. This optional indicator appears as an "in" or "out" as shown in the operations compartment in Figure 2. Typically, these indicators are unnecessary unless an older programming language such as Fortran will be used, in which case this information can be helpful. However, in C++ and Java, all parameters are "in" parameters and since "in" is the parameter's default type according to the UML specification, most people will leave out the input/output indicators. Inheritance
- 26. Pg 26 A very important concept in object-oriented design, inheritance, refers to the ability of one class (child class) to inherit the identical functionality of another class (super class), and then add new functionality of its own. (In a very non-technical sense, imagine that I inherited my mother's general musical abilities, but in my family I'm the only one who plays electric guitar.) To model inheritance on a class diagram, a solid line is drawn from the child class (the class inheriting the behavior) with a closed, unfilled arrowhead (or triangle) pointing to the super class. Consider types of bank accounts: Figure 3.4 shows how both CheckingAccount and SavingsAccount classes inherit from the BankAccount class. Figure 3.4: Inheritance is indicated by a solid line with a closed, unfilled arrowhead pointing at the super class. In Figure 3.4, the inheritance relationship is drawn with separate lines for each subclass, which is the method used in IBM Rational Rose and IBM Rational XDE. However, there is an alternative way to draw inheritance called tree notation. You can use tree notation when there are two or more child classes, as in Figure 3.4, except that the inheritance lines merge together like a tree branch. Figure 3.5 is a redrawing of the same inheritance shown in Figure 3.4, but this time using tree notation.
- 27. Pg 27 Figure 3.5: An example of inheritance using tree notation Abstract classes and operations The observant reader will notice that the diagrams in Figures 3.4 and 3.5 use italicized text for the BankAccount class name and withdrawal operation. This indicates that the BankAccount class is an abstract class and the withdrawal method is an abstract operation. In other words, the BankAccount class provides the abstract operation signature of withdrawal and the two child classes of CheckingAccount and SavingsAccount each implement their own version of that operation. However, super classes (parent classes) do not have to be abstract classes. It is normal for a standard class to be a super class. Associations When you model a system, certain objects will be related to each other, and these relationships themselves need to be modelled for clarity. There are five types of associations. -- bi-directional, uni- directional associations, Association class, Aggregation, and Reflexive associations -- Bi-directional (standard) association An association is a linkage between two classes. Associations are always assumed to be bi-directional; this means that both classes are aware of each other and their relationship, unless you qualify the association as some other type. Going back to our Flight example, Figure 3.6 shows a standard kind of association between the Flight class and the Plane class.
- 28. Pg 28 Figure 3.6: An example of a bi-directional association between a Flight class and a Plane class A bi-directional association is indicated by a solid line between the two classes. At either end of the line, you place a role name and a multiplicity value. Figure 3.6 shows that the Flight is associated with a specific Plane, and the Flight class knows about this association. The Plane takes on the role of "assignedPlane" in this association because the role name next to the Plane class says so. The multiplicity value next to the Plane class of 0..1 means that when an instance of a Flight exists, it can either have one instance of a Plane associated with it or no Planes associated with it (i.e., maybe a plane has not yet been assigned). Figure 3.6 also shows that a Plane knows about its association with the Flight class. In this association, the Flight takes on the role of "assignedFlights"; the diagram in Figure 3.6 tells us that the Plane instance can be associated either with no flights (e.g., it's a brand new plane) or with up to an infinite number of flights (e.g., the plane has been in commission for the last five years). For those wondering what the potential multiplicity values are for the ends of associations, Table 3.3 below lists some example multiplicity values along with their meanings. Table 3.3: Multiplicity values and their indicators Potential Multiplicity Values Indicator Meaning 0..1 Zero or one 1 One only 0..* Zero or more * Zero or more 1..* One or more 3 Three only 0..5 Zero to Five
- 29. Pg 29 5..15 Five to Fifteen Uni-directional association In a uni-directional association, two classes are related, but only one class knows that the relationship exists. Figure 3.7 shows an example of an overdrawn accounts report with a uni-directional association. Figure 3.7: An example of a uni-directional association: The OverdrawnAccountsReport class knows about the BankAccount class, but the BankAccount class does not know about the association. A uni-directional association is drawn as a solid line with an open arrowhead (not the closed arrowhead, or triangle, used to indicate inheritance) pointing to the known class. Like standard associations, the uni-directional association includes a role name and a multiplicity value, but unlike the standard bi-directional association, the uni-directional association only contains the role name and multiplicity value for the known class. In our example in Figure 3.7, the OverdrawnAccountsReport knows about the BankAccount class, and the BankAccount class plays the role of "overdrawnAccounts." However, unlike a standard association, the BankAccount class has no idea that it is associated with the OverdrawnAccountsReport. Association class In modeling an association, there are times when you need to include another class because it includes valuable information about the relationship. For this you would use an association class that you tie to the primary association. An association class is represented like a normal class. The difference is that the association line between the primary classes intersects a dotted line connected to the association class. Figure 3.8 shows an association class for our airline industry example.
- 30. Pg 30 Figure 3.8: Adding the association class MileageCredit In the class diagram shown in Figure 11, the association between the Flight class and the FrequentFlyer class results in an association class called MileageCredit. This means that when an instance of a Flight class is associated with an instance of a FrequentFlyer class, there will also be an instance of a MileageCredit class. Aggregation Aggregation is a special type of association used to model a "whole to its parts" relationship. In basic aggregation relationships, the lifecycle of a part class is independent from the whole class's lifecycle. For example, we can think of Car as a whole entity and Car Wheel as part of the overall Car. The wheel can be created weeks ahead of time, and it can sit in a warehouse before being placed on a car during assembly. In this example, the Wheel class's instance clearly lives independently of the Car class's instance. However, there are times when the part class's lifecycle is not independent from that of the whole class -- this is called composition aggregation. Consider, for example, the relationship of a company to its departments. Both Company and Departments are modelled as classes, and a department cannot exist before a company exists. Here the Department class's instance is dependent upon the existence of the Company class's instance. Let's explore basic aggregation and composition aggregation further. Basic aggregation An association with an aggregation relationship indicates that one class is a part of another class. In an aggregation relationship, the child class instance can outlive its parent class. To represent an aggregation relationship, you draw a solid line from the parent class to the part class, and draw an unfilled diamond shape on the parent class's association end. Figure 3.9 shows an example of an aggregation relationship between a Car and a Wheel.
- 31. Pg 31 Figure 3.9: Example of an aggregation association Composition aggregation The composition aggregation relationship is just another form of the aggregation relationship, but the child class's instance lifecycle is dependent on the parent class's instance lifecycle. In Figure 3.10, which shows a composition relationship between a Company class and a Department class, notice that the composition relationship is drawn like the aggregation relationship, but this time the diamond shape is filled. Figure 3.10: Example of a composition relationship In the relationship modelled in Figure 3.10, a Company class instance will always have at least one Department class instance. Because the relationship is a composition relationship, when the Company instance is removed/destroyed, the Department instance is automatically removed/destroyed as well. Another important feature of composition aggregation is that the part class can only be related to one instance of the parent class (e.g. the Company class in our example). Reflexive associations We have now discussed all the association types. As you may have noticed, all our examples have shown a relationship between two different classes. However, a class can also be associated with itself, using a reflexive association. This may not make sense at first, but remember that classes are abstractions. Figure 3.11 shows how an Employee class could be related to itself through the manager/manages role. When a class is associated to itself, this does not mean that a class's instance is related to itself, but that an instance of the class is related to another instance of the class.
- 32. Pg 32 Figure 3.11: Example of a reflexive association relationship The relationship drawn in Figure 3.12 means that an instance of Employee can be the manager of another Employee instance. However, because the relationship role of "manages" has a multiplicity of 0..*; an Employee might not have any other Employees to manage.
- 33. Pg 33 WEEK Four Packages Inevitably, if you are modelling a large system or a large area of a business, there will be many different classifiers in your model. Managing all the classes can be a daunting task; therefore, UML provides an organizing element called a package. Packages enable modellers to organize the model's classifiers into namespaces, which is sort of like folders in a filing system. Dividing a system into multiple packages makes the system easier to understand, especially if each package represents a specific part of the system. There are two ways of drawing packages on diagrams. There is no rule for determining which notation to use, except to use your personal judgement regarding which is easiest to read for the class diagram you are drawing. Both ways begin with a large rectangle with a smaller rectangle (tab) above its upper left corner, as seen in Figure 3.13. But the modeller must decide how the package's membership is to be shown, as follows: • If the modeller decides to show the package's members within the large rectangle, then all those members need to be placed within the rectangle. Also the package's name needs to be placed in the package's smaller rectangle (as shown in Figure 3.12). • If the modeller decides to show the package's members outside the large rectangle then all the members that will be shown on the diagram need to be placed outside the rectangle. To show what classifiers belong to the package, a line is drawn from each classifier to a circle that has a plus sign inside the circle attached to the package (Figure 3.13).
- 34. Pg 34 Figure 3.12: An example package element that shows its members inside the package's rectangle boundaries
- 35. Pg 35 Figure 3.13: An example package element showing its membership via connected lines Interfaces Earlier in this article, it is suggested that you think of classifiers simply as classes. In fact, a classifier is a more general concept, which includes data types and interfaces. So why do I mention data types and interfaces here? There are times when you might want to model these classifier types on a structure diagram, and it is important to use the proper notation in doing so, or at least be aware of these classifier types. Drawing these classifiers incorrectly will likely confuse readers of your structure diagram, and the ensuing system will probably not meet requirements.
- 36. Pg 36 A class and an interface differ: A class can have an actual instance of its type, whereas an interface must have at least one class to implement it. In UML 2, an interface is considered to be a specialization of a class modelling element. Therefore, an interface is drawn just like a class, but the top compartment of the rectangle also has the text "«interface»", as shown in Figure 3.14 Figure 3.14: Example of a class diagram in which the Professor and Student classes implement the Person interface In the diagram shown in Figure 3.14, both the Professor and Student classes implement the Person interface and do not inherit from it. We know this for two reasons: 1) The Person object is defined as an interface -- it has the "«interface»" text in the object's name area, and we see that the Professor and Student objects are class objects because they are labelled according to the rules for drawing a class object (there is no additional classification text in their name area). 2) We know inheritance is not being shown here, because the line with the arrow is dotted and not solid. As shown in Figure 3.15, a dotted line with a closed, unfilled arrow means realization (or implementation); as we saw in Figure 3.4, a solid arrow line with a closed, unfilled arrow means inheritance. Visibility In object-oriented design, there is a notation of visibility for attributes and operations. UML identifies four types of visibility: public, protected, private, and package.
- 37. Pg 37 The UML specification does not require attributes and operations visibility to be displayed on the class diagram, but it does require that it be defined for each attribute or operation. To display visibility on the class diagram, you place the visibility mark in front of the attribute's or operation's name. Though UML specifies four visibility types, an actual programming language may add additional visibilities, or it may not support the UML-defined visibilities. Table 3.4 displays the different marks for the UML-supported visibility types. Table 3.4: Marks for UML-supported visibility types Mark Visibility type + Public # Protected - Private ~ Package Now, let's look at a class that shows the visibility types indicated for its attributes and operations. In Figure 3.15, all the attributes and operations are public, with the exception of the updateBalance operation. The updateBalance operation is protected. Figure 3.15: A BankAccount class that shows the visibility of its attributes and operations Instances When modelling a system's structure it is sometimes useful to show example instances of the classes. To model this, UML 2 provides the
- 38. Pg 38 instance specification element, which shows interesting information using example (or real) instances in the system. The notation of an instance is the same as a class, but instead of the top compartment merely having the class's name, the name is an underlined concatenation of: For example: Donald : Person Because the purpose of showing instances is to show interesting or relevant information, it is not necessary to include in your model the entire instance's attributes and operations. Instead it is completely appropriate to show only the attributes and their values that are interesting as depicted in Figure 3.16. Figure 3.16: An example instance of a Plane class (only the interesting attribute values are shown) However, merely showing some instances without their relationship is not very useful; therefore, UML 2 allows for the modelling of the relationships/associations at the instance level as well. The rules for drawing associations are the same as for normal class relationships, although there is one additional requirement when modelling the associations. The additional restriction is that association relationships must match the class diagram's relationships and therefore the association's role names must also match the class diagram. An example of this is shown in Figure 3.17. In this example the instances are example instances of the class diagram found in Figure 3.6. Instance Name : Class Name
- 39. Pg 39 Figure 3.17: An example of Figure 3.6 using instances instead of classes Figure 3.17 has two instances of the Flight class because the class diagram indicated that the relationship between the Plane class and the Flight class is zero-to-many. Therefore, our example shows the two Flight instances that the NX0337 Plane instance is related to. Roles Modelling the instances of classes is sometimes more detailed than one might wish. Sometimes, you may simply want to model a class's relationship at a more generic level. In such cases, you should use the role notation. The role notation is very similar to the instances notation. To model a class's role, you draw a box and place the class's role name and class name inside as with the instances notation, but in this case you do not underline the words. Figure 3.18 shows an example of the roles played by the Employee class described by the diagram at Figure 3.11. In Figure 3.18, we can tell, even though the Employee class is related to itself, that the relationship is really between an Employee playing the role of manager and an Employee playing the role of team member. Figure 3.18: A class diagram showing the class in Figure 14 in its different roles Note that you cannot model a class's role on a plain class diagram, even though Figure 18 makes it appear that you can. In order to use the role notation you will need to use the Internal Structure notation, discussed next.
- 40. Pg 40 Internal Structures One of the more useful features of UML 2 structure diagrams is the new internal structure notation. It allows you to show how a class or another classifier is internally composed. This was not possible in UML 1.x, because the notation set limited you to showing only the aggregation relationships that a class had. Now, in UML 2, the internal structure notation lets you more clearly show how that class's parts relate to each other. Let's look at an example. In Figure 3.18 we have a class diagram showing how a Plane class is composed of four engines and two control software objects. What is missing from this diagram is any information about how airplane parts are assembled. From the diagram in Figure 3.18, you cannot tell if the control software objects control two engines each, or if one control software object controls three engines and the other controls one engine. Figure 3.19: A class diagram that only shows relationships between the objects Drawing a class's internal structure will improve this situation. You start by drawing a box with two compartments. The top compartment contains the class name, and the lower compartment contains the class's internal structure, showing the parent class's part classes in their respective roles, as well as how each particular class relates to others in that role. Figure 3.19 shows the internal structure of Plane class; notice how the internal structure clears up the confusion.
- 41. Pg 41 Figure3. 20: An example internal structure of a Plane class. In Figure 3.20 the Plane has two ControlSoftware objects and each one controls two engines. The ControlSoftware on the left side of the diagram (control1) controls engines 1 and 2. The ControlSoftware on the right side of the diagram (control2) controls engines 3 and 4. Conclusion There are at least two important reasons for understanding the class diagram. The first is that it shows the static structure of classifiers in a system; the second reason is that the diagram provides the basic notation for other structure diagrams prescribed by UML. Developers will think the class diagram was created specially for them; but other team members will find them useful, too. Business analysts can use class diagrams to model systems from the business perspective.
- 42. Pg 42 WEEK Five COMPOSITE DIAGRAM Introduction A composite structure diagram is a diagram that shows the internal structure of a classifier, including its interaction points to other parts of the system. It shows the configuration and relationship of parts, that together, perform the behavior of the containing classifier. Class elements have been described in great detail in the section on class diagrams. This section describes the way classes can be displayed as composite elements exposing interfaces and containing ports and parts. Part A part is an element that represents a set of one or more instances which are owned by a containing classifier instance. So for example, if a diagram instance owned a set of graphical elements, then the graphical elements could be represented as parts; if it were useful to do so, to model some kind of relationship between them. Note that a part can be removed from its parent before the parent is deleted, so that the part isn't deleted at the same time. A part is shown as an unadorned rectangle contained within the body of a class or component element.
- 43. Pg 43 Port A port is a typed element that represents an externally visible part of a containing classifier instance. Ports define the interaction between a classifier and its environment. A port can appear on the boundary of a contained part, a class or a composite structure. A port may specify the services a classifier provides as well as the services that it requires of its environment. A port is shown as a named rectangle on the boundary edge of its owning classifier.
- 44. Pg 44 Interfaces An interface is similar to a class but with a number of restrictions. All interface operations are public and abstract, and do not provide any default implementation. All interface attributes must be constants. However, while a class may only inherit from a single super-class, it may implement multiple interfaces. An interface, when standing alone in a diagram, is either shown as a class element rectangle with the «interface» keyword and with its name italicized to denote it is abstract, or it is shown as a circle. Note that the circle notation does not show the interface operations. When interfaces are shown as being owned by classes, they are referred to as exposed interfaces. An exposed interface can be defined as either provided or required. A provided interface is an affirmation that the containing classifier supplies the operations defined by the named interface element and is defined by drawing a realization link between the class and the interface. A required interface is a statement that the classifier is able to communicate with some other classifier which provides operations defined by the named interface element and is defined by drawing a dependency link between the class and the interface. A provided interface is shown as a "ball on a stick" attached to the edge of a classifier element. A required interface is shown as a "cup on a stick" attached to the edge of a classifier element.
- 45. Pg 45 Delegate A delegate connector is used for defining the internal workings of a component's external ports and interfaces. A delegate connector is shown as an arrow with a «delegate» keyword. It connects an external contract of a component as shown by its ports to the internal realization of the behavior of the component's part. Collaboration A collaboration defines a set of co-operating roles used collectively to illustrate a specific functionality. A collaboration should only show the roles and attributes required to accomplish its defined task or function. Isolating the primary roles is an exercise in simplifying the structure and clarifying the behavior, and also provides for re-use. A
- 46. Pg 46 collaboration often implements a pattern. A collaboration element is shown as an ellipse. Role Binding A role binding connector is drawn from a collaboration to the classifier that fulfils the role. It is shown as a dashed line with the name of the role at the classifier end. Represents A represents connector may be drawn from a collaboration to a classifier to show that a collaboration is used in the classifier. It is shown as a dashed line with arrowhead and the keyword «represents».
- 47. Pg 47 Occurrence An occurrence connector may be drawn from a collaboration to a classifier to show that a collaboration represents (sic) the classifier. It is shown as a dashed line with arrowhead and the keyword «occurrence».
- 48. Pg 48 WEEK Six THE COMPONENT DIAGRAM Component Diagram depicts how a software system is split up into components and shows the dependencies among these components. Introduction The component diagram's main purpose is to show the structural relationships between the components of a system. In UML 1.1, a component represented implementation items, such as files and executables. Unfortunately, this conflicted with the more common use of the term component," which refers to things such as COM components. Over time and across successive releases of UML, the original UML meaning of components was mostly lost. UML 2 officially changes the essential meaning of the component concept; in UML 2, components are considered autonomous, encapsulated units within a system or subsystem that provide one or more interfaces. Although the UML 2 specification does not strictly state it, components are larger design units that represent things that will typically be implemented using replaceable" modules. But, unlike UML 1.x, components are now strictly logical, design-time constructs. The idea is that you can easily reuse and/or substitute a different component implementation in your designs because a component encapsulates behavior and implements specified interfaces. In component-based development (CBD), component diagrams offer architects a natural format to begin modelling a solution. Component diagrams allow an architect to verify that a system's required functionality is being implemented by components, thus ensuring that the eventual system will be acceptable. In addition, component diagrams are useful communication tools for various groups. The diagrams can be presented to key project stakeholders and implementation staff. While component diagrams are generally geared towards a system's implementation staff, component diagrams can generally put stakeholders at ease because the diagram presents an early understanding of the overall system that is being built. Developers find the component diagram useful because it provides them with a high-level, architectural view of the system that they will be building, which helps developers begin formalizing a roadmap for the implementation, and make decisions about task assignments and/or needed skill enhancements. System
- 49. Pg 49 administrators find component diagrams useful because they get an early view of the logical software components that will be running on their systems. Although system administrators will not be able to identify the physical machines or the physical executables from the diagram, a component diagram will nevertheless be welcomed because it provides early information about the components and their relationships (which allows sys-admins to loosely plan ahead). The notation The component diagram notation set now makes it one of the easiest UML diagrams to draw. Figure 6.1 shows a simple component diagram using the former UML 1.4 notation; the example shows a relationship between two components: an Order System component that uses the Inventory System component. As you can see, a component in UML 1.4 was drawn as a rectangle with two smaller rectangles protruding from its left side. Figure 5.1: This simple component diagram shows the Order System's general dependency using UML 1.4 notation The above UML 1.4 notation is still supported in UML 2. However, the UML 1.4 notation set did not scale well in larger systems. For that reason, UML 2 dramatically enhances the notation set of the component diagram, as we will see throughout the rest of this article. The UML 2 notation set scales better, and the notation set is also more informative while maintaining its ease of understanding. Let's step through the component diagram basics according to UML 2.
- 50. Pg 50 The basics of Component Diagram Drawing a component in UML 2 is now very similar to drawing a class on a class diagram. In fact, in UML 2 a component is merely a specialized version of the class concept. Which means that the notation rules that apply to the class classifier also apply to the component classifier. In UML 2, a component is drawn as a rectangle with optional compartments stacked vertically. A high-level, abstracted view of a component in UML 2 can be modelled as just a rectangle with the component's name and the component stereotype text and/or icon. The component stereotype's text is «component»" and the component stereotype icon is a rectangle with two smaller rectangles protruding on its left side (the UML 1.4 notation element for a component). Figure 6.2 shows three different ways a component can be drawn using the UML 2 specification. Figure 6.2: The different ways to draw a component's name compartment When drawing a component on a diagram, it is important that you always include the component stereotype text (the word "component" inside double angle brackets, as shown in Figure 6.2) and/or icon. The reason? In UML, a rectangle without any stereotype classifier is interpreted as a class element. The component stereotype and/or icon distinguishes this rectangle as a component element. Modelling a component's interfaces Provided/Required The Order components drawn in Figure 6.2 all represent valid notation elements; however, a typical component diagram includes more information. A component element can have additional compartments stacked below the name compartment. As mentioned earlier, a component is an autonomous unit that provides one or more public interfaces. The interfaces provided represent the formal contract of services the component provides to its consumers/clients. Figure 6.3 shows the Order component having a second compartment that denotes what interfaces the Order component provides and requires.
- 51. Pg 51 Figure 6.3: The additional compartment here shows the interfaces that the Order component provides and requires. In the example Order component shown in Figure 6.3, the component provides the interfaces of OrderEntry and AccountPayable. Additionally, the component also requires another component that provides the Person interface. Another approach to modelling a component's interfaces UML 2 has also introduced another way to show a component's provided and required interfaces. This second way builds off the single rectangle, with the component's name in it, and places what the UML 2 specification calls interface symbols" connected to the outside of the rectangle. This second approach is illustrated in Figure 6.4. Figure 6.4: An alternative approach (compare with Figure 6.3) to showing a component's provided/required interfaces using interface symbols
- 52. Pg 52 In this second approach the interface symbols with a complete circle at their end represent an interface that the component provides -- this lollipop" symbol is shorthand for a realization relationship of an interface classifier. Interface symbols with only a half circle at their end (a.k.a. sockets) represent an interface that the component requires (in both cases, the interface's name is placed near the interface symbol itself). Even though Figure 6.4 looks much different from Figure 6.3, both figures provide the same information -- i.e., the Order component provides two interfaces: OrderEntry and AccountPayable, and the Order component requires the Person interface. Modelling a component's relationships When showing a component's relationship with other components, the lollipop and socket notation must also include a dependency arrow (as used in the class diagram). On a component diagram with lollipops and sockets, note that the dependency arrow comes out of the consuming (requiring) socket and its arrow head connects with the provider's lollipop, as shown in Figure 6.5. Figure 6.5: A component diagram that shows how the Order System component depends on other components Figure 6.5 shows that the Order System component depends both on the Customer Repository and Inventory System components. Notice in Figure 6.5 the duplicated names of the interfaces CustomerLookup" and ProductAccessor." While this may seem unnecessarily repetitive in this example, the notation actually allows for different interfaces (and differing names) on each component depending on the implementation differences (e.g., one component provides an interface that is a subclass of a smaller required interface). Subsystems
- 53. Pg 53 In UML 2 the subsystem classifier is a specialized version of a component classifier. Because of this, the subsystem notation element inherits all the same rules as the component notation element. The only difference is that a subsystem notation element has the keyword of subsystem" instead of component," as shown in Figure 6.6. Figure 6.6: An example of a subsystem element The UML 2 specification is quite vague on how a subsystem is different from a component. The specification does not treat a component or a subsystem any differently from a modelling perspective. Compared with UML 1.x, this UML 2 modelling ambiguity is new. But there's a reason. In UML 1.x, a subsystem was considered a package, and this package notation was confusing to many UML practitioners; hence UML 2 aligned subsystems as a specialized component, since this is how most UML 1.x users understood it. This change did introduce fuzziness into the picture, but this fuzziness is more of a reflection of reality versus a mistake in the UML 2 specification. The UML 2 specification says that the decision on when to use a component versus a subsystem is up to the methodology of the modeller. Showing a Component's Internal Structure There will be times when it makes sense to display a component's internal structure. To show a component's inner structure, you merely draw the component larger than normal and place the inner parts inside the name compartment of the encompassing component. Figure 6.7 show's the Store's component inner structure.
- 54. Pg 54 Figure 6.7: This component's inner structure is composed of other components. Using the example shown in Figure 6.7, the Store component provides the interface of OrderEntry and requires the interface of Account. The Store component is made up of three components: Order, Customer, and Product components. Notice how the Store's OrderEntry and Account interface symbols have a square on the edge of the component. This square is called a port. In a simplistic sense, ports provide a way to model how a component's provided/required interfaces relate to its internal parts. By using a port, our diagram is able to de-couple the internals of the Store component from external entities. In Figure 6.7, the OrderEntry port delegates to the Order component's OrderEntry interface for processing. Also, the internal Customer component's required Account interface is delegated to the Store component's required Account interface port. By connecting to the Account port, the internals of the Store component (e.g. the Customer component) can have a local representative of some unknown external entity which implements the port's interface. The required Account interface will be implemented by a component outside of the Store component. You will also notice in Figure 6.7 that the interconnections between the inner components are different from those shown in Figure 6.5. This is because these depictions of internal structures are really collaboration diagrams nested inside the classifier (a component, in our case), since collaboration diagrams show instances or roles of classifiers. The relationship modelled between the internal
- 55. Pg 55 components is drawn with what UML calls an assembly connector." An assembly connector ties one component's provided interface with another component's required interface. Assembly connectors are drawn as lollipop and socket symbols next to each other. Drawing these assembly connectors in this manner makes the lollipop and socket symbols very easy to read. Conclusion The component diagram is a very important diagram that architects will often create early in a project. However, the component diagram's usefulness spans the life of the system. Component diagrams are invaluable because they model and document a system's architecture. Because component diagrams document a system's architecture, the developers and the eventual system administrators of the system find this work product-critical in helping them understand the system. Component diagrams also serve as input to a software system's deployment diagram.
- 56. Pg 56 WEEK Seven OBJECT AND PACKAGE DIAGRAM Object Diagrams Object diagram: shows a complete or partial view of the structure of a modelled system at a specific time. An object diagram may be considered a special case of a class diagram. Object diagrams use a subset of the elements of a class diagram in order to emphasize the relationship between instances of classes at some point in time. They are useful in understanding class diagrams. They don’t show anything architecturally different to class diagrams, but reflect multiplicity and roles. Class and Object Elements The following diagram shows the differences in appearance between a class element and an object element. Note that the class element consists of three parts, being divided into name, attribute and operation compartments; by default, object elements don’t have compartments. The display of names is also different: object names are underlined and may show the name of the classifier from which the object is instantiated. Run Time State A classifier element can have any number of attributes and operations. These aren’t shown in an object instance. It is possible, however, to define an object’s run time state, showing the set values of attributes in the particular instance.
- 57. Pg 57 Example Class and Object Diagrams The following diagram shows an object diagram with its defining class diagram inset, and it illustrates the way in which an object diagram may be used to test the multiplicities of assignments in class diagrams. The car class has a 1-to-many multiplicity to the wheel class, but if a 1-to-4 multiplicity had been chosen instead, that wouldn’t have allowed for the three-wheeled car shown in the object diagram.
- 58. Pg 58 Package Diagrams Package diagram depicts how a system is split up into logical groupings by showing the dependencies among these groupings. Package diagrams are used to reflect the organization of packages and their elements. When used to represent class elements, package diagrams provide a visualization of the namespaces. The most common use for package diagrams is to organize use case diagrams and class diagrams, although the use of package diagrams is not limited to these UML elements. The following is an example of a package diagram. Elements contained in a package share the same namespace. Therefore, the elements contained in a specific namespace must have unique names. Packages can be built to represent either physical or logical relationships. When choosing to include classes in specific packages, it is useful to assign the classes with the same inheritance hierarchy to the same package. There is also a strong argument for including classes that are related via composition, and classes that collaborate with them, in the same package.
- 59. Pg 59 Packages are represented in UML 2.1 as folders and contain the elements that share a namespace; all elements within a package must be identifiable, and so have a unique name or type. The package must show the package name and can optionally show the elements within the package in extra compartments. Package Merge A «merge» connector between two packages defines an implicit generalization between elements in the source package, and elements with the same name in the target package. The source element definitions are expanded to include the element definitions contained in the target. The target element definitions are unaffected, as are the definitions of source package elements that don't match names with any element in the target package. Package Import The «import» connector indicates that the elements within the target package, which in this example is a single class, use unqualified names when being referred to from the source package. The source package's namespace gains access to the target classes; the target's namespace is not affected. Nesting Connectors The nesting connector between the target package and source packages shows that the source package is fully contained in the target package.
- 60. Pg 60 WEEK Eight DEPLOYMENT Deployment Diagrams Deployment diagram serves to model the hardware used in system implementations, the components deployed on the hardware, and the associations among those components. A deployment diagram models the run-time architecture of a system. It shows the configuration of the hardware elements (nodes) and shows how software elements and artifacts are mapped onto those nodes. Node A Node is either a hardware or software element. It is shown as a three-dimensional box shape, as shown below. Node Instance A node instance can be shown on a diagram. An instance can be distinguished from a node by the fact that its name is underlined and has a colon before its base node type. An instance may or may not have a name before the colon. The following diagram shows a named instance of a computer.
- 61. Pg 61 Node Stereotypes A number of standard stereotypes are provided for nodes, namely «cdrom», «cd-rom», «computer», «disk array», «pc», «pc client», «pc server», «secure», «server», «storage», «unix server», «user pc». These will display an appropriate icon in the top right corner of the node symbol Artifact An artifact is a product of the software development process. That may include process models (e.g. use case models, design models etc), source files, executables, design documents, test reports, prototypes, user manuals, etc. An artifact is denoted by a rectangle showing the artifact name, the «artifact» keyword and a document icon, as shown below.
- 62. Pg 62 Association In the context of a deployment diagram, an association represents a communication path between nodes. The following diagram shows a deployment diagram for a network, depicting network protocols as stereotypes, and multiplicities at the association ends. Node as Container A node can contain other elements, such as components or artifacts. The following diagram shows a deployment diagram for part of an embedded system, depicting an executable artifact as being contained by the motherboard node.
- 63. Pg 63
- 64. Pg 64 WEEK Nine THE BEHAVIOUR DIAGRAM The Behavior diagrams emphasize what must happen in the system being modelled: Activity Diagrams In UML, an activity diagram is used to display the sequence of activities. Activity diagrams show the workflow from a start point to the finish point detailing the many decision paths that exist in the progression of events contained in the activity. They may be used to detail situations where parallel processing may occur in the execution of some activities. Activity diagrams are useful for business modelling where they are used for detailing the processes involved in business activities.
- 65. Pg 65 An Example of an activity diagram is shown below. The following sections describe the elements that constitute an activity diagram. Activities An activity is the specification of a parameterized sequence of behaviour. An activity is shown as a round-cornered rectangle enclosing all the actions, control flows and other elements that make up the activity.
- 66. Pg 66 Actions An action represents a single step within an activity. Actions are denoted by round-cornered rectangles. Action Constraints Constraints can be attached to an action. The following diagram shows an action with local pre- and post-conditions. Control Flow A control flow shows the flow of control from one action to the next. Its notation is a line with an arrowhead.
- 67. Pg 67 Initial Node An initial or start node is depicted by a large black spot, as shown below. Final Node There are two types of final node: activity and flow final nodes. The activity final node is depicted as a circle with a dot inside. The flow final node is depicted as a circle with a cross inside.
- 68. Pg 68 The difference between the two node types is that the flow final node denotes the end of a single control flow; the activity final node denotes the end of all control flows within the activity. Objects and Object Flows An object flow is a path along which objects or data can pass. An object is shown as a rectangle. An object flow is shown as a connector with an arrowhead denoting the direction the object is being passed. An object flow must have an object on at least one of its ends. A shorthand notation for the above diagram would be to use input and output pins. A data store is shown as an object with the «datastore» keyword.
- 69. Pg 69 Decision and Merge Nodes Decision nodes and merge nodes have the same notation: a diamond shape. They can both be named. The control flows coming away from a decision node will have guard conditions which will allow control to flow if the guard condition is met. The following diagram shows use of a decision node and a merge node. Fork and Join Nodes Forks and joins have the same notation: either a horizontal or vertical bar (the orientation is dependent on whether the control flow is running left to right or top to bottom). They indicate the start and end of concurrent threads of control. The following diagram shows an example of their use.
- 70. Pg 70 A join is different from a merge in that the join synchronizes two inflows and produces a single outflow. The outflow from a join cannot execute until all inflows have been received. A merge passes any control flows straight through it. If two or more inflows are received by a merge symbol, the action pointed to by its outflow is executed two or more times. Expansion Region An expansion region is a structured activity region that executes multiple times. Input and output expansion nodes are drawn as a group of three boxes representing a multiple selection of items. The keyword "iterative", "parallel" or "stream" is shown in the top left corner of the region. Exception Handlers Exception Handlers can be modelled on activity diagrams as in the example below.
- 71. Pg 71 Interruptible Activity Region An interruptible activity region surrounds a group of actions that can be interrupted. In the very simple example below, the "Process Order" action will execute until completion, when it will pass control to the "Close Order" action, unless a "Cancel Request" interrupt is received, which will pass control to the "Cancel Order" action. Partition An activity partition is shown as either a horizontal or vertical swimlane. In the following diagram, the partitions are used to separate actions within an activity into those performed by the accounting department and those performed by the customer.
- 72. Pg 72
- 73. Pg 73 WEEK Ten THE USE CASE MODEL The use case model captures the requirements of a system. Use cases are a means of communicating with users and other stakeholders what the system is intended to do. Use case diagram shows the functionality provided by a system in terms of actors, their goals represented as use cases, and any dependencies among those use cases. Use Case Model Actors A use case diagram shows the interaction between the system and entities external to the system. These external entities are referred to as actors. Actors represent roles which may include human users, external hardware or other systems. An actor is usually drawn as a named stick figure, or alternatively as a class rectangle with the «actor» keyword.
- 74. Pg 74 Actors can generalize other actors as detailed in the following diagram: Use Cases A use case is a single unit of meaningful work. It provides a high-level view of behavior observable to someone or something outside the system. The notation for a use case is an ellipse. The notation for using a use case is a connecting line with an optional arrowhead showing the direction of control. The following diagram indicates that the actor "Customer" uses the "Withdraw" use case.
- 75. Pg 75 The uses connector can optionally have multiplicity values at each end, as in the following diagram, which shows a customer may only have one withdrawal session at a time, but a bank may have any number of customers making withdrawals concurrently. Use Case Definition A use case typically Includes: • Name and description • Requirements • Constraints • Scenarios • Scenario diagrams • Additional information. Name and Description A use case is normally named as a verb-phrase and given a brief informal textual description. Requirements The requirements define the formal functional requirements that a use case must supply to the end user. They correspond to the functional specifications found in structured methodologies. A requirement is a contract or promise that the use case will perform an action or provide some value to the system.
- 76. Pg 76 Constraints A constraint is a condition or restriction that a use case operates under and includes pre-, post- and invariant conditions. A precondition specifies the conditions that need to be met before the use case can proceed. A post-condition is used to document the change in conditions that must be true after the execution of the use case. An invariant condition specifies the conditions that are true throughout the execution of the use case. Scenarios A Scenario is a formal description of the flow of events that occur during the execution of a use case instance. It defines the specific sequence of events between the system and the external actors. It is normally described in text and corresponds to the textual representation of the sequence diagram. Including Use Cases Use cases may contain the functionality of another use case as part of their normal processing. In general it is assumed that any included use case will be called every time the basic path is run. An example of this is to have the execution of the use case <Card Identification> to be run as part of a use case <Withdraw>. Use Cases may be included by one or more Use Case, helping to reduce the level of duplication of functionality by factoring out common behavior into Use Cases that are re-used many times. Extending Use Cases One use case may be used to extend the behavior of another; this is typically used in exceptional circumstances. For example, if before modifying a particular type of customer order, a user must get approval from some higher authority, then the <Get Approval> use case may optionally extend the regular <Modify Order> use case.
- 77. Pg 77 Extension Points The point at which an extending use case is added can be defined by means of an extension point. System Boundary It is usual to display use cases as being inside the system and actors as being outside the system.
- 78. Pg 78
- 79. Pg 79 WEEK Eleven THE STATE MACHINE MODEL A state machine diagram models the behaviour of a single object, specifying the sequence of events that an object goes through during its lifetime in response to events. State diagram standardized notation to describe many systems, from computer programs to business processes. As an example, the following state machine diagram shows the states that a door goes through during its lifetime. The door can be in one of three states: "Opened", "Closed" or "Locked". It can respond to the events Open, Close, Lock and Unlock. Notice that not all events are valid in all states; for example, if a door is opened, you cannot lock it until you close it. Also notice that a state transition can have a guard condition attached: if the door is Opened, it can only respond to the Close event if the condition doorWay->isEmpty is fulfilled. The syntax and conventions used in state machine diagrams will be discussed in full in the following sections. States A state is denoted by a round-cornered rectangle with the name of the state written inside it.
- 80. Pg 80 Initial and Final States The initial state is denoted by a filled black circle and may be labelled with a name. The final state is denoted by a circle with a dot inside and may also be labelled with a name. Transitions Transitions from one state to the next are denoted by lines with arrowheads. A transition may have a trigger, a guard and an effect, as below. "Trigger" is the cause of the transition, which could be a signal, an event, a change in some condition, or the passage of time. "Guard" is a condition which must be true in order for the trigger to cause the transition. "Effect" is an action which will be invoked directly on the object that owns the state machine as a result of the transition.