SlideShare a Scribd company logo
1 of 14
Download to read offline
CAPITAL MARKET INSIGHTS ADEL S AL-GHAMDI, CFA
1
RETAIL DOMINATION OF SAUDI STOCK MARKET TRADING ACTIVITY
CONTINUES TO PROVOKE VOLATILITY
Since opening its doors to Qualified Foreign Institutional Investors in mid-June 2015 the
Tadawul All Share Index ended the year 28% lower, with Saudi retail investors inciting a sizable
portion of this decline.
JANUARY 20, 2016
Since the activation of the Qualified Foreign Investor (QFI) framework in mid-June, 2015 the Tadawul All
Share Index (TASI) has declined from 9645 to end the year at 6912, erasing SAR 558bn (USD 148bn) in
market value, with Saudi retail investors inciting the dominant portion of this decline.
Tadawul All Share Index (TASI) YTD Performance
1st Jan 2015 - 31st Dec 2015
TASIYTDPerformance(%)
Source: Saudi Stock Exchange Data (1st Jan 2015 to 31st Dec 2015)
-20.0%
-15.0%
-10.0%
-5.0%
0.0%
5.0%
10.0%
15.0%
20.0%
01/01/15 01/02/15 01/03/15 01/04/15 01/05/15 01/06/15 01/07/15 01/08/15 01/09/15 01/10/15 01/11/15 01/12/15
H1 2015 H2 2015
15 JUNE
QFI
Figure 1
-28% 2015
-17%
Indeed, over the 1st
June to 31st
December period, Saudi retail investors have purchased the equivalent
of SAR 321.4bn in shares and sold SAR 359.4bn, resulting in net sales of SAR 38.1bn, and representing 77%
of aggregate net selling activity over this period.
Contrarily, Saudi institutional investors (corporates, mutual funds, financial intermediaries, government
related entities, etc.) have purchased the equivalent of SAR 101.3bn in shares, and sold SAR 52.7bn,
resulting in SAR 48.6bn in net purchases, and representing 98% of aggregate net buying activity over the
same period.
Ultimately the net selling activity of Saudi retail investors has continued to be counterbalanced by the net
buying activity of Saudi institutional investors, albeit in a declining market. Suffice to say that this is not a
recent phenomenon, but a representation of dynamics that have persisted since this data began being
published, back in January 2008.
CAPITAL MARKET INSIGHTS ADEL S AL-GHAMDI, CFA
2
Net Traded Value (by Investor Class)
1st Jun 2015 - 31st Dec 2015
SAR Million
NetTradedValue(SARm)
NET
BUYERS
TOTAL = +SAR49,464 M
Source: Analysis of Monthly Stock Market Ownership and Trading Activity Reports published by Saudi Stock Exchange (Jun – Dec 2015)
NET
SELLERS
TOTAL = -SAR49,464 M
Represents
98% of Net
Buying
Activity
Represents
77% of Net
Selling
Activity
Figure 2
Even more intriguing is the proportion of buying and selling activity of Saudi retail investors who, despite
only owning 4.5% of stock market value, have made up 44.0% of buying activity and 49.3% of selling
activity over the analysis period; behavior which is emblematic of a very short-term speculative trading
philosophy.
Ownership vs Trading Activity (by Investor Class)
1st Jun 2015 - 31st Dec 2015
STOCK MARKET OWNERSHIP
(% OF MARKET CAP – AVERAGE JUN TO DEC 2015)
TRADING ACTIVITY
(% OF BUY/SELL TRADED VALUE)
Source: Analysis of Monthly Stock Market Ownership and Trading Activity Reports published by Saudi Stock Exchange (Jun – Dec 2015)
TOTAL BUYS
SAR 729.7 BN
TOTAL SELLS
SAR 729.7 BN
60.4%
13.9%
7.2%
27.7%
37.3%
38.2%
4.5%
44.0%
49.3%
2.5%
1.9% 1.9%
4.8% 2.8% 3.5%
0%
10%
20%
30%
40%
50%
60%
70%
80%
90%
100%
Ownership Portion of Buying Activity Portion of Selling Activity
Saudi Institutions Saudi Individuals - Others Saudi Individuals - Retail GCC Investors Foreign - All
Figure 3
CAPITAL MARKET INSIGHTS ADEL S AL-GHAMDI, CFA
3
In contrast Saudi institutions who owned a dominant 60.4% portion of stock market value have only
accounted for 13.9% of buying activity and 7.2% of selling activity over the same period; behavior which
is testament to the relatively longer-term investment horizon of this type of investor.
Like most “mom and pop” investors around the world, the great majority of Saudi retail investors lack the
necessary fundamental expertise to assess equity value and, more crucially, they often overlook, or
underestimate, the significant risks associated with equity investment. Characteristically, this knowledge-
gap has caused a continuous and often exaggerated mispricing of shares, inevitably leading to significant
volatility and extreme swings.
Though Saudi retail investors are treated independently in this analysis, it is important to point out that
they are only a subset of a broader CMA defined investor classification of “Saudi individual investors”; a
classification that includes high-net-worth individual investors, professional individual investors, and
individual investors with accounts managed by financial intermediaries. In theory, such investor types are
expected to exhibit more sophisticated investment behavior when compared to typical retail investors.
They nevertheless owned 27.7% of stock market value, and accounted for 37.3% of buying activity and
38.2% of selling activity over the analysis period.
Overall, Saudi Individual investors (retail and others combined) owned 31.6% of stock market value, and
accounted for 81.4% of buying activity and 87.4% of selling activity over the analysis period; evidence of
the dominance of individual investors in active trading when compared to institutional investors.
The dominance of Saudi individual investors in trading activity is not new, in fact over the last 5 years they
have represented an average 88.7% of aggregate trading activity (total of buying and selling activity) in
the Saudi stock market.
Saudi Stock Market Activity
(by Investor Class)
PROPORTION OF AGGREGATE TRADING ACTIVITY (BY INVESTOR CLASS)
(2011 - 2015)
Source: Analysis of Monthly Stock Market Ownership and Trading Activity Reports published by Saudi Stock Exchange (2011 – 2015)
6.6% 5.1% 7.5% 7.3% 9.0%
88.8% 91.7% 88.1% 88.3% 86.4%
1.4% 0.9% 1.5% 1.6% 1.7%
3.1% 2.3% 2.9% 2.8% 2.8%
0%
10%
20%
30%
40%
50%
60%
70%
80%
90%
100%
2011 2012 2013 2014 2015
Saudi Institutions Saudi Individuals (All) GCC Investors Foreign - All
ShareofAggregateAnnualTradingActivity(%)
Figure 4
CAPITAL MARKET INSIGHTS ADEL S AL-GHAMDI, CFA
4
This phenomenon is also prevalent in China, where 80-90% of stock market trading activity is accounted
for by individual investors and, as such, is accompanied by a significant level of performance volatility.
In contrast, a reverse dynamic is true in the US (and other developed markets) where institutions are
significantly more dominant, representing circa 60% to 70% of trading activity. In such institutional
markets, volatility levels are considerably less extreme, and stock market performance is more
predictable.
Comparative Volatility – TASI vs Shanghai Composite vs S&P 500
Jan 2015 - Dec 2016
Source: Analysis of Bloomberg Data (Jan 2015 – Dec 2016)
5.0%
10.0%
15.0%
20.0%
25.0%
30.0%
35.0%
Jan 15 Feb 15 Mar 15 Apr 15 May 15 Jun 15 Jul 15 Aug 15 Sep 15 Oct 15 Nov 15 Dec 15 Jan 16
TASI S&P 500 Shanghai Composite
Annualized90DayVolatility(%)
SHANGHAI COMPOSITE
INDEX
TADAWUL ALL SHARE
INDEX
S&P 500 INDEX
TASI has been
twice as volatile
as the S&P
throughout
2015
Devaluation of
Yuan by Central
Bank of China
Chinese stock
market crash
begins
TASI more volatile than the Shanghai
Composite Index in H1 2015
Figure 5
Looking at recent volatility levels of the Tadawul All Share Index, versus the Shanghai Composite Index,
and the S&P 500, a clear picture emerges of how individual investor dominance translates into volatility.
For the first half of 2015, the Tadawul All Share Index was marginally more volatile than the Shanghai
Composite Index at around 20% annualized quarterly variability. In the second half of the year, triggered
by the impact of the stock market crash in China (in June) and the devaluation of the Yuan (in August), the
volatility of the Shanghai Composite jumped 10% to spike above 30% per annum, whilst the Tadawul All
Share jumped an additional 5% to reach 25% annualized variability.
Throughout this analysis period the retail dominated Tadawul All Share Index was nearly twice as volatile
as the institutionally dominated S&P 500.
Can foreign investors enhance the level of institutional trading and
ownership?
Yes, they can. The Kingdom recently began to encourage further participation from long-term investors
by granting direct stock market access to qualifying foreign investors. Progress has been positive in terms
of the quality of investors the Saudi stock market has attracted so far, with aggregate assets-under-
management amongst qualifying firms exceeding USD 5.6trn, but actual participation has been slow.
CAPITAL MARKET INSIGHTS ADEL S AL-GHAMDI, CFA
5
Qualified Foreign Investors – Total Assets Under Management
31st Oct 2015
A NUMBER OF FOREIGN INSTITUTIONAL INVESTORS HAVE REGISTERED AS QFIS SINCE THE
INTRODUCTION OF THE FRAMEWORK, INCLUDING THE LARGEST ASSET MANAGER IN THE WORLD …
Source: Analysis of Public Announcements and Data
Total AUM
USD 5,111bn
Total AUM
USD 480bn
Total AUM
USD 55bn
Total AUM
USD 6bn
TOTAL ASSETS UNDER MANAGEMENT OF REGISTERED QFIS > USD 5.65 Trillion
Figure 6
QFIs have so far accumulated SAR 792m in net stock market positions in the period of June to December
2015 (ignoring mandatory conversions of Swap holdings into underlying shares), with the total value of
QFI equity holdings accounting for an insignificant level of ownership, representing 0.09% of market value
as at the end of 2015 (including Swap conversions). Nearly 73% (or SAR 579.3m) of QFI net buying activity
occurred in December 2015, just after the conclusion of the QFI International Roadshow.
QFI Net Monthly Trading Activity
1st Jun 2015 - 31st Dec 2015
NET TRADING ACTIVITY OF QFIS SINCE INCEPTION OF THE FRAMEWORK
(AT TRANSACTION COST SAR M)
NetMonthlyTradingActivity(SARm)
18 (21) (3) 41
85 93
579
792
(100)
-
100
200
300
400
500
600
700
800
900
June July August September October November December Total
Figure 7
December witnessed the
highest inflow of QFI monies
into the Saudi stock market
since the framework was
introduced in mid-June 2015
PRE - QFI INTERNATIONAL ROADSHOW POST - ROADSHOW
Source: Analysis of Monthly Stock Market Ownership and Trading Activity Reports published by Saudi Stock Exchange (Jun – Dec 2015)
CAPITAL MARKET INSIGHTS ADEL S AL-GHAMDI, CFA
6
Notwithstanding the more than 5-fold increase in inflows in December, the reasons for the still
underwhelming rate of QFI participation, despite the meek macroeconomic outlook and the bearish
geopolitical climate, have revolved primarily around structural and rule based issues.
On the structural side, one issue is prevalent and will continue to have cascading procedural and
compliance risks and consequences on foreign investors, namely the issue of the T+0 settlement cycle,
which is currently misaligned with both international norms and convergence trends. In fact, Saudi Arabia
is among only 3 other countries that operate exclusively on a T+0 settlement cycle, keeping company with
the likes of Georgia, Armenia, and Kyrgyzstan.
Global Market Benchmarks
Trend of Harmonization in Settlement Cycles
Source: Various
Turkey
Dubai
Abu Dhabi
United States
(T+2 by 2017)
Australia
(T+2 by 2016)
Kazakhstan
(T+2 by 2015)
Japan
(Discussing T+2)
South Africa
(T+3 by 2016)
Georgia Barbados Europe Brazil UgandaEl Salvador
Armenia Azerbaijan Hong Kong Canada SwazilandUruguay
Kyrgyzstan China India Qatar NamibiaSerbia
Saudi Arabia TaiwanUzbekistan
T+5T+3T+2T+1T+0
Investor Option
of Settlement
(T+0 or T+3)
Point of
Convergence
Figure 8
There is little doubt about the efficiency of the T+0 settlement cycle, but it doesn’t come without its own
hazards, nor is it being implemented without introducing other costs, risks and inefficiencies into its
surrounding ecosystem, including slower transaction execution cycles on the trading engine (due to the
need for order pre-validation), and higher levels of credit risk on financial intermediaries (due the absence
of true Delivery-Versus-Payment).
Besides the opportunity costs incurred by investors as a result of the need to prefund transactions, T+0
also has a detrimental risk and compliance impact on the extensive and time sensitive checks and balances
that need to be conducted by global custodians prior to clearing and settling each transaction. This risk is
magnified as a result of the Kingdom’s time zone differences with Greenwich Mean Time and Eastern
Standard Time, leaving a small window of overlap with European trading hours and no overlap with US
trading hours.
The ownership limits prescribed in the QFI Rules also pose a challenge to foreign participation, particularly
the 20% limit which restricts aggregate QFI holdings from exceeding 20% in each listed company. Indeed,
the 20% aggregate QFI limit per issuer poses the greatest stumbling block to achieving Emerging Markets
status.
CAPITAL MARKET INSIGHTS ADEL S AL-GHAMDI, CFA
7
Having attained emerging market status, both the UAE and Qatar allow up to 49% foreign participation,
which is in line with the foreign ownership ceiling prescribed in the High Order (Number 7/B/4590) issued
by the Kingdom’s Deputy Prime Minister back in July 1999. The High Order formed the basis upon which
the CMA established its own foreign investor ownership restrictions, as stipulated in the QFI Rules.
Saudi’s Foreign Ownership Limits in Listed Companies
(2015 QFI Rules vs 1999 High Order)
Source: Capital Market Authority’s Rules for Qualified Foreign Financial Institutions Investment in Listed Shares​ (2015) and High Order 7/B/4590 (6th July 1999)
Applicable On
5% Individual QFI Limit
(per Listed Company)
 QFI plus Affiliate Holdings
20% Aggregate QFI Limit
(per Listed Company)
Aggregate shareholding of:
 All QFIs
 All QFI Clients
49% Aggregate Foreign Limit
(per Listed Company)
Aggregate shareholding of:
 All Non-Saudis Holdings
 Excludes GCC Holdings
 Includes Swap Holdings
10% of Total Stock Market Cap
Aggregate value of:
 All QFI Holdings
 All QFI Client Holdings
 All Swap Holdings
CMA QFI Rules (2015)
 QFI Client plus Affiliate Holdings
High Order (1999) – Interpretation
 “The maximum ownership a foreign
investor (individual or institution) can
have in any Joint Stock Company
(Listed) cannot exceed 5% of its issued
share capital......”.
 No prescription in High Order
 “The maximum ownership Non-Saudi
investors can have in any Joint Stock
Company (Listed) cannot exceed 49%
of its issued share capital......”
 No prescription in High Order
Aligned with
High Order?
Yes
No
Yes
No
Figure 9
Article 21.1 and 21.2
Article 21.4
Article 21.3
Article 21.5
It is no secret that the Kingdom’s general public have not traditionally been inclined to contemplate
outsider influence on, or ownership in, what are commonly, though unrealistically, considered to be the
people’s national assets. This outdated mindset has lost favor in our modern day global society and must
be overcome in order for the Kingdom’s capital market and economy to flourish.
So while the 5% and 49% ownership limits prescribed in the QFI Rules do in fact serve to honor the foreign
ownership foundations enshrined in the 1999 High Order, the remaining limitations, specifically the 20%
aggregate QFI limit, and the 10% market level limit act as supplementary ownership restrictions imposed
by the regulator to serve transitional purposes.
Indeed, it is highly likely that these limits were included in the QFI Rules to act as levers to be adjusted
over time for the purposes of not only managing Saudi public opinion, but also to allow the regulator
sufficient time to develop its own understanding of foreign investor behavior before taking further steps
to relax these limits.
Having said that, and since the QFI framework was specifically customized to attract well-established,
sizable, longer-term value investors, rather than shorter-term retail investors, significant foreign
institutional ownership in Saudi issuers should not be a concern to the general public, particularly if the
influence of shareholder activism on corporate governance, transparency, and our investor relations
culture is to be realized.
In summation, and as a result of the controls already in place in the form of strict qualification
requirements, and in light of the other ownership restrictions, the 20% aggregate QFI limit should be
CAPITAL MARKET INSIGHTS ADEL S AL-GHAMDI, CFA
8
reconsidered in the next incarnation of the Rules with the view of eliminating it. The 10% market level
limit should suffice as a lever to limit (or expand) foreign investment flows into the Kingdom’s stock
market as realities begin to unfold.
What can be done locally to promote a more institutional market?
Much can be done to accelerate the development of a healthy and broad-based institutional equity
market. Though a number of measures are already underway, others will need to be considered.
One of the most critical of policymaker ambitions, and perhaps one of the most challenging to achieve, is
the conversion of individual/retail investors from active/speculative traders to passive longer-term
investors. This is a multiphase journey that is vitally dependent on instilling confidence among these
investors in mutual funds as a fundamental asset class for the creation of wealth over the medium-to-
longer term.
Individual investors have traditionally shied away from investment funds, preferring direct and active
exposure to the stock market in the pursuit of shorter-term returns. For the great majority of these
investors this short-term strategy has not worked out, and this trend is unlikely to change.
Confidence in mutual funds has also significantly eroded since the stock market crash of 2006. Since then,
total assets under management have declined by 18.4%, accompanied by an unprecedented exodus of
425,455 subscribers out of funds (representing a 64.1% drop). The proportion of total assets under
management invested in local equity has also suffered significant decline, falling from 67.1% in 2006 to
represent only 18.6% as at the end of November, 2015.
Number
of Funds
Total AUM
(SAR bn)
Number of
Subscribers
Local Equity
AUM
(SAR bn)
TASI
Local Equity AUM
to Total AUM
31st
Mar 2006 204 138,041 663,240 92,681 17,060 67.1%
30th
Nov 2015 267 112,638 237,785 20,956 7,240 18.6%
Change (%) 30.9% -18.4% -64.1% -77.4% -57.6%
Source: SAMA 42nd Annual Report, CMA Mutual Funds Monthly Report (November 2015)
Reversing this trend requires a broad-based behavioral transformation which can only be realized
gradually, through a combination of awareness, accessibility, incentives, and restrictions.
In terms of awareness, information about mutual funds will need to be more detailed (but retail friendly),
transparent, standardized, centralized, and easily accessible. Work to optimize the usefulness of mutual
funds information is already underway in a joint effort between the CMA and the Saudi Stock Exchange
as part of the Exchange’s new website enhancement, to be completed in the first half of 2016. More will
also need to be done by the financial industry and the media to enhance the level of research coverage,
analysis, and public commentary about this important asset class.
The process of investing in funds must also be reimagined to make it simple and convenient. Accessibility
through electronic distribution is key to the success of this asset class.
The current distribution model means that investors must open accounts and physically interact with each
fund manager in order to subscribe to (or redeem) units of investment funds. This is both burdensome on
CAPITAL MARKET INSIGHTS ADEL S AL-GHAMDI, CFA
9
the investor and costly on the fund manager. Ultimately, this results in higher subscription fees for
investors, particularly when investing in funds issued by non-bank-affiliated fund managers who lack the
necessary geographic reach, penetration, and economies of scale enjoyed by bank-affiliated issuers with
their extensive Kingdom-wide network of branches. This creates an uneven playing field for financial
intermediaries in this important, but yet nascent, segment of the capital market.
As at the end of November 2015, the entire mutual funds segment of the Saudi capital market represented
a meagre 7.8% of the size of the stock market, with total assets under management of SAR 122.6bn and
237,785 subscribers; paling in comparison to the 4.8m stock market investor accounts.
The lion’s share, or 56.8%, of total assets under management have been focused on Shari’a compliant
money market instruments, carving out a 16.5% market share of the total number of mutual fund
subscribers. In contrast, local Saudi equity funds make up 18.6% of total assets under management, with
a more dominant 69.3% share of total subscribers.
Saudi Money
Market - Shari'a
56.8%
Saudi Money
Market -
Conventional
5.4%
Equity - Saudi
18.6%
Equity - GCC
2.7%
Equity - Others
9.0%
Real Estate
3.9%
Other Funds
3.6%
Registered Mutual Funds
30th Nov 2015
Source: CMA Mutual Funds Monthly Report (November 2015)
Saudi Money
Market -
Shari'a
16.5%
Saudi Money
Market -
Conventional
1.7%
Equity - Saudi
69.3%
Equity - GCC
5.2%
Equity - Others
2.4%
Real Estate
2.3%
Other Funds
2.6%
Total Assets Under Management = SAR 112.6bn Total Number of Subscribers = 237,785
AUM BY FUND CLASSIFICATION NUMBER OF SUBSCRIBERS BY FUND CLASSIFICATION
Figure 10
This is an interesting dynamic which likely suggests that money market funds have been more popular
with institutional investors (smaller number of evidently big ticket subscribers), whereas Saudi equity
funds have been more popular with individual/retail investors (larger number of seemingly small ticket
subscribers).
To enhance accessibility, reach, and absorption, investors must be granted the ability to digitally subscribe
to (or redeem) units in approved mutual funds through a specialized distribution platform linked to the
Central Securities Depository. This means that, like stocks, transactions in investment funds can be
cleared, settled, and registered between counterparties in a manner that retail investors have already
been made accustomed to.
CAPITAL MARKET INSIGHTS ADEL S AL-GHAMDI, CFA
10
This would serve to increase the visibility of this asset class, reduce distribution costs on fund managers,
and ultimately reduce the expenses they pass on to their subscribers. Such a distribution platform is
already being contemplated by the Exchange due to its natural position at the heart of the capital market.
Improving mutual funds distribution and information accessibility will go a long way to enhance the image
of this underdeveloped market, however other incentives and restrictions will need to be enacted to
accelerate broader retail migration into this asset class. It starts with policy changes to primary market
participation.
Since 2004, the Saudi public have been weaned on a total of 102 IPOs, 59 of which were offered exclusively
to individuals as Greenfield IPOs or privatizations, with 54 being priced at par value. As a result, the Saudi
public have become accustomed to having direct exposure to equity holdings, despite the significant risks
inherent in such investments. It is therefore not unusual that they have developed an unreasonable
imperviousness to risk.
A critical dynamic that has led to the fomenting of this risk averse investor psyche is the public’s
perception of the stock market. Indeed, the primary market, in particular, is widely seen as the
Government’s instrument for distributing wealth to its people. Although this may have been true for some
non-Greenfield issuances/privatizations, it certainly has not been true for the great majority of the 34
insurance company IPOs that have been offered since 2007.
Indeed, 12 of these companies remain loss making, five of which are in financial distress, and the majority
have suffered various levels of capital erosion and are seeking to shore up their capital from the public
through rights issues.
In fact, of the 34 insurance companies that have undergone IPOs, 16 have already conducted rights issues,
increasing their capital by a multiple of 2.2 times (on average), with 11 of these rights issues occurring in
2015 and more to come in 2016.
Despite the poor fundamentals, this tiny sector of the market is the third most actively traded, after the
banking and petrochemical sectors, and is characterized by an irrational and highly excessive trading
velocity:
Full Year 2015 31 Dec 2015
Sector Size
(% of Market Cap)
Sector Trading Activity
(% of Total Value Traded)
Trading Velocity
(Value Traded/ Market Cap)
P/E
(LTM Trailing)
1 Banking Sector 27.5% 17.8% 68.1% 10.0x
2 Petrochemical Sector 21.7% 16.3% 78.9% 13.3x
3 Insurance Sector 2.6% 12.7% 521.1% 38.4x
All Other Sectors 48.2% 53.2% 116.0% 24.6x
Total (%) 100.0% 100.0% 105.2% 15.6x
Source: Saudi Stock Exchange Annual Report (2015), Corrections to P/E calculations
CAPITAL MARKET INSIGHTS ADEL S AL-GHAMDI, CFA
11
As well as exclusive participation in Greenfield IPOs/Privatizations, the Saudi public have also been
afforded guaranteed allocation in 43 non-Greenfield IPOs.
As it stands today, such IPOs are allocated on the basis of a 60/40 split in favor of institutional investors
(mainly mutual funds) at the expense of individuals. This ratio is anticipated to be removed by 2019/2020,
allowing for 100% allocation to institutional investors, with the 90/10 institutional split in favor of mutual
funds likely to remain as it is today.
ANTICIPATED BY 2019/2020
ALL INSTITUTIONAL ALLOCATION
(POSSIBLY MAINTAINING 90/10 TOWARDS FUNDS)
Pro-Rata
Allocation
CURRENT
40/60 SPLIT BETWEEN INDIVIDUALS AND
INSTITUTIONS (90/10 TOWARDS FUNDS)
Trend of Institutionalizing IPO Allocation
CMA’s Strategic Direction
Source: Historic Practice and CMA Strategic Plan and public comments
Evolution of IPO Allocation Framework
40%
100%
90%
10%
20%
30%
50%
60%
70%
80%
Pro-Rata
Allocation
Pro-Rata
Allocation
No
Preferential
Allocation
to Funds
PRE – JULY 2013
50/50 SPLIT BETWEEN INDIVIDUALS
AND INSTITUTIONS
JULY 2013 TO SEPTEMBER 2014
50/50 SPLIT BETWEEN INDIVIDUALS AND
INSTITUTIONS (70/30 TOWARDS FUNDS)
30%
70%
10%
90%
90%
10%
Legend: All Institutions All Individuals Mutual Funds All Other Institutions
IPO SIZE PRE- JULY 2013 PERMITTED INSTITUTIONAL INVESTORS POST – JULY 2013 PERMITTED INSTITUTIONAL INVESTORS
< SAR500m Funds Only Funds + Authorized Persons + Listed Investment and Insurance Cos
SAR500m to 1bn Funds + Authorized Persons Funds + Authorized Persons + Listed Investment and Insurance Cos
> SAR1bn Funds + Authorized Persons + Listed Investment Cos + Quasi Government Funds + Authorized Persons + Listed Investment and Insurance Cos + Quasi Government
Institutions
Institutions
Institutions
Figure 11
IndividualsInstitutions
Institutions
Mutual
Funds
Mutual
Funds
MutualFunds
Although this trend is conducive to fostering a more institutional primary, and by default, secondary
market, it is nevertheless equally important to manage public opinion by recompensing individual
investors for their diminishing IPO allocation rights.
To achieve this, the CMA should consider guaranteeing preferential allocation to IPO Funds from the ever
swelling institutional tranche. Such funds can be positioned to act as specialized indirect investment
vehicles for individual investor participation in IPOs.
In return for this preferential allocation, the overall fees charged by IPO Funds must be made more
competitive and advantageous to individual investors, allowing them to enter and exit at relatively low
cost.
As it stands today, there are 24 IPO funds, with assets under management standing at SAR 4.8bn,
representing nearly 23.1% of the total fund assets invested in Saudi equity, but with an incomprehensible
total of only 3,755 subscribers.
CAPITAL MARKET INSIGHTS ADEL S AL-GHAMDI, CFA
12
Registered IPO Funds
30th Nov 2015
Source: Terms and Conditions, CMA Website, Saudi Stock Exchange Data
Assets Under
Management
Subscription Fee
(per annum)
Management Fee
(per annum)
Redemption Fee
Custodian Fee
(per annum)
Shari'a Fee
(per annum)
Other Fees
(Max per annum)
Miscellaneous Fees
(per annum)
Saudi Fransi GCC IPO Fund SAR 1,044.76m 3.00% 1.75% None 0.25% None SAR 94,375 0.15%
Osool & Bakheet IPO Fund SAR 477.62m None 2.00% None 0.50% None SAR 157,500 None
Alinma IPO Fund SAR 472.24m 1.50% 1.00% 0-30 Days 1.50% 0.15% None SAR 59,000 0.10%
Falcom IPO Fund SAR 333.12m 1.50% 1.75% 0-6 Months 0.50-1.00% None 0.25% SAR 31,500 None
Derayah IPO Fund SAR 282.71m 2.00% 2.00% None 0.10% SAR 26,250 SAR 100,000 0.25%
Audi IPO Fund SAR 281.60m 2.00% 2.00% None 0.20% SAR 30,000 SAR 190,625 None
Ashmore IPO Fund SAR 251.56m 2.00% 1.75% 0-30 Days 5.00% 0.09% SAR 55,312 SAR 208,750 Registry Fees
Baitk IPO Fund SAR 209.13m 2.00% 1.75% None 0.20% SAR 20,000 SAR 155,064 None
Muscat Capital IPO Fund SAR 203.00m 1.50% 1.75% 0-30 Days 1.00% 0.20% SAR 60,000 SAR 504,119 None
Mulkia IPO Fund SAR 163.95m 1.50% 1.50% None 0.25% SAR 33,000 SAR 130,625 None
Wasata IPO Fund SAR 130.95m 1.50% 1.70% None 0.40% None SAR 114,875 None
Arbah IPO Fund SAR 117.22m 2.00% 1.75% None 0.25% None SAR 156,450 None
KSB IPO Fund SAR 112.92m 1.75% 2.00% 0.50% None SAR 90,000 SAR 77,500 None
BMK IPO Fund SAR 108.54m 3.00% 1.75% 1.50% 0.25% None SAR 596,708 0.50%
Al Ahli IPO Fund SAR 102.20m 2.00% 1.75% None Bundled Bundled SAR 1,022,000 None
SHC IPO Fund SAR 101.53m 1.50% 1.00% 0-30 Days 0.50% 0.20% 30,000 SAR 78,000 None
MEFIC IPO Fund SAR 93.67m 1.50% 1.75% 0-30 Days 2.00% Bundled Bundled SAR 468,350 None
SAIB Saudi IPO Fund SAR 78.07m 2.00% 2.00% 0-30 Days 2.00% Bundled Bundled SAR 468,399 None
BLOM IPO Fund SAR 68.62m 1.50% 1.50% None 0.11% SAR 30,000 SAR 113,750 None
Al Rajhi IPO Fund SAR 66.48m 2.00% 1.50% None Bundled Bundled SAR 166,198 None
Musharaka IPO Fund SAR 53.34m 1.50% 1.75% None 0.25% Bundled SAR 266,692 None
Al Khair Capital IPO Fund SAR 30.23m 0.75% 1.25% 0-30 Days 0.25% Bundled Bundled SAR 151,174 None
Nomw IPO Fund SAR 29.33m 1.50% 1.50% None 0.25% SAR 20,625 SAR 97,625 None
Al-Nefaie IPO Fund SAR 19.70m 1.50% 1.75% 0-30 Days 0.50% 0.50% SAR 10,000 SAR 56,750 None
SAR 4,832.49m
Figure 12
Looking at the current state of affairs, more needs to be done to regulate, and perhaps standardize, the
disparate and often gratuitous fees being charged by IPO Funds, particularly if they are to be granted
preferential allocation. Indeed, there are a number of quantifiable fixed fees that are often being bundled
and charged by fund managers as an annual fixed proportion of assets under management. This erodes
investor trust and lacks the required level of transparency.
Asset managers should also be looking to enhance the investor-friendliness of IPO funds, potentially by
listing IPO ETFs. Such ETFs would also present a great opportunity to attract a large universe of non-Saudi
investors looking to gain exposure to Saudi IPOs. Indeed, it is often forgotten that there are no foreign
investor ownership limits prescribed on ETFs, as a result, such an offering would be readily accessible by
both individual and institutional investors from around the world, without the need to be registered as a
Qualified Foreign Investor.
One of the key objectives of the Capital Market Authority and the Saudi Stock Exchange, as laid out in
their 5-year strategic plans, is to foster a more conducive savings and investment culture within the
Kingdom, in line with the objectives of the national agenda, and in collaboration with other policymakers.
To achieve this, the above mentioned measures cannot be implemented successfully without a significant
dose of broad based investor awareness and education.
To be effective, investor awareness must reach the general public’s living rooms conveniently, seamlessly,
and continuously. This is best achieved via short retail-friendly, potentially animated, awareness
infomercials broadcast on popular financial TV news stations throughout the trading day, and on popular
family channels during primetime. Ultimately there are limited other effective means of conveniently
reaching them.
CAPITAL MARKET INSIGHTS ADEL S AL-GHAMDI, CFA
13
What about the role of GCC institutions in broadening ownership and
shareholder diversification?
A key resolution passed during the 23rd
GCC Summit held in Qatar, in December 2002, required that GCC
citizens be afforded equal economic opportunity, within the 6 member nations, before the end of 2007.
To honor this commitment, the Saudi Council of Ministers passed resolution number 267 in August 2007,
giving the CMA clearance to grant GCC persons equal rights to own and trade Saudi shares.
On the 24th
September 2007, the CMA passed its own resolution granting GCC persons full rights to invest
in listed shares. However, the resolution did not explicitly mention their rights in relation to participation
in initial public offerings (i.e. shares yet to be listed). Perhaps such a provision would have been
superfluous bearing in mind that Companies Law, the jurisdiction of the Ministry of Commerce, already
afforded GCC citizens the right to own shares in unlisted closed joint stock entities.
Consequently, whilst the 2002 GCC resolution has seen broad implementation, particularly in the
secondary market, its spirit has yet to be realized in the primary market, despite the absence of legal or
regulatory obstacles to prevent it. It is therefore likely that the only reason why GCC citizens have not yet
been allowed to participate is due to the absence of affirmative subscription provisions in post-2007
offering prospectuses. Suffice to say that it is at the discretion of the issuer and its advisors to amend
these subscription provisions, within legal and regulatory boundaries, and for the CMA to reject or
approve them based and legal and regulatory foundations.
Given that Saudi citizens already enjoy the right to participate in GCC IPOs, reciprocating, by at least
allowing GCC domiciled fund managers to participate in IPOs, can only cultivate trust and advance
goodwill between the Kingdom and its neighbors who have exhibited positive trading behavior in the
Saudi stock market since 2008.
Cumulative Net Traded Value (GCC Investors)
1st Jan 2008 - 31st Dec 2015
SAR Million
CumulativeNetTradedValue(SARm)
Source: Analysis of Monthly Stock Market Ownership and Trading Activity Reports published by Saudi Stock Exchange (Jan 2008 – Dec 2015)
Figure 13
SAR (2) bn
-
SAR 2 bn
SAR 4 bn
SAR 6 bn
SAR 8 bn
SAR 10 bn
SAR 12 bn
Jan-08
Mar-08
May-08
Jul-08
Sep-08
Nov-08
Jan-09
Mar-09
May-09
Jul-09
Sep-09
Nov-09
Jan-10
Mar-10
May-10
Jul-10
Sep-10
Nov-10
Jan-11
Mar-11
May-11
Jul-11
Sep-11
Nov-11
Jan-12
Mar-12
May-12
Jul-12
Sep-12
Nov-12
Jan-13
Mar-13
May-13
Jul-13
Sep-13
Nov-13
Jan-14
Mar-14
May-14
Jul-14
Sep-14
Nov-14
Jan-15
Mar-15
May-15
Jul-15
Sep-15
Nov-15
CAPITAL MARKET INSIGHTS ADEL S AL-GHAMDI, CFA
14
The fact remains that an important institutional segment is being overlooked in the primary market.
Permitting access to such investors into IPOs will not only help reduce trading volatility in the secondary
market, it will also serve to enhance regional interest in the Kingdom’s stock market, and accelerate
institutional ownership diversification.
Summation - Kingdom in Transition
The shifting in the Kingdom’s economic and geopolitical tectonic plates is causing potent local and global
volatility. Although recent economic reforms, including the tightening of fuel, feedstock and water
subsidies, have been long-awaited and welcomed from a sustainability standpoint, the impact on Saudi
companies has been profound and should be expected to continue to foment a high level of uncertainty.
With little signaling, or notice from officials, companies, having just completed their annual budgeting
exercise, found themselves clambering back into their boardrooms to calculate the impact of Government
policy shifts on their financial performance. Whilst the immediate effect of these reforms might be
quantifiable at this stage, the magnitude and speed of similar future events, including the possible
introduction of VAT, have yet to be detailed by policymakers or appropriately discounted by the market.
With OPEC’s production strategy having already ousted higher cost oil producers in the US, with West
Texas Intermediate (WTI) crude registering 13 year lows of USD 26.6 per barrel, and with the Iranian
break-even point now apparently in sight, has it now become a policy question of Vegas or Bust?
As questions about the sustainability of the riyal-dollar currency peg begin to take center stage, will it
become too expensive for policymakers to continue to defend the exchange rate amid a rising dollar,
falling commodity prices, declining foreign exchange reserves, and the prospects of a slower economy?
With stock market valuation multiples falling from 15.6x, at the end of 2015, to 12.4x today, and in light
of expectations of slower corporate earnings growth, is red likely to become the new black?
Given these unanswered questions, one thing remains certain - this is not a market for retail investors.
The Tadawul All Share Index has already plummeted by 20% in the first 20 days of the year, erasing SAR
338bn (USD 90bn) in market value, as investors try to find some semblance of equilibrium, but with the
prevailing geopolitical dynamics, the bearish economic outlook, and the dominance of bewildered retail
investors in the stock market, uncertainty and volatility are likely to continue to cast a dark shadow.
For policymakers, the need for a broader and more diversified institutional investor base should no longer
be a simple ambition but a near term necessity.

More Related Content

What's hot

capital-market
capital-marketcapital-market
capital-marketPranjal Varma
 
Daily Equity Report 04 Sep 2019
Daily Equity Report 04 Sep 2019Daily Equity Report 04 Sep 2019
Daily Equity Report 04 Sep 2019Myra Cheng
 
SpringOwl Yahoo! Investor Presentation
SpringOwl Yahoo! Investor PresentationSpringOwl Yahoo! Investor Presentation
SpringOwl Yahoo! Investor PresentationRazin Mustafiz
 
Griffon quarterly report - capital markets update September 2017
Griffon quarterly report - capital markets update September 2017Griffon quarterly report - capital markets update September 2017
Griffon quarterly report - capital markets update September 2017Griffon Capital
 
Morning Tea 8/9/2015
Morning Tea 8/9/2015Morning Tea 8/9/2015
Morning Tea 8/9/2015choice broking
 
IMPACT OF DEMONETIZATION ON STOCK MARKET
IMPACT OF DEMONETIZATION ON STOCK MARKETIMPACT OF DEMONETIZATION ON STOCK MARKET
IMPACT OF DEMONETIZATION ON STOCK MARKETRupal Rout
 
Performance Evaluation Of Income Funds In Pakistan
Performance Evaluation Of Income Funds In PakistanPerformance Evaluation Of Income Funds In Pakistan
Performance Evaluation Of Income Funds In PakistanJawad Iqbal
 
DSP Equity & Bond Fund
DSP Equity & Bond FundDSP Equity & Bond Fund
DSP Equity & Bond FundDSP Mutual Fund
 
Axis Nifty Smallcap 50 Index Fund
Axis Nifty Smallcap 50 Index Fund Axis Nifty Smallcap 50 Index Fund
Axis Nifty Smallcap 50 Index Fund yogeshrao45
 
Technical Analysis Of Securities
Technical Analysis Of SecuritiesTechnical Analysis Of Securities
Technical Analysis Of SecuritiesShreyaGaba14
 
Equity reports 20 april
Equity reports 20 aprilEquity reports 20 april
Equity reports 20 aprilMyra Cheng
 
Volatility in indian stock market and foreign institutional investor
Volatility in indian stock market and foreign institutional investorVolatility in indian stock market and foreign institutional investor
Volatility in indian stock market and foreign institutional investorPranjal Chopda
 
The 12-Step Program For Active Investors
The 12-Step Program For Active InvestorsThe 12-Step Program For Active Investors
The 12-Step Program For Active Investorsfaustomics
 
Finance project report on a study on financial derivatives ...
Finance project report on a study on  financial derivatives                  ...Finance project report on a study on  financial derivatives                  ...
Finance project report on a study on financial derivatives ...Mba projects free
 
Microfinance market-outlook-2015-de
Microfinance market-outlook-2015-deMicrofinance market-outlook-2015-de
Microfinance market-outlook-2015-deRobert Loranc
 
The awareness of zakat on investment in malaysia (LZS)
The awareness of zakat on investment in malaysia (LZS)The awareness of zakat on investment in malaysia (LZS)
The awareness of zakat on investment in malaysia (LZS)shedarazi1
 
Axis Nifty Next 50 Index Fund NFO PPT
Axis Nifty Next 50 Index Fund NFO PPTAxis Nifty Next 50 Index Fund NFO PPT
Axis Nifty Next 50 Index Fund NFO PPTyogeshrao45
 

What's hot (19)

capital-market
capital-marketcapital-market
capital-market
 
Investec Senate Group Presentation
Investec Senate Group Presentation Investec Senate Group Presentation
Investec Senate Group Presentation
 
Commodity-Market-Module
Commodity-Market-ModuleCommodity-Market-Module
Commodity-Market-Module
 
Daily Equity Report 04 Sep 2019
Daily Equity Report 04 Sep 2019Daily Equity Report 04 Sep 2019
Daily Equity Report 04 Sep 2019
 
SpringOwl Yahoo! Investor Presentation
SpringOwl Yahoo! Investor PresentationSpringOwl Yahoo! Investor Presentation
SpringOwl Yahoo! Investor Presentation
 
Griffon quarterly report - capital markets update September 2017
Griffon quarterly report - capital markets update September 2017Griffon quarterly report - capital markets update September 2017
Griffon quarterly report - capital markets update September 2017
 
Morning Tea 8/9/2015
Morning Tea 8/9/2015Morning Tea 8/9/2015
Morning Tea 8/9/2015
 
IMPACT OF DEMONETIZATION ON STOCK MARKET
IMPACT OF DEMONETIZATION ON STOCK MARKETIMPACT OF DEMONETIZATION ON STOCK MARKET
IMPACT OF DEMONETIZATION ON STOCK MARKET
 
Performance Evaluation Of Income Funds In Pakistan
Performance Evaluation Of Income Funds In PakistanPerformance Evaluation Of Income Funds In Pakistan
Performance Evaluation Of Income Funds In Pakistan
 
DSP Equity & Bond Fund
DSP Equity & Bond FundDSP Equity & Bond Fund
DSP Equity & Bond Fund
 
Axis Nifty Smallcap 50 Index Fund
Axis Nifty Smallcap 50 Index Fund Axis Nifty Smallcap 50 Index Fund
Axis Nifty Smallcap 50 Index Fund
 
Technical Analysis Of Securities
Technical Analysis Of SecuritiesTechnical Analysis Of Securities
Technical Analysis Of Securities
 
Equity reports 20 april
Equity reports 20 aprilEquity reports 20 april
Equity reports 20 april
 
Volatility in indian stock market and foreign institutional investor
Volatility in indian stock market and foreign institutional investorVolatility in indian stock market and foreign institutional investor
Volatility in indian stock market and foreign institutional investor
 
The 12-Step Program For Active Investors
The 12-Step Program For Active InvestorsThe 12-Step Program For Active Investors
The 12-Step Program For Active Investors
 
Finance project report on a study on financial derivatives ...
Finance project report on a study on  financial derivatives                  ...Finance project report on a study on  financial derivatives                  ...
Finance project report on a study on financial derivatives ...
 
Microfinance market-outlook-2015-de
Microfinance market-outlook-2015-deMicrofinance market-outlook-2015-de
Microfinance market-outlook-2015-de
 
The awareness of zakat on investment in malaysia (LZS)
The awareness of zakat on investment in malaysia (LZS)The awareness of zakat on investment in malaysia (LZS)
The awareness of zakat on investment in malaysia (LZS)
 
Axis Nifty Next 50 Index Fund NFO PPT
Axis Nifty Next 50 Index Fund NFO PPTAxis Nifty Next 50 Index Fund NFO PPT
Axis Nifty Next 50 Index Fund NFO PPT
 

Similar to Retail Domination of Saudi Stock Market Trading Activity Continues to Provoke Volatility

IPO Watch 2016 FINAL (JAN 2016)
IPO Watch 2016 FINAL (JAN 2016)IPO Watch 2016 FINAL (JAN 2016)
IPO Watch 2016 FINAL (JAN 2016)Marcus Ohm
 
Saudi Arabia Capital Markets Guide PDF
Saudi Arabia Capital Markets Guide PDFSaudi Arabia Capital Markets Guide PDF
Saudi Arabia Capital Markets Guide PDFZara Mahmud
 
Stanlib multi manager-shari'ah_balanced_fund_201508__smmsbf_retail
Stanlib multi manager-shari'ah_balanced_fund_201508__smmsbf_retailStanlib multi manager-shari'ah_balanced_fund_201508__smmsbf_retail
Stanlib multi manager-shari'ah_balanced_fund_201508__smmsbf_retailNaweed Hoosenmia
 
IDFC Sterling Value Fund_Fund spotlight
IDFC Sterling Value Fund_Fund spotlightIDFC Sterling Value Fund_Fund spotlight
IDFC Sterling Value Fund_Fund spotlightRahulpathak154
 
IDFC Sterling Value Fund_Fund spotlight
IDFC Sterling Value Fund_Fund spotlightIDFC Sterling Value Fund_Fund spotlight
IDFC Sterling Value Fund_Fund spotlightJubiIDFCEquity
 
The aranca-report-market-liberalization-in-saudi-arabia-opportunities-galore-...
The aranca-report-market-liberalization-in-saudi-arabia-opportunities-galore-...The aranca-report-market-liberalization-in-saudi-arabia-opportunities-galore-...
The aranca-report-market-liberalization-in-saudi-arabia-opportunities-galore-...Aranca
 
The Investment World magazine.
The Investment World magazine.The Investment World magazine.
The Investment World magazine.Amro Zakaria Abdu
 
Avant Garde Wealth Mgmt - Quarterly letter - 1409
Avant Garde Wealth Mgmt - Quarterly letter - 1409Avant Garde Wealth Mgmt - Quarterly letter - 1409
Avant Garde Wealth Mgmt - Quarterly letter - 1409Gaurav Jalan
 
Equity Update - October 2018
Equity Update - October 2018Equity Update - October 2018
Equity Update - October 2018iciciprumf
 
DSP Multi Asset Allocation Fund PPT.pdf
DSP Multi Asset Allocation Fund  PPT.pdfDSP Multi Asset Allocation Fund  PPT.pdf
DSP Multi Asset Allocation Fund PPT.pdfDSP Mutual Fund
 
Tamohara investment newsletter September 2015
Tamohara investment newsletter  September 2015Tamohara investment newsletter  September 2015
Tamohara investment newsletter September 2015tamohara
 
IDFC Dynamic Equity Fund_Fund presentation
IDFC Dynamic Equity Fund_Fund presentationIDFC Dynamic Equity Fund_Fund presentation
IDFC Dynamic Equity Fund_Fund presentationIDFCJUBI
 
GIDec2014lowres
GIDec2014lowresGIDec2014lowres
GIDec2014lowresZara Mahmud
 
Axis Business Cycles Fund- NFO PPT.PDF
Axis Business Cycles Fund- NFO PPT.PDFAxis Business Cycles Fund- NFO PPT.PDF
Axis Business Cycles Fund- NFO PPT.PDFNiharikakaushik5
 
Tr global-islamic-asset-mgmt-report-2014
Tr global-islamic-asset-mgmt-report-2014Tr global-islamic-asset-mgmt-report-2014
Tr global-islamic-asset-mgmt-report-2014Adil MSATFA
 
Equity Update - November 2018
Equity Update - November 2018Equity Update - November 2018
Equity Update - November 2018iciciprumf
 
Sourajit Aiyer - Finance Monthly Magazine, UK - Concentration and Volatility,...
Sourajit Aiyer - Finance Monthly Magazine, UK - Concentration and Volatility,...Sourajit Aiyer - Finance Monthly Magazine, UK - Concentration and Volatility,...
Sourajit Aiyer - Finance Monthly Magazine, UK - Concentration and Volatility,...South Asia Fast Track
 
Wilshire Funds Management Liquid Alternatives Industry Monitor for Q1 2020
Wilshire Funds Management Liquid Alternatives Industry Monitor for Q1 2020Wilshire Funds Management Liquid Alternatives Industry Monitor for Q1 2020
Wilshire Funds Management Liquid Alternatives Industry Monitor for Q1 2020Wilshire
 
MONTHLY MARKET OUTLOOK - JULY 2020
MONTHLY MARKET OUTLOOK - JULY 2020MONTHLY MARKET OUTLOOK - JULY 2020
MONTHLY MARKET OUTLOOK - JULY 2020iciciprumf
 

Similar to Retail Domination of Saudi Stock Market Trading Activity Continues to Provoke Volatility (20)

IPO Watch 2016 FINAL (JAN 2016)
IPO Watch 2016 FINAL (JAN 2016)IPO Watch 2016 FINAL (JAN 2016)
IPO Watch 2016 FINAL (JAN 2016)
 
Saudi Arabia Capital Markets Guide PDF
Saudi Arabia Capital Markets Guide PDFSaudi Arabia Capital Markets Guide PDF
Saudi Arabia Capital Markets Guide PDF
 
Stanlib multi manager-shari'ah_balanced_fund_201508__smmsbf_retail
Stanlib multi manager-shari'ah_balanced_fund_201508__smmsbf_retailStanlib multi manager-shari'ah_balanced_fund_201508__smmsbf_retail
Stanlib multi manager-shari'ah_balanced_fund_201508__smmsbf_retail
 
IDFC Sterling Value Fund_Fund spotlight
IDFC Sterling Value Fund_Fund spotlightIDFC Sterling Value Fund_Fund spotlight
IDFC Sterling Value Fund_Fund spotlight
 
IDFC Sterling Value Fund_Fund spotlight
IDFC Sterling Value Fund_Fund spotlightIDFC Sterling Value Fund_Fund spotlight
IDFC Sterling Value Fund_Fund spotlight
 
The aranca-report-market-liberalization-in-saudi-arabia-opportunities-galore-...
The aranca-report-market-liberalization-in-saudi-arabia-opportunities-galore-...The aranca-report-market-liberalization-in-saudi-arabia-opportunities-galore-...
The aranca-report-market-liberalization-in-saudi-arabia-opportunities-galore-...
 
The Investment World magazine.
The Investment World magazine.The Investment World magazine.
The Investment World magazine.
 
Avant Garde Wealth Mgmt - Quarterly letter - 1409
Avant Garde Wealth Mgmt - Quarterly letter - 1409Avant Garde Wealth Mgmt - Quarterly letter - 1409
Avant Garde Wealth Mgmt - Quarterly letter - 1409
 
Equity Update - October 2018
Equity Update - October 2018Equity Update - October 2018
Equity Update - October 2018
 
DSP Multi Asset Allocation Fund PPT.pdf
DSP Multi Asset Allocation Fund  PPT.pdfDSP Multi Asset Allocation Fund  PPT.pdf
DSP Multi Asset Allocation Fund PPT.pdf
 
Tamohara investment newsletter September 2015
Tamohara investment newsletter  September 2015Tamohara investment newsletter  September 2015
Tamohara investment newsletter September 2015
 
IDFC Dynamic Equity Fund_Fund presentation
IDFC Dynamic Equity Fund_Fund presentationIDFC Dynamic Equity Fund_Fund presentation
IDFC Dynamic Equity Fund_Fund presentation
 
GIDec2014lowres
GIDec2014lowresGIDec2014lowres
GIDec2014lowres
 
Axis Business Cycles Fund- NFO PPT.PDF
Axis Business Cycles Fund- NFO PPT.PDFAxis Business Cycles Fund- NFO PPT.PDF
Axis Business Cycles Fund- NFO PPT.PDF
 
Tr global-islamic-asset-mgmt-report-2014
Tr global-islamic-asset-mgmt-report-2014Tr global-islamic-asset-mgmt-report-2014
Tr global-islamic-asset-mgmt-report-2014
 
Equity Update - November 2018
Equity Update - November 2018Equity Update - November 2018
Equity Update - November 2018
 
Anchor bci equity fund
Anchor bci equity fundAnchor bci equity fund
Anchor bci equity fund
 
Sourajit Aiyer - Finance Monthly Magazine, UK - Concentration and Volatility,...
Sourajit Aiyer - Finance Monthly Magazine, UK - Concentration and Volatility,...Sourajit Aiyer - Finance Monthly Magazine, UK - Concentration and Volatility,...
Sourajit Aiyer - Finance Monthly Magazine, UK - Concentration and Volatility,...
 
Wilshire Funds Management Liquid Alternatives Industry Monitor for Q1 2020
Wilshire Funds Management Liquid Alternatives Industry Monitor for Q1 2020Wilshire Funds Management Liquid Alternatives Industry Monitor for Q1 2020
Wilshire Funds Management Liquid Alternatives Industry Monitor for Q1 2020
 
MONTHLY MARKET OUTLOOK - JULY 2020
MONTHLY MARKET OUTLOOK - JULY 2020MONTHLY MARKET OUTLOOK - JULY 2020
MONTHLY MARKET OUTLOOK - JULY 2020
 

Recently uploaded

Instant Issue Debit Cards - High School Spirit
Instant Issue Debit Cards - High School SpiritInstant Issue Debit Cards - High School Spirit
Instant Issue Debit Cards - High School Spiritegoetzinger
 
Call US đź“ž 9892124323 âś… Kurla Call Girls In Kurla ( Mumbai ) secure service
Call US đź“ž 9892124323 âś… Kurla Call Girls In Kurla ( Mumbai ) secure serviceCall US đź“ž 9892124323 âś… Kurla Call Girls In Kurla ( Mumbai ) secure service
Call US đź“ž 9892124323 âś… Kurla Call Girls In Kurla ( Mumbai ) secure servicePooja Nehwal
 
Vip Call US đź“ž 7738631006 âś…Call Girls In Sakinaka ( Mumbai )
Vip Call US đź“ž 7738631006 âś…Call Girls In Sakinaka ( Mumbai )Vip Call US đź“ž 7738631006 âś…Call Girls In Sakinaka ( Mumbai )
Vip Call US đź“ž 7738631006 âś…Call Girls In Sakinaka ( Mumbai )Pooja Nehwal
 
(DIYA) Bhumkar Chowk Call Girls Just Call 7001035870 [ Cash on Delivery ] Pun...
(DIYA) Bhumkar Chowk Call Girls Just Call 7001035870 [ Cash on Delivery ] Pun...(DIYA) Bhumkar Chowk Call Girls Just Call 7001035870 [ Cash on Delivery ] Pun...
(DIYA) Bhumkar Chowk Call Girls Just Call 7001035870 [ Cash on Delivery ] Pun...ranjana rawat
 
Booking open Available Pune Call Girls Shivane 6297143586 Call Hot Indian Gi...
Booking open Available Pune Call Girls Shivane  6297143586 Call Hot Indian Gi...Booking open Available Pune Call Girls Shivane  6297143586 Call Hot Indian Gi...
Booking open Available Pune Call Girls Shivane 6297143586 Call Hot Indian Gi...Call Girls in Nagpur High Profile
 
05_Annelore Lenoir_Docbyte_MeetupDora&Cybersecurity.pptx
05_Annelore Lenoir_Docbyte_MeetupDora&Cybersecurity.pptx05_Annelore Lenoir_Docbyte_MeetupDora&Cybersecurity.pptx
05_Annelore Lenoir_Docbyte_MeetupDora&Cybersecurity.pptxFinTech Belgium
 
OAT_RI_Ep19 WeighingTheRisks_Apr24_TheYellowMetal.pptx
OAT_RI_Ep19 WeighingTheRisks_Apr24_TheYellowMetal.pptxOAT_RI_Ep19 WeighingTheRisks_Apr24_TheYellowMetal.pptx
OAT_RI_Ep19 WeighingTheRisks_Apr24_TheYellowMetal.pptxhiddenlevers
 
20240429 Calibre April 2024 Investor Presentation.pdf
20240429 Calibre April 2024 Investor Presentation.pdf20240429 Calibre April 2024 Investor Presentation.pdf
20240429 Calibre April 2024 Investor Presentation.pdfAdnet Communications
 
VIP Kolkata Call Girl Jodhpur Park 👉 8250192130 Available With Room
VIP Kolkata Call Girl Jodhpur Park 👉 8250192130  Available With RoomVIP Kolkata Call Girl Jodhpur Park 👉 8250192130  Available With Room
VIP Kolkata Call Girl Jodhpur Park 👉 8250192130 Available With Roomdivyansh0kumar0
 
The Economic History of the U.S. Lecture 21.pdf
The Economic History of the U.S. Lecture 21.pdfThe Economic History of the U.S. Lecture 21.pdf
The Economic History of the U.S. Lecture 21.pdfGale Pooley
 
High Class Call Girls Nagpur Grishma Call 7001035870 Meet With Nagpur Escorts
High Class Call Girls Nagpur Grishma Call 7001035870 Meet With Nagpur EscortsHigh Class Call Girls Nagpur Grishma Call 7001035870 Meet With Nagpur Escorts
High Class Call Girls Nagpur Grishma Call 7001035870 Meet With Nagpur Escortsranjana rawat
 
Independent Call Girl Number in Kurla Mumbai📲 Pooja Nehwal 9892124323 💞 Full ...
Independent Call Girl Number in Kurla Mumbai📲 Pooja Nehwal 9892124323 💞 Full ...Independent Call Girl Number in Kurla Mumbai📲 Pooja Nehwal 9892124323 💞 Full ...
Independent Call Girl Number in Kurla Mumbai📲 Pooja Nehwal 9892124323 💞 Full ...Pooja Nehwal
 
The Economic History of the U.S. Lecture 23.pdf
The Economic History of the U.S. Lecture 23.pdfThe Economic History of the U.S. Lecture 23.pdf
The Economic History of the U.S. Lecture 23.pdfGale Pooley
 
The Economic History of the U.S. Lecture 20.pdf
The Economic History of the U.S. Lecture 20.pdfThe Economic History of the U.S. Lecture 20.pdf
The Economic History of the U.S. Lecture 20.pdfGale Pooley
 
(ANIKA) Budhwar Peth Call Girls Just Call 7001035870 [ Cash on Delivery ] Pun...
(ANIKA) Budhwar Peth Call Girls Just Call 7001035870 [ Cash on Delivery ] Pun...(ANIKA) Budhwar Peth Call Girls Just Call 7001035870 [ Cash on Delivery ] Pun...
(ANIKA) Budhwar Peth Call Girls Just Call 7001035870 [ Cash on Delivery ] Pun...ranjana rawat
 
Instant Issue Debit Cards - School Designs
Instant Issue Debit Cards - School DesignsInstant Issue Debit Cards - School Designs
Instant Issue Debit Cards - School Designsegoetzinger
 
Log your LOA pain with Pension Lab's brilliant campaign
Log your LOA pain with Pension Lab's brilliant campaignLog your LOA pain with Pension Lab's brilliant campaign
Log your LOA pain with Pension Lab's brilliant campaignHenry Tapper
 
CALL ON ➥8923113531 🔝Call Girls Gomti Nagar Lucknow best sexual service
CALL ON ➥8923113531 🔝Call Girls Gomti Nagar Lucknow best sexual serviceCALL ON ➥8923113531 🔝Call Girls Gomti Nagar Lucknow best sexual service
CALL ON ➥8923113531 🔝Call Girls Gomti Nagar Lucknow best sexual serviceanilsa9823
 
The Economic History of the U.S. Lecture 18.pdf
The Economic History of the U.S. Lecture 18.pdfThe Economic History of the U.S. Lecture 18.pdf
The Economic History of the U.S. Lecture 18.pdfGale Pooley
 
VIP Kolkata Call Girl Serampore 👉 8250192130 Available With Room
VIP Kolkata Call Girl Serampore 👉 8250192130  Available With RoomVIP Kolkata Call Girl Serampore 👉 8250192130  Available With Room
VIP Kolkata Call Girl Serampore 👉 8250192130 Available With Roomdivyansh0kumar0
 

Recently uploaded (20)

Instant Issue Debit Cards - High School Spirit
Instant Issue Debit Cards - High School SpiritInstant Issue Debit Cards - High School Spirit
Instant Issue Debit Cards - High School Spirit
 
Call US đź“ž 9892124323 âś… Kurla Call Girls In Kurla ( Mumbai ) secure service
Call US đź“ž 9892124323 âś… Kurla Call Girls In Kurla ( Mumbai ) secure serviceCall US đź“ž 9892124323 âś… Kurla Call Girls In Kurla ( Mumbai ) secure service
Call US đź“ž 9892124323 âś… Kurla Call Girls In Kurla ( Mumbai ) secure service
 
Vip Call US đź“ž 7738631006 âś…Call Girls In Sakinaka ( Mumbai )
Vip Call US đź“ž 7738631006 âś…Call Girls In Sakinaka ( Mumbai )Vip Call US đź“ž 7738631006 âś…Call Girls In Sakinaka ( Mumbai )
Vip Call US đź“ž 7738631006 âś…Call Girls In Sakinaka ( Mumbai )
 
(DIYA) Bhumkar Chowk Call Girls Just Call 7001035870 [ Cash on Delivery ] Pun...
(DIYA) Bhumkar Chowk Call Girls Just Call 7001035870 [ Cash on Delivery ] Pun...(DIYA) Bhumkar Chowk Call Girls Just Call 7001035870 [ Cash on Delivery ] Pun...
(DIYA) Bhumkar Chowk Call Girls Just Call 7001035870 [ Cash on Delivery ] Pun...
 
Booking open Available Pune Call Girls Shivane 6297143586 Call Hot Indian Gi...
Booking open Available Pune Call Girls Shivane  6297143586 Call Hot Indian Gi...Booking open Available Pune Call Girls Shivane  6297143586 Call Hot Indian Gi...
Booking open Available Pune Call Girls Shivane 6297143586 Call Hot Indian Gi...
 
05_Annelore Lenoir_Docbyte_MeetupDora&Cybersecurity.pptx
05_Annelore Lenoir_Docbyte_MeetupDora&Cybersecurity.pptx05_Annelore Lenoir_Docbyte_MeetupDora&Cybersecurity.pptx
05_Annelore Lenoir_Docbyte_MeetupDora&Cybersecurity.pptx
 
OAT_RI_Ep19 WeighingTheRisks_Apr24_TheYellowMetal.pptx
OAT_RI_Ep19 WeighingTheRisks_Apr24_TheYellowMetal.pptxOAT_RI_Ep19 WeighingTheRisks_Apr24_TheYellowMetal.pptx
OAT_RI_Ep19 WeighingTheRisks_Apr24_TheYellowMetal.pptx
 
20240429 Calibre April 2024 Investor Presentation.pdf
20240429 Calibre April 2024 Investor Presentation.pdf20240429 Calibre April 2024 Investor Presentation.pdf
20240429 Calibre April 2024 Investor Presentation.pdf
 
VIP Kolkata Call Girl Jodhpur Park 👉 8250192130 Available With Room
VIP Kolkata Call Girl Jodhpur Park 👉 8250192130  Available With RoomVIP Kolkata Call Girl Jodhpur Park 👉 8250192130  Available With Room
VIP Kolkata Call Girl Jodhpur Park 👉 8250192130 Available With Room
 
The Economic History of the U.S. Lecture 21.pdf
The Economic History of the U.S. Lecture 21.pdfThe Economic History of the U.S. Lecture 21.pdf
The Economic History of the U.S. Lecture 21.pdf
 
High Class Call Girls Nagpur Grishma Call 7001035870 Meet With Nagpur Escorts
High Class Call Girls Nagpur Grishma Call 7001035870 Meet With Nagpur EscortsHigh Class Call Girls Nagpur Grishma Call 7001035870 Meet With Nagpur Escorts
High Class Call Girls Nagpur Grishma Call 7001035870 Meet With Nagpur Escorts
 
Independent Call Girl Number in Kurla Mumbai📲 Pooja Nehwal 9892124323 💞 Full ...
Independent Call Girl Number in Kurla Mumbai📲 Pooja Nehwal 9892124323 💞 Full ...Independent Call Girl Number in Kurla Mumbai📲 Pooja Nehwal 9892124323 💞 Full ...
Independent Call Girl Number in Kurla Mumbai📲 Pooja Nehwal 9892124323 💞 Full ...
 
The Economic History of the U.S. Lecture 23.pdf
The Economic History of the U.S. Lecture 23.pdfThe Economic History of the U.S. Lecture 23.pdf
The Economic History of the U.S. Lecture 23.pdf
 
The Economic History of the U.S. Lecture 20.pdf
The Economic History of the U.S. Lecture 20.pdfThe Economic History of the U.S. Lecture 20.pdf
The Economic History of the U.S. Lecture 20.pdf
 
(ANIKA) Budhwar Peth Call Girls Just Call 7001035870 [ Cash on Delivery ] Pun...
(ANIKA) Budhwar Peth Call Girls Just Call 7001035870 [ Cash on Delivery ] Pun...(ANIKA) Budhwar Peth Call Girls Just Call 7001035870 [ Cash on Delivery ] Pun...
(ANIKA) Budhwar Peth Call Girls Just Call 7001035870 [ Cash on Delivery ] Pun...
 
Instant Issue Debit Cards - School Designs
Instant Issue Debit Cards - School DesignsInstant Issue Debit Cards - School Designs
Instant Issue Debit Cards - School Designs
 
Log your LOA pain with Pension Lab's brilliant campaign
Log your LOA pain with Pension Lab's brilliant campaignLog your LOA pain with Pension Lab's brilliant campaign
Log your LOA pain with Pension Lab's brilliant campaign
 
CALL ON ➥8923113531 🔝Call Girls Gomti Nagar Lucknow best sexual service
CALL ON ➥8923113531 🔝Call Girls Gomti Nagar Lucknow best sexual serviceCALL ON ➥8923113531 🔝Call Girls Gomti Nagar Lucknow best sexual service
CALL ON ➥8923113531 🔝Call Girls Gomti Nagar Lucknow best sexual service
 
The Economic History of the U.S. Lecture 18.pdf
The Economic History of the U.S. Lecture 18.pdfThe Economic History of the U.S. Lecture 18.pdf
The Economic History of the U.S. Lecture 18.pdf
 
VIP Kolkata Call Girl Serampore 👉 8250192130 Available With Room
VIP Kolkata Call Girl Serampore 👉 8250192130  Available With RoomVIP Kolkata Call Girl Serampore 👉 8250192130  Available With Room
VIP Kolkata Call Girl Serampore 👉 8250192130 Available With Room
 

Retail Domination of Saudi Stock Market Trading Activity Continues to Provoke Volatility

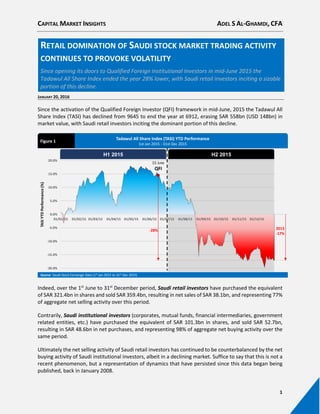
  • 1. CAPITAL MARKET INSIGHTS ADEL S AL-GHAMDI, CFA 1 RETAIL DOMINATION OF SAUDI STOCK MARKET TRADING ACTIVITY CONTINUES TO PROVOKE VOLATILITY Since opening its doors to Qualified Foreign Institutional Investors in mid-June 2015 the Tadawul All Share Index ended the year 28% lower, with Saudi retail investors inciting a sizable portion of this decline. JANUARY 20, 2016 Since the activation of the Qualified Foreign Investor (QFI) framework in mid-June, 2015 the Tadawul All Share Index (TASI) has declined from 9645 to end the year at 6912, erasing SAR 558bn (USD 148bn) in market value, with Saudi retail investors inciting the dominant portion of this decline. Tadawul All Share Index (TASI) YTD Performance 1st Jan 2015 - 31st Dec 2015 TASIYTDPerformance(%) Source: Saudi Stock Exchange Data (1st Jan 2015 to 31st Dec 2015) -20.0% -15.0% -10.0% -5.0% 0.0% 5.0% 10.0% 15.0% 20.0% 01/01/15 01/02/15 01/03/15 01/04/15 01/05/15 01/06/15 01/07/15 01/08/15 01/09/15 01/10/15 01/11/15 01/12/15 H1 2015 H2 2015 15 JUNE QFI Figure 1 -28% 2015 -17% Indeed, over the 1st June to 31st December period, Saudi retail investors have purchased the equivalent of SAR 321.4bn in shares and sold SAR 359.4bn, resulting in net sales of SAR 38.1bn, and representing 77% of aggregate net selling activity over this period. Contrarily, Saudi institutional investors (corporates, mutual funds, financial intermediaries, government related entities, etc.) have purchased the equivalent of SAR 101.3bn in shares, and sold SAR 52.7bn, resulting in SAR 48.6bn in net purchases, and representing 98% of aggregate net buying activity over the same period. Ultimately the net selling activity of Saudi retail investors has continued to be counterbalanced by the net buying activity of Saudi institutional investors, albeit in a declining market. Suffice to say that this is not a recent phenomenon, but a representation of dynamics that have persisted since this data began being published, back in January 2008.
  • 2. CAPITAL MARKET INSIGHTS ADEL S AL-GHAMDI, CFA 2 Net Traded Value (by Investor Class) 1st Jun 2015 - 31st Dec 2015 SAR Million NetTradedValue(SARm) NET BUYERS TOTAL = +SAR49,464 M Source: Analysis of Monthly Stock Market Ownership and Trading Activity Reports published by Saudi Stock Exchange (Jun – Dec 2015) NET SELLERS TOTAL = -SAR49,464 M Represents 98% of Net Buying Activity Represents 77% of Net Selling Activity Figure 2 Even more intriguing is the proportion of buying and selling activity of Saudi retail investors who, despite only owning 4.5% of stock market value, have made up 44.0% of buying activity and 49.3% of selling activity over the analysis period; behavior which is emblematic of a very short-term speculative trading philosophy. Ownership vs Trading Activity (by Investor Class) 1st Jun 2015 - 31st Dec 2015 STOCK MARKET OWNERSHIP (% OF MARKET CAP – AVERAGE JUN TO DEC 2015) TRADING ACTIVITY (% OF BUY/SELL TRADED VALUE) Source: Analysis of Monthly Stock Market Ownership and Trading Activity Reports published by Saudi Stock Exchange (Jun – Dec 2015) TOTAL BUYS SAR 729.7 BN TOTAL SELLS SAR 729.7 BN 60.4% 13.9% 7.2% 27.7% 37.3% 38.2% 4.5% 44.0% 49.3% 2.5% 1.9% 1.9% 4.8% 2.8% 3.5% 0% 10% 20% 30% 40% 50% 60% 70% 80% 90% 100% Ownership Portion of Buying Activity Portion of Selling Activity Saudi Institutions Saudi Individuals - Others Saudi Individuals - Retail GCC Investors Foreign - All Figure 3
  • 3. CAPITAL MARKET INSIGHTS ADEL S AL-GHAMDI, CFA 3 In contrast Saudi institutions who owned a dominant 60.4% portion of stock market value have only accounted for 13.9% of buying activity and 7.2% of selling activity over the same period; behavior which is testament to the relatively longer-term investment horizon of this type of investor. Like most “mom and pop” investors around the world, the great majority of Saudi retail investors lack the necessary fundamental expertise to assess equity value and, more crucially, they often overlook, or underestimate, the significant risks associated with equity investment. Characteristically, this knowledge- gap has caused a continuous and often exaggerated mispricing of shares, inevitably leading to significant volatility and extreme swings. Though Saudi retail investors are treated independently in this analysis, it is important to point out that they are only a subset of a broader CMA defined investor classification of “Saudi individual investors”; a classification that includes high-net-worth individual investors, professional individual investors, and individual investors with accounts managed by financial intermediaries. In theory, such investor types are expected to exhibit more sophisticated investment behavior when compared to typical retail investors. They nevertheless owned 27.7% of stock market value, and accounted for 37.3% of buying activity and 38.2% of selling activity over the analysis period. Overall, Saudi Individual investors (retail and others combined) owned 31.6% of stock market value, and accounted for 81.4% of buying activity and 87.4% of selling activity over the analysis period; evidence of the dominance of individual investors in active trading when compared to institutional investors. The dominance of Saudi individual investors in trading activity is not new, in fact over the last 5 years they have represented an average 88.7% of aggregate trading activity (total of buying and selling activity) in the Saudi stock market. Saudi Stock Market Activity (by Investor Class) PROPORTION OF AGGREGATE TRADING ACTIVITY (BY INVESTOR CLASS) (2011 - 2015) Source: Analysis of Monthly Stock Market Ownership and Trading Activity Reports published by Saudi Stock Exchange (2011 – 2015) 6.6% 5.1% 7.5% 7.3% 9.0% 88.8% 91.7% 88.1% 88.3% 86.4% 1.4% 0.9% 1.5% 1.6% 1.7% 3.1% 2.3% 2.9% 2.8% 2.8% 0% 10% 20% 30% 40% 50% 60% 70% 80% 90% 100% 2011 2012 2013 2014 2015 Saudi Institutions Saudi Individuals (All) GCC Investors Foreign - All ShareofAggregateAnnualTradingActivity(%) Figure 4
  • 4. CAPITAL MARKET INSIGHTS ADEL S AL-GHAMDI, CFA 4 This phenomenon is also prevalent in China, where 80-90% of stock market trading activity is accounted for by individual investors and, as such, is accompanied by a significant level of performance volatility. In contrast, a reverse dynamic is true in the US (and other developed markets) where institutions are significantly more dominant, representing circa 60% to 70% of trading activity. In such institutional markets, volatility levels are considerably less extreme, and stock market performance is more predictable. Comparative Volatility – TASI vs Shanghai Composite vs S&P 500 Jan 2015 - Dec 2016 Source: Analysis of Bloomberg Data (Jan 2015 – Dec 2016) 5.0% 10.0% 15.0% 20.0% 25.0% 30.0% 35.0% Jan 15 Feb 15 Mar 15 Apr 15 May 15 Jun 15 Jul 15 Aug 15 Sep 15 Oct 15 Nov 15 Dec 15 Jan 16 TASI S&P 500 Shanghai Composite Annualized90DayVolatility(%) SHANGHAI COMPOSITE INDEX TADAWUL ALL SHARE INDEX S&P 500 INDEX TASI has been twice as volatile as the S&P throughout 2015 Devaluation of Yuan by Central Bank of China Chinese stock market crash begins TASI more volatile than the Shanghai Composite Index in H1 2015 Figure 5 Looking at recent volatility levels of the Tadawul All Share Index, versus the Shanghai Composite Index, and the S&P 500, a clear picture emerges of how individual investor dominance translates into volatility. For the first half of 2015, the Tadawul All Share Index was marginally more volatile than the Shanghai Composite Index at around 20% annualized quarterly variability. In the second half of the year, triggered by the impact of the stock market crash in China (in June) and the devaluation of the Yuan (in August), the volatility of the Shanghai Composite jumped 10% to spike above 30% per annum, whilst the Tadawul All Share jumped an additional 5% to reach 25% annualized variability. Throughout this analysis period the retail dominated Tadawul All Share Index was nearly twice as volatile as the institutionally dominated S&P 500. Can foreign investors enhance the level of institutional trading and ownership? Yes, they can. The Kingdom recently began to encourage further participation from long-term investors by granting direct stock market access to qualifying foreign investors. Progress has been positive in terms of the quality of investors the Saudi stock market has attracted so far, with aggregate assets-under- management amongst qualifying firms exceeding USD 5.6trn, but actual participation has been slow.
  • 5. CAPITAL MARKET INSIGHTS ADEL S AL-GHAMDI, CFA 5 Qualified Foreign Investors – Total Assets Under Management 31st Oct 2015 A NUMBER OF FOREIGN INSTITUTIONAL INVESTORS HAVE REGISTERED AS QFIS SINCE THE INTRODUCTION OF THE FRAMEWORK, INCLUDING THE LARGEST ASSET MANAGER IN THE WORLD … Source: Analysis of Public Announcements and Data Total AUM USD 5,111bn Total AUM USD 480bn Total AUM USD 55bn Total AUM USD 6bn TOTAL ASSETS UNDER MANAGEMENT OF REGISTERED QFIS > USD 5.65 Trillion Figure 6 QFIs have so far accumulated SAR 792m in net stock market positions in the period of June to December 2015 (ignoring mandatory conversions of Swap holdings into underlying shares), with the total value of QFI equity holdings accounting for an insignificant level of ownership, representing 0.09% of market value as at the end of 2015 (including Swap conversions). Nearly 73% (or SAR 579.3m) of QFI net buying activity occurred in December 2015, just after the conclusion of the QFI International Roadshow. QFI Net Monthly Trading Activity 1st Jun 2015 - 31st Dec 2015 NET TRADING ACTIVITY OF QFIS SINCE INCEPTION OF THE FRAMEWORK (AT TRANSACTION COST SAR M) NetMonthlyTradingActivity(SARm) 18 (21) (3) 41 85 93 579 792 (100) - 100 200 300 400 500 600 700 800 900 June July August September October November December Total Figure 7 December witnessed the highest inflow of QFI monies into the Saudi stock market since the framework was introduced in mid-June 2015 PRE - QFI INTERNATIONAL ROADSHOW POST - ROADSHOW Source: Analysis of Monthly Stock Market Ownership and Trading Activity Reports published by Saudi Stock Exchange (Jun – Dec 2015)
  • 6. CAPITAL MARKET INSIGHTS ADEL S AL-GHAMDI, CFA 6 Notwithstanding the more than 5-fold increase in inflows in December, the reasons for the still underwhelming rate of QFI participation, despite the meek macroeconomic outlook and the bearish geopolitical climate, have revolved primarily around structural and rule based issues. On the structural side, one issue is prevalent and will continue to have cascading procedural and compliance risks and consequences on foreign investors, namely the issue of the T+0 settlement cycle, which is currently misaligned with both international norms and convergence trends. In fact, Saudi Arabia is among only 3 other countries that operate exclusively on a T+0 settlement cycle, keeping company with the likes of Georgia, Armenia, and Kyrgyzstan. Global Market Benchmarks Trend of Harmonization in Settlement Cycles Source: Various Turkey Dubai Abu Dhabi United States (T+2 by 2017) Australia (T+2 by 2016) Kazakhstan (T+2 by 2015) Japan (Discussing T+2) South Africa (T+3 by 2016) Georgia Barbados Europe Brazil UgandaEl Salvador Armenia Azerbaijan Hong Kong Canada SwazilandUruguay Kyrgyzstan China India Qatar NamibiaSerbia Saudi Arabia TaiwanUzbekistan T+5T+3T+2T+1T+0 Investor Option of Settlement (T+0 or T+3) Point of Convergence Figure 8 There is little doubt about the efficiency of the T+0 settlement cycle, but it doesn’t come without its own hazards, nor is it being implemented without introducing other costs, risks and inefficiencies into its surrounding ecosystem, including slower transaction execution cycles on the trading engine (due to the need for order pre-validation), and higher levels of credit risk on financial intermediaries (due the absence of true Delivery-Versus-Payment). Besides the opportunity costs incurred by investors as a result of the need to prefund transactions, T+0 also has a detrimental risk and compliance impact on the extensive and time sensitive checks and balances that need to be conducted by global custodians prior to clearing and settling each transaction. This risk is magnified as a result of the Kingdom’s time zone differences with Greenwich Mean Time and Eastern Standard Time, leaving a small window of overlap with European trading hours and no overlap with US trading hours. The ownership limits prescribed in the QFI Rules also pose a challenge to foreign participation, particularly the 20% limit which restricts aggregate QFI holdings from exceeding 20% in each listed company. Indeed, the 20% aggregate QFI limit per issuer poses the greatest stumbling block to achieving Emerging Markets status.
  • 7. CAPITAL MARKET INSIGHTS ADEL S AL-GHAMDI, CFA 7 Having attained emerging market status, both the UAE and Qatar allow up to 49% foreign participation, which is in line with the foreign ownership ceiling prescribed in the High Order (Number 7/B/4590) issued by the Kingdom’s Deputy Prime Minister back in July 1999. The High Order formed the basis upon which the CMA established its own foreign investor ownership restrictions, as stipulated in the QFI Rules. Saudi’s Foreign Ownership Limits in Listed Companies (2015 QFI Rules vs 1999 High Order) Source: Capital Market Authority’s Rules for Qualified Foreign Financial Institutions Investment in Listed Shares​ (2015) and High Order 7/B/4590 (6th July 1999) Applicable On 5% Individual QFI Limit (per Listed Company)  QFI plus Affiliate Holdings 20% Aggregate QFI Limit (per Listed Company) Aggregate shareholding of:  All QFIs  All QFI Clients 49% Aggregate Foreign Limit (per Listed Company) Aggregate shareholding of:  All Non-Saudis Holdings  Excludes GCC Holdings  Includes Swap Holdings 10% of Total Stock Market Cap Aggregate value of:  All QFI Holdings  All QFI Client Holdings  All Swap Holdings CMA QFI Rules (2015)  QFI Client plus Affiliate Holdings High Order (1999) – Interpretation  “The maximum ownership a foreign investor (individual or institution) can have in any Joint Stock Company (Listed) cannot exceed 5% of its issued share capital......”.  No prescription in High Order  “The maximum ownership Non-Saudi investors can have in any Joint Stock Company (Listed) cannot exceed 49% of its issued share capital......”  No prescription in High Order Aligned with High Order? Yes No Yes No Figure 9 Article 21.1 and 21.2 Article 21.4 Article 21.3 Article 21.5 It is no secret that the Kingdom’s general public have not traditionally been inclined to contemplate outsider influence on, or ownership in, what are commonly, though unrealistically, considered to be the people’s national assets. This outdated mindset has lost favor in our modern day global society and must be overcome in order for the Kingdom’s capital market and economy to flourish. So while the 5% and 49% ownership limits prescribed in the QFI Rules do in fact serve to honor the foreign ownership foundations enshrined in the 1999 High Order, the remaining limitations, specifically the 20% aggregate QFI limit, and the 10% market level limit act as supplementary ownership restrictions imposed by the regulator to serve transitional purposes. Indeed, it is highly likely that these limits were included in the QFI Rules to act as levers to be adjusted over time for the purposes of not only managing Saudi public opinion, but also to allow the regulator sufficient time to develop its own understanding of foreign investor behavior before taking further steps to relax these limits. Having said that, and since the QFI framework was specifically customized to attract well-established, sizable, longer-term value investors, rather than shorter-term retail investors, significant foreign institutional ownership in Saudi issuers should not be a concern to the general public, particularly if the influence of shareholder activism on corporate governance, transparency, and our investor relations culture is to be realized. In summation, and as a result of the controls already in place in the form of strict qualification requirements, and in light of the other ownership restrictions, the 20% aggregate QFI limit should be
  • 8. CAPITAL MARKET INSIGHTS ADEL S AL-GHAMDI, CFA 8 reconsidered in the next incarnation of the Rules with the view of eliminating it. The 10% market level limit should suffice as a lever to limit (or expand) foreign investment flows into the Kingdom’s stock market as realities begin to unfold. What can be done locally to promote a more institutional market? Much can be done to accelerate the development of a healthy and broad-based institutional equity market. Though a number of measures are already underway, others will need to be considered. One of the most critical of policymaker ambitions, and perhaps one of the most challenging to achieve, is the conversion of individual/retail investors from active/speculative traders to passive longer-term investors. This is a multiphase journey that is vitally dependent on instilling confidence among these investors in mutual funds as a fundamental asset class for the creation of wealth over the medium-to- longer term. Individual investors have traditionally shied away from investment funds, preferring direct and active exposure to the stock market in the pursuit of shorter-term returns. For the great majority of these investors this short-term strategy has not worked out, and this trend is unlikely to change. Confidence in mutual funds has also significantly eroded since the stock market crash of 2006. Since then, total assets under management have declined by 18.4%, accompanied by an unprecedented exodus of 425,455 subscribers out of funds (representing a 64.1% drop). The proportion of total assets under management invested in local equity has also suffered significant decline, falling from 67.1% in 2006 to represent only 18.6% as at the end of November, 2015. Number of Funds Total AUM (SAR bn) Number of Subscribers Local Equity AUM (SAR bn) TASI Local Equity AUM to Total AUM 31st Mar 2006 204 138,041 663,240 92,681 17,060 67.1% 30th Nov 2015 267 112,638 237,785 20,956 7,240 18.6% Change (%) 30.9% -18.4% -64.1% -77.4% -57.6% Source: SAMA 42nd Annual Report, CMA Mutual Funds Monthly Report (November 2015) Reversing this trend requires a broad-based behavioral transformation which can only be realized gradually, through a combination of awareness, accessibility, incentives, and restrictions. In terms of awareness, information about mutual funds will need to be more detailed (but retail friendly), transparent, standardized, centralized, and easily accessible. Work to optimize the usefulness of mutual funds information is already underway in a joint effort between the CMA and the Saudi Stock Exchange as part of the Exchange’s new website enhancement, to be completed in the first half of 2016. More will also need to be done by the financial industry and the media to enhance the level of research coverage, analysis, and public commentary about this important asset class. The process of investing in funds must also be reimagined to make it simple and convenient. Accessibility through electronic distribution is key to the success of this asset class. The current distribution model means that investors must open accounts and physically interact with each fund manager in order to subscribe to (or redeem) units of investment funds. This is both burdensome on
  • 9. CAPITAL MARKET INSIGHTS ADEL S AL-GHAMDI, CFA 9 the investor and costly on the fund manager. Ultimately, this results in higher subscription fees for investors, particularly when investing in funds issued by non-bank-affiliated fund managers who lack the necessary geographic reach, penetration, and economies of scale enjoyed by bank-affiliated issuers with their extensive Kingdom-wide network of branches. This creates an uneven playing field for financial intermediaries in this important, but yet nascent, segment of the capital market. As at the end of November 2015, the entire mutual funds segment of the Saudi capital market represented a meagre 7.8% of the size of the stock market, with total assets under management of SAR 122.6bn and 237,785 subscribers; paling in comparison to the 4.8m stock market investor accounts. The lion’s share, or 56.8%, of total assets under management have been focused on Shari’a compliant money market instruments, carving out a 16.5% market share of the total number of mutual fund subscribers. In contrast, local Saudi equity funds make up 18.6% of total assets under management, with a more dominant 69.3% share of total subscribers. Saudi Money Market - Shari'a 56.8% Saudi Money Market - Conventional 5.4% Equity - Saudi 18.6% Equity - GCC 2.7% Equity - Others 9.0% Real Estate 3.9% Other Funds 3.6% Registered Mutual Funds 30th Nov 2015 Source: CMA Mutual Funds Monthly Report (November 2015) Saudi Money Market - Shari'a 16.5% Saudi Money Market - Conventional 1.7% Equity - Saudi 69.3% Equity - GCC 5.2% Equity - Others 2.4% Real Estate 2.3% Other Funds 2.6% Total Assets Under Management = SAR 112.6bn Total Number of Subscribers = 237,785 AUM BY FUND CLASSIFICATION NUMBER OF SUBSCRIBERS BY FUND CLASSIFICATION Figure 10 This is an interesting dynamic which likely suggests that money market funds have been more popular with institutional investors (smaller number of evidently big ticket subscribers), whereas Saudi equity funds have been more popular with individual/retail investors (larger number of seemingly small ticket subscribers). To enhance accessibility, reach, and absorption, investors must be granted the ability to digitally subscribe to (or redeem) units in approved mutual funds through a specialized distribution platform linked to the Central Securities Depository. This means that, like stocks, transactions in investment funds can be cleared, settled, and registered between counterparties in a manner that retail investors have already been made accustomed to.
  • 10. CAPITAL MARKET INSIGHTS ADEL S AL-GHAMDI, CFA 10 This would serve to increase the visibility of this asset class, reduce distribution costs on fund managers, and ultimately reduce the expenses they pass on to their subscribers. Such a distribution platform is already being contemplated by the Exchange due to its natural position at the heart of the capital market. Improving mutual funds distribution and information accessibility will go a long way to enhance the image of this underdeveloped market, however other incentives and restrictions will need to be enacted to accelerate broader retail migration into this asset class. It starts with policy changes to primary market participation. Since 2004, the Saudi public have been weaned on a total of 102 IPOs, 59 of which were offered exclusively to individuals as Greenfield IPOs or privatizations, with 54 being priced at par value. As a result, the Saudi public have become accustomed to having direct exposure to equity holdings, despite the significant risks inherent in such investments. It is therefore not unusual that they have developed an unreasonable imperviousness to risk. A critical dynamic that has led to the fomenting of this risk averse investor psyche is the public’s perception of the stock market. Indeed, the primary market, in particular, is widely seen as the Government’s instrument for distributing wealth to its people. Although this may have been true for some non-Greenfield issuances/privatizations, it certainly has not been true for the great majority of the 34 insurance company IPOs that have been offered since 2007. Indeed, 12 of these companies remain loss making, five of which are in financial distress, and the majority have suffered various levels of capital erosion and are seeking to shore up their capital from the public through rights issues. In fact, of the 34 insurance companies that have undergone IPOs, 16 have already conducted rights issues, increasing their capital by a multiple of 2.2 times (on average), with 11 of these rights issues occurring in 2015 and more to come in 2016. Despite the poor fundamentals, this tiny sector of the market is the third most actively traded, after the banking and petrochemical sectors, and is characterized by an irrational and highly excessive trading velocity: Full Year 2015 31 Dec 2015 Sector Size (% of Market Cap) Sector Trading Activity (% of Total Value Traded) Trading Velocity (Value Traded/ Market Cap) P/E (LTM Trailing) 1 Banking Sector 27.5% 17.8% 68.1% 10.0x 2 Petrochemical Sector 21.7% 16.3% 78.9% 13.3x 3 Insurance Sector 2.6% 12.7% 521.1% 38.4x All Other Sectors 48.2% 53.2% 116.0% 24.6x Total (%) 100.0% 100.0% 105.2% 15.6x Source: Saudi Stock Exchange Annual Report (2015), Corrections to P/E calculations
  • 11. CAPITAL MARKET INSIGHTS ADEL S AL-GHAMDI, CFA 11 As well as exclusive participation in Greenfield IPOs/Privatizations, the Saudi public have also been afforded guaranteed allocation in 43 non-Greenfield IPOs. As it stands today, such IPOs are allocated on the basis of a 60/40 split in favor of institutional investors (mainly mutual funds) at the expense of individuals. This ratio is anticipated to be removed by 2019/2020, allowing for 100% allocation to institutional investors, with the 90/10 institutional split in favor of mutual funds likely to remain as it is today. ANTICIPATED BY 2019/2020 ALL INSTITUTIONAL ALLOCATION (POSSIBLY MAINTAINING 90/10 TOWARDS FUNDS) Pro-Rata Allocation CURRENT 40/60 SPLIT BETWEEN INDIVIDUALS AND INSTITUTIONS (90/10 TOWARDS FUNDS) Trend of Institutionalizing IPO Allocation CMA’s Strategic Direction Source: Historic Practice and CMA Strategic Plan and public comments Evolution of IPO Allocation Framework 40% 100% 90% 10% 20% 30% 50% 60% 70% 80% Pro-Rata Allocation Pro-Rata Allocation No Preferential Allocation to Funds PRE – JULY 2013 50/50 SPLIT BETWEEN INDIVIDUALS AND INSTITUTIONS JULY 2013 TO SEPTEMBER 2014 50/50 SPLIT BETWEEN INDIVIDUALS AND INSTITUTIONS (70/30 TOWARDS FUNDS) 30% 70% 10% 90% 90% 10% Legend: All Institutions All Individuals Mutual Funds All Other Institutions IPO SIZE PRE- JULY 2013 PERMITTED INSTITUTIONAL INVESTORS POST – JULY 2013 PERMITTED INSTITUTIONAL INVESTORS < SAR500m Funds Only Funds + Authorized Persons + Listed Investment and Insurance Cos SAR500m to 1bn Funds + Authorized Persons Funds + Authorized Persons + Listed Investment and Insurance Cos > SAR1bn Funds + Authorized Persons + Listed Investment Cos + Quasi Government Funds + Authorized Persons + Listed Investment and Insurance Cos + Quasi Government Institutions Institutions Institutions Figure 11 IndividualsInstitutions IndividualsInstitutions IndividualsInstitutions Institutions Mutual Funds Mutual Funds MutualFunds Although this trend is conducive to fostering a more institutional primary, and by default, secondary market, it is nevertheless equally important to manage public opinion by recompensing individual investors for their diminishing IPO allocation rights. To achieve this, the CMA should consider guaranteeing preferential allocation to IPO Funds from the ever swelling institutional tranche. Such funds can be positioned to act as specialized indirect investment vehicles for individual investor participation in IPOs. In return for this preferential allocation, the overall fees charged by IPO Funds must be made more competitive and advantageous to individual investors, allowing them to enter and exit at relatively low cost. As it stands today, there are 24 IPO funds, with assets under management standing at SAR 4.8bn, representing nearly 23.1% of the total fund assets invested in Saudi equity, but with an incomprehensible total of only 3,755 subscribers.
  • 12. CAPITAL MARKET INSIGHTS ADEL S AL-GHAMDI, CFA 12 Registered IPO Funds 30th Nov 2015 Source: Terms and Conditions, CMA Website, Saudi Stock Exchange Data Assets Under Management Subscription Fee (per annum) Management Fee (per annum) Redemption Fee Custodian Fee (per annum) Shari'a Fee (per annum) Other Fees (Max per annum) Miscellaneous Fees (per annum) Saudi Fransi GCC IPO Fund SAR 1,044.76m 3.00% 1.75% None 0.25% None SAR 94,375 0.15% Osool & Bakheet IPO Fund SAR 477.62m None 2.00% None 0.50% None SAR 157,500 None Alinma IPO Fund SAR 472.24m 1.50% 1.00% 0-30 Days 1.50% 0.15% None SAR 59,000 0.10% Falcom IPO Fund SAR 333.12m 1.50% 1.75% 0-6 Months 0.50-1.00% None 0.25% SAR 31,500 None Derayah IPO Fund SAR 282.71m 2.00% 2.00% None 0.10% SAR 26,250 SAR 100,000 0.25% Audi IPO Fund SAR 281.60m 2.00% 2.00% None 0.20% SAR 30,000 SAR 190,625 None Ashmore IPO Fund SAR 251.56m 2.00% 1.75% 0-30 Days 5.00% 0.09% SAR 55,312 SAR 208,750 Registry Fees Baitk IPO Fund SAR 209.13m 2.00% 1.75% None 0.20% SAR 20,000 SAR 155,064 None Muscat Capital IPO Fund SAR 203.00m 1.50% 1.75% 0-30 Days 1.00% 0.20% SAR 60,000 SAR 504,119 None Mulkia IPO Fund SAR 163.95m 1.50% 1.50% None 0.25% SAR 33,000 SAR 130,625 None Wasata IPO Fund SAR 130.95m 1.50% 1.70% None 0.40% None SAR 114,875 None Arbah IPO Fund SAR 117.22m 2.00% 1.75% None 0.25% None SAR 156,450 None KSB IPO Fund SAR 112.92m 1.75% 2.00% 0.50% None SAR 90,000 SAR 77,500 None BMK IPO Fund SAR 108.54m 3.00% 1.75% 1.50% 0.25% None SAR 596,708 0.50% Al Ahli IPO Fund SAR 102.20m 2.00% 1.75% None Bundled Bundled SAR 1,022,000 None SHC IPO Fund SAR 101.53m 1.50% 1.00% 0-30 Days 0.50% 0.20% 30,000 SAR 78,000 None MEFIC IPO Fund SAR 93.67m 1.50% 1.75% 0-30 Days 2.00% Bundled Bundled SAR 468,350 None SAIB Saudi IPO Fund SAR 78.07m 2.00% 2.00% 0-30 Days 2.00% Bundled Bundled SAR 468,399 None BLOM IPO Fund SAR 68.62m 1.50% 1.50% None 0.11% SAR 30,000 SAR 113,750 None Al Rajhi IPO Fund SAR 66.48m 2.00% 1.50% None Bundled Bundled SAR 166,198 None Musharaka IPO Fund SAR 53.34m 1.50% 1.75% None 0.25% Bundled SAR 266,692 None Al Khair Capital IPO Fund SAR 30.23m 0.75% 1.25% 0-30 Days 0.25% Bundled Bundled SAR 151,174 None Nomw IPO Fund SAR 29.33m 1.50% 1.50% None 0.25% SAR 20,625 SAR 97,625 None Al-Nefaie IPO Fund SAR 19.70m 1.50% 1.75% 0-30 Days 0.50% 0.50% SAR 10,000 SAR 56,750 None SAR 4,832.49m Figure 12 Looking at the current state of affairs, more needs to be done to regulate, and perhaps standardize, the disparate and often gratuitous fees being charged by IPO Funds, particularly if they are to be granted preferential allocation. Indeed, there are a number of quantifiable fixed fees that are often being bundled and charged by fund managers as an annual fixed proportion of assets under management. This erodes investor trust and lacks the required level of transparency. Asset managers should also be looking to enhance the investor-friendliness of IPO funds, potentially by listing IPO ETFs. Such ETFs would also present a great opportunity to attract a large universe of non-Saudi investors looking to gain exposure to Saudi IPOs. Indeed, it is often forgotten that there are no foreign investor ownership limits prescribed on ETFs, as a result, such an offering would be readily accessible by both individual and institutional investors from around the world, without the need to be registered as a Qualified Foreign Investor. One of the key objectives of the Capital Market Authority and the Saudi Stock Exchange, as laid out in their 5-year strategic plans, is to foster a more conducive savings and investment culture within the Kingdom, in line with the objectives of the national agenda, and in collaboration with other policymakers. To achieve this, the above mentioned measures cannot be implemented successfully without a significant dose of broad based investor awareness and education. To be effective, investor awareness must reach the general public’s living rooms conveniently, seamlessly, and continuously. This is best achieved via short retail-friendly, potentially animated, awareness infomercials broadcast on popular financial TV news stations throughout the trading day, and on popular family channels during primetime. Ultimately there are limited other effective means of conveniently reaching them.
  • 13. CAPITAL MARKET INSIGHTS ADEL S AL-GHAMDI, CFA 13 What about the role of GCC institutions in broadening ownership and shareholder diversification? A key resolution passed during the 23rd GCC Summit held in Qatar, in December 2002, required that GCC citizens be afforded equal economic opportunity, within the 6 member nations, before the end of 2007. To honor this commitment, the Saudi Council of Ministers passed resolution number 267 in August 2007, giving the CMA clearance to grant GCC persons equal rights to own and trade Saudi shares. On the 24th September 2007, the CMA passed its own resolution granting GCC persons full rights to invest in listed shares. However, the resolution did not explicitly mention their rights in relation to participation in initial public offerings (i.e. shares yet to be listed). Perhaps such a provision would have been superfluous bearing in mind that Companies Law, the jurisdiction of the Ministry of Commerce, already afforded GCC citizens the right to own shares in unlisted closed joint stock entities. Consequently, whilst the 2002 GCC resolution has seen broad implementation, particularly in the secondary market, its spirit has yet to be realized in the primary market, despite the absence of legal or regulatory obstacles to prevent it. It is therefore likely that the only reason why GCC citizens have not yet been allowed to participate is due to the absence of affirmative subscription provisions in post-2007 offering prospectuses. Suffice to say that it is at the discretion of the issuer and its advisors to amend these subscription provisions, within legal and regulatory boundaries, and for the CMA to reject or approve them based and legal and regulatory foundations. Given that Saudi citizens already enjoy the right to participate in GCC IPOs, reciprocating, by at least allowing GCC domiciled fund managers to participate in IPOs, can only cultivate trust and advance goodwill between the Kingdom and its neighbors who have exhibited positive trading behavior in the Saudi stock market since 2008. Cumulative Net Traded Value (GCC Investors) 1st Jan 2008 - 31st Dec 2015 SAR Million CumulativeNetTradedValue(SARm) Source: Analysis of Monthly Stock Market Ownership and Trading Activity Reports published by Saudi Stock Exchange (Jan 2008 – Dec 2015) Figure 13 SAR (2) bn - SAR 2 bn SAR 4 bn SAR 6 bn SAR 8 bn SAR 10 bn SAR 12 bn Jan-08 Mar-08 May-08 Jul-08 Sep-08 Nov-08 Jan-09 Mar-09 May-09 Jul-09 Sep-09 Nov-09 Jan-10 Mar-10 May-10 Jul-10 Sep-10 Nov-10 Jan-11 Mar-11 May-11 Jul-11 Sep-11 Nov-11 Jan-12 Mar-12 May-12 Jul-12 Sep-12 Nov-12 Jan-13 Mar-13 May-13 Jul-13 Sep-13 Nov-13 Jan-14 Mar-14 May-14 Jul-14 Sep-14 Nov-14 Jan-15 Mar-15 May-15 Jul-15 Sep-15 Nov-15
  • 14. CAPITAL MARKET INSIGHTS ADEL S AL-GHAMDI, CFA 14 The fact remains that an important institutional segment is being overlooked in the primary market. Permitting access to such investors into IPOs will not only help reduce trading volatility in the secondary market, it will also serve to enhance regional interest in the Kingdom’s stock market, and accelerate institutional ownership diversification. Summation - Kingdom in Transition The shifting in the Kingdom’s economic and geopolitical tectonic plates is causing potent local and global volatility. Although recent economic reforms, including the tightening of fuel, feedstock and water subsidies, have been long-awaited and welcomed from a sustainability standpoint, the impact on Saudi companies has been profound and should be expected to continue to foment a high level of uncertainty. With little signaling, or notice from officials, companies, having just completed their annual budgeting exercise, found themselves clambering back into their boardrooms to calculate the impact of Government policy shifts on their financial performance. Whilst the immediate effect of these reforms might be quantifiable at this stage, the magnitude and speed of similar future events, including the possible introduction of VAT, have yet to be detailed by policymakers or appropriately discounted by the market. With OPEC’s production strategy having already ousted higher cost oil producers in the US, with West Texas Intermediate (WTI) crude registering 13 year lows of USD 26.6 per barrel, and with the Iranian break-even point now apparently in sight, has it now become a policy question of Vegas or Bust? As questions about the sustainability of the riyal-dollar currency peg begin to take center stage, will it become too expensive for policymakers to continue to defend the exchange rate amid a rising dollar, falling commodity prices, declining foreign exchange reserves, and the prospects of a slower economy? With stock market valuation multiples falling from 15.6x, at the end of 2015, to 12.4x today, and in light of expectations of slower corporate earnings growth, is red likely to become the new black? Given these unanswered questions, one thing remains certain - this is not a market for retail investors. The Tadawul All Share Index has already plummeted by 20% in the first 20 days of the year, erasing SAR 338bn (USD 90bn) in market value, as investors try to find some semblance of equilibrium, but with the prevailing geopolitical dynamics, the bearish economic outlook, and the dominance of bewildered retail investors in the stock market, uncertainty and volatility are likely to continue to cast a dark shadow. For policymakers, the need for a broader and more diversified institutional investor base should no longer be a simple ambition but a near term necessity.