1. Tuesday,
10 Special February 9, 2010 New Delhi
NATIONAL BOOK TRUST-NATIONAL COUNCIL OF APPLIED ECONOMIC RESEARCH
NATIONAL YOUTH READERSHIP SURVEY 2009
Indian Youth: Demographics & Readership
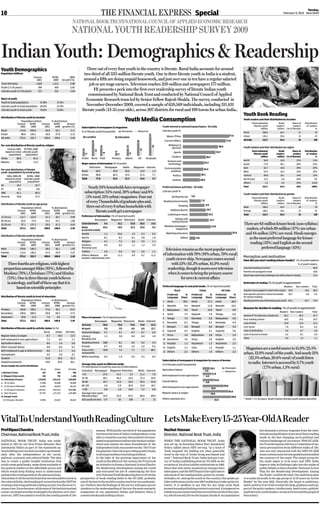
Youth Demographics Three out of every four youth in the country is literate. Rural India accounts for around
Population (Million) two-third of all 333-million literate youth. One in three literate youth in India is a student,
Census NYRS 2009
2001 2009 Growth (%) around a fifth are doing unpaid housework, and just over one in ten have a regular salaried
Total (All India) 1,029 1,213 2.08 job or are wage earners. Television reaches 259-million and newspapers 177-million.
Youth (13-35 years) 390 459 2.05
Literate youth (13-35 years) 273 333 2.49
FE presents s peek into the first-ever readership survey of literate Indian youth
commissioned by National Book Trust and conducted by National Council of Applied
Share of youth
Economic Research team led by Senior Fellow Rajesh Shukla. The survey, conducted in
Youth to total population 37.8% 37.9%
Literate youth to total population 26.6% 27.4% November-December 2009, covered a sample of 659,569 individuals, including 311,431
Literate youth to total youth 70.0% 72.8% literate youth (13-35 year olds), across 207 districts for rural and 199 towns for urban India..
Youth Book Reading
Youth Media Consumption
Distribution of literate youth by location
Youth readers and their distribution by location
Population million % distribution
Census NYRS Census NYRS Annual Total estimated Youth Share of Distribution
2001 2009 2001 2009 growth (%) Youth interest in selected issues/topics - All India literate youth readers readers of readers
Subscription of newspapers & magazines million million (% of literate) %
Rural 174.8 206.6 64.0 62.1 2.11 % of literate youth households Newspaper Magazines Literate youth %
Rural 206.6 44.1 21 53
Urban 98.4 126.1 36.0 37.9 3.15
57
Music /Films 77.5 Urban 126.1 39.4 31 47
All India 273.2 332.7 100.0 100.0 2.49 By Location By Education
Current Affairs 71.8 All India 332.7 83.4 25 100
38
39
Per cent distribution of literate youth by religion Religious &
23
58.9
23
24
spiritual Youth readers and their distribution by region
Census 2001 NTYRS, 2009
13
15
12
based on total Literate youth 54.7 Total estimated Youth Share of Distribution
Sports
9
8
6
literate youth readers readers of readers
5
population population
2
Cookery 38.7 million million (% of literate) %
Hindu 80.5 81.5 Urban Rural Total Primary Matric HS Graduate
Science and North 50.0 10.5 21% 13%
Muslim 13.4 13.2 35.3
Major source of information (% of youth) technology South 77.8 20.1 26% 24%
Television Newspaper Radio Magazine Internet Environmental East 62.7 18.5 30% 22%
Per cent distribution of literate 34.4
Rural 69.9 45.9 20.6 12.0 1.3 pollution West 57.9 18.3 32% 22%
youth (population) by social group
Urban 90.8 65.3 22.5 21.5 7.7 Politics 30.1 Central 69.8 10.1 14% 12%
NSS, 2004-05 NYRS, 2009
based on total Literate youth Total 77.8 53.2 21.3 15.6 3.7 North-East 13.2 5.6 43% 7%
Fashion 28.9
population population
Others 1.3 0.3 25% 0.4%
SC 19.7 22.7
ST 8.5 9.8
Nearly 24% households have newspaper Preferred leisure activities - All India Total 332.7 83.4 25% 100%
OBC 41.1 40.3 subscription (15% rural, 39% urban) and 8% Literate youth %
Youth readers and their distribution by gender
General 30.8 27.3 (5% rural, 12% urban) magazines. Four out Surfing the net 1.0
Total estimated Youth Share of Distribution
of every 7 households of graduate plus and, Reading leisure books 7.5 literate youth
million
readers
million
readers
(% of literate)
of readers
%
Distribution of literate youth by age group 9.9
Population million % distribution three out of every 8 urban households with Sleeping
Male 186.5 44.3 24 53
10.7
Census
2001
NYRS
2009
Census
2001
NYRS Annual
2009 growth (%)
literate youth get a newspaper Hobbies/Sports Female 146.2 39.1 27 47
Listening to music 12.2 Total 332.7 83.4 25 100
13-19 yrs 112.7 122.0 41.3 36.7 0.99 Preference of information (% of reported youth)
Newspaper Magazine Television Radio Internet Outing with 12.7
20-24 yrs 63.4 73.4 23.2 22.1 1.84 family/friends
25-35 yrs 97.1 137.3 35.5 41.3 4.43 Entertainment 9.4 33.2 53.8 56.6 14.5
Reading newspaper /
There are 83-million leisure book (non-syllabus)
14.0
Total 273.2 332.7 100.0 100.0 2.49 News
& current events
63.4 16.9 22.2 22.8 5.6
magazines readers, of which 39-million (47%) are urban
Health 1.1 10.6 1.5 2.3 0.3 Watching television 27.9 and 44-millon (53%) are rural. Hindi emerges
Distribution of literate youth by Gender
Population million % distribution
Sports 8.1 8.3 8.1 5.8 1.6 Others 4.0 as the most preferred language for leisure
Religion 4.1 7.2 4.4 2.5 1.1
Census
2001
NYRS
2009
Census
2001
NYRS Annual
2009 growth (%) Fashion/ 0.6 6.5 1.1 1.3 2.5
reading (33%) and English as the second
Male 159.8 186.5 58.5 56.1 1.95 Personal care
Television remains as the most popular source preferred language (43%)
Female 113.4 146.2 41.5 43.9 3.23 Politics 4.9 6.0 3.0 2.0 1.1
Others (Nature, 8.4 11.3 5.9 6.7 11.2 of information with 78% (91% urban, 70% rural)
Total 273.2 332.7 100.0 100.0 2.49 Perception and motivation
market, matrimonial, etc)
youth viewer-ship. Newspaper comes second How did you start reading leisure books? (% of youth readers)
Three fourths are religious, with highest with 53% (65.3% urban, 45.9% rural) % of youth readers
proportion amongst Sikhs (93%), followed by readership, though it scores over television Learned reading at school 59.0
Parents encouraged to read 18.8
Muslims (78%), Christians (77%) and Hindus when it comes to being the primary source Much later and it has nothing to do with school or family 12.5
(75%). One in three literate youth believes for news & current affairs
in astrology, and half of these say that it is Motivation of reading (% of youth in agreement)
Preferred language to read print media (% of reported youth)
based on scientific principles Readers Non-readers Total
Rural Urban All India Teacher encouraged to read in the school 49.5 19.4 26.9
Preferred % Preferred % Preferred % Had specific period in school timetable 20.7 5.8 9.5
Distribution of literate youth by level of education Language Share Language Share Language Share for leisure reading
Population million % distribution Reading period was interesting and useful 83.3 64.7 74.9
1 Hindi 39.5 Hindi 37.2 Hindi 38.5
Census NYRS Census NYRS Annual
2001 2009 2001 2009 growth (%) 2 Marathi 9.4 Marathi 11.8 Marathi 10.5
Primary 102.8 100.3 37.6 30.1 -0.31
Reasons for decline in reading (% of youth in agreement)
3 Malayalam 9.0 Tamil 10.9 Tamil 8.9
Readers Non-readers Total
Secondary 149.6 200.5 54.8 60.3 3.73 4 Tamil 7.2 Gujarati 7.0 Telugu 6.6
Advent of TV, Internet,e-books etc 53.1 45.2 47.7
Graduate+ 20.8 31.9 7.6 9.6 5.49 Place of exposure (% of reported youth) 5 Telugu 7.0 Kannada 6.6 Malayalam 6.6 Poor reading culture 18.5 19.5 19.2
Total 273.2 332.7 100.0 100.0 2.49 Newspaper Magazine Television Radio Internet
6 Kannada 6.3 Telugu 6.2 Kannada 6.4 Lack of time 10.9 12.9 12.3
At home 50.6 70.0 74.8 74.8 23.4
7 Bengali 5.8 Bengali 6.0 Bengali 5.9 Cost factor 7.9 8.4 8.3
Distribution of literate youth by activity status (in %) At work 5.9 3.9 6.0 6.0 12.7
8 Gujarati 4.5 English 4.1 Gujarati 5.6 Lack of motivation 4.4 4.7 4.6
Rural Urban All India School/Collages 4.7 4.1 0.7 0.7 6.2
9 Oriya 3.6 Malayalam 3.8 Oriya 2.9 Lack of access to books 4.2 8.1 6.9
Regular salary & wages 8.7 18.2 12.3 Library/ 1.3 3.8 0.4 0.4 1.8
Reading club Other 0.9 1.2 1.1
Self-employed in non-agriculture 7.3 8.3 7.7 10 Assamese 3.0 Oriya 2.0 English 2.5
Agriculture labour 8.0 1.6 5.6 Neighbourhood 14.5 8.1 9.2 9.2 4.4 11 Punjabi 1.3 Assamese 1.3 Assamese 2.2
Other (casual) labour 9.8 8.5 9.3 Friends 5.7 4.9 3.2 3.2 5.2
Shop/cafe/ 16.8 3.4 3.2 3.2 46.1
12 English 1.2 Urdu 1.2 Punjabi 1.1 Magazines are a useful source to 15.6% (21.5%
Self-employed in agri & allied activity 8.0 1.1 5.4 13 Others 2.2 Others 1.9 Others 2.2
Unemployed 4.5 4.9 4.7
restaurants urban, 12.0% rural) of the youth. And nearly 21%
While travelling 0.5 1.9 2.4 2.4 0.2
Student 31.8 32.6 32.1 (22.5% urban, 20.6% rural) of youth listen
Subscription of newspapers & magazines by source of income
Unpaid housework 19.8 20.4 20.1
Average time spent on different media % of literate youth households
to radio. Internet is accessed by 3.7% youth
Survey Sample Size and its Distribution
Rural Urban All India
(% distribution of youth by sources of information)
Agriculture labour
10.1 Newspaper (7.7% urban, 1.3% rural)
(minutes) Newspaper Magazine Television Radio Internet 2.9 Magazines
I. Districts/Towns 207 199 406
<15 27.4 14.1 2.3 11.3 7.0 11.8
II. Villages/Urban wards 432 753 1,185 Self employed in non-agriculture 4.3
15-30 49.1 44.3 14.4 37.3 24.5
III. Individuals (Frame) 2,39,436 4,20,133 6,59,569 15.8
30-60 19.7 31.9 32.6 29.2 43.0 Casual labour 4.0
a. 10-12 years 17,006 26,998 44,004
b. 13-35 years (Illiterate) 32,622 26,503 59,125 60-120 3.0 7.9 30.9 15.0 18.7 29.0
Self employed in non-agriculture
>120 0.9 1.8 19.9 7.2 6.8 10.9
c 13-35 years (Literate) 1,02,021 2,09,410 3,11,431
35.6
d Over 35 years 87,787 1,57,222 2,45,009 Average time spent Regular salary & wages 10.6
IV. Sample Youth (Minutes/day) 32.4 43.9 97.6 60.9 69.9 39.6
(13-35 years, literate) 13,994 24,453 38,447 Esti youth (in mn) 177 52 259 71 12 Others (pension etc) 15.5 * Youth = 13-35 years, Youth implies literate youth unless specified
VitalToUnderstandYouthReadingCulture LetsMakeEvery15-25Year-OldAReader
ProfBipanChandra masses. With hardly one third of the population Nuzhat Hassan but demands a serious response from the intel-
Chairman,NationalBookTrust,India literateatthetimeof India’sindependence,tobe Director, National Book Trust, India lectualsandpublishersintermsof theirreading
able to visualize a society that needed to be nour- needs in the fast changing socio-political and
NATIONAL BOOK TRUST, India was estab- ishedonprogressiveandsecularbookstounder- WHEN THE NATIONAL BOOK TRUST, India cultural landscape of our nation. With NCAER,
lished in 1957 by our first Prime Minister Shri stand and sustain the basic foundations of the was set up, its founding father Shri Jawaharlal theTrustformedanAdvisoryCommitteeof em-
Jawaharlal Nehru as part of the mammoth na- independent India was masterstroke. The Trust Nehru talked about NBT serving “as a kind of inent personalities from different walks of life,
tionbuildingexercisethatwastakenupimmedi- hasplayedavitalroleinprovidingqualitybooks ‘book hospital’ for finding out what generally who not only interacted with the NBT-NCAER
ately after the independence in the social, toalltargetaudienceincludingchildren. stood in the way of books being purchased and teamcontinuouslybutalsoguidedandmoulded
political, economic and cultural fields. The idea In the light of the growing importance of the read.” National Book Trust, India had got a sur- the contours of the study The target group for
.
was to create a public funded institution that youthintheaffairsof thecountry ,theTrusttook vey of Indian publishing done by NCAER on the the study taken is 13-35 years and NBT, India
could create good books, make them available to an initiative to frame a National Action Plan for occasion of its silver jubilee celebrations in 1982. hopes to take its findings right into the realm of
the general readers at the affordable prices and the Readership Development among the youth Since that time many momentous changes have public debate so that a feasible ‘National Action
which would keep finding ways to understand and entrusted the job of undertaking the first takenplace,andtheNBTfoundittherighttimeto Plan for the Readership Development Among
andmeetthereadingneedsof the massesatlarge. everNationalYouthReadershipSurveyfromthe takestockof thereadinghabits,patterns,trends, the Youth’ could be devised. Our ambitious plan
Ithinkthatof alltheinstitutionsthatwerefoundedtoworkin perspective of book reading habit to the NCAER, probably attitudes, etc. among the youth of the country Our golden ju-
. is to make all youth in the age group of 15-25 years an ‘ ctive
A
theculturalfields,thefoundingof aninstitutionlikeNBTfor oneof thebestintheworldtoconductsuchsurveysandanaly- bileecelebrationsintheyear2007enabledustotakeuptheini- Reader’ by the year 2025. Naturally the target is ambitious,
,
creating a learning and book reading society was the most vi- ses. I believe that the findings of the survey will open up new tiative. It is needless to say that for any large scale book and to achieve it we wish to enlist the help, guidance and sup-
sionaryone.Itissobecause,whilemostof theinstitutionshad windows to the understanding of the way the most energetic promotionandpublishingventuretosucceed,itisimperative port of the policy makers, intellectuals, book lovers, publish-
aclear-cuttargetarealikeworkingforthetheatres,arts,liter- component of our population thinks and behaves when it tofindwaystoconnectandinteractwiththeyouthof thecoun- ingfraternity ,youthleaders,socialactivistsandthepeopleof
ature etc, NBT was asked to work for the reading needs of the comestobooksandreadingculture. try which not only forms the largest chunk of our population
, thecountry .