1. Emir. J. Food Agric ● Vol 32 ● Issue 7 ● 2020 543
Sensory profiles and hedonic perception of commercial
potato chips under blind and informed consumer tests
Sang-Hyeok Lee, Youngseung Lee*
Department of Food Science and Nutrition, Dankook University
*Corresponding author:
Youngseung Lee, Department of Food Science and Nutrition, Dankook University, Cheonan, Chungnam 3116, Korea. E-mail: youngslee@
dankook.ac.kr, Phone: +82-41-550-3476
Received: 02 May 2020; Accepted: 14 July 2020
INTRODUCTION
Potato (Solanum tuberosum L.) is a staple food crop in the
world. A majority of potato grown worldwide is processed
for consumption as potato products, such as potato chips,
starch, and french fries, and as food ingredients in snacks
or side dishes (Kwak et al., 2015). Potato chips were
introduced as snacks over 150 years ago, and are one of the
most popular potato snack categories (Kwak et al., 2015),
representing approximately 20% of the total USA snack
market, and generating sales of over $100 million per year
in Korea (Cho et al., 2010).
Potato chips can be broadly classified into ‘natural potato
chips,’ which are produced from fresh potatoes that are
washed, peeled, cut, and fried in oil, and ‘fabricated potato
chips,’ made from potato powder and kneaded into a
sheet (Korea Food Industry Association and Chung-ang
university industry-academic cooperation foundation,
2011). Each of these categories has a further three sub-
categories: chips fried in oil, chips sprayed with oil on
the surface, and oil-free chips. Among these three sub-
categories, chips fried in oil has dominated the potato
snack market for a long time because of its distinct,
desirable texture and fatty flavor combination (Shedeed
et al., 2020). Fat confers desirable texture, flavor, and aroma
characteristics on various foods (Rao, 2003). It affects the
order that flavor components are released in the mouth,
provides lubricating effects, a desirable mouthfeel, and has
an important role in satiation. In an emulsion, fat droplets
trigger sensations of smooth/creamy/rich texture and
flavor (Rios et al., 2014). The melting properties of fat
crystals largely determine the spreadability, stability, and
other texture attributes to food. As a medium for heat
transfer at high temperatures, it generates food textures
that are brittle, crunchy, and crispy (McClements and
Decker, 2010).
However, increased demand in consumers’ preference
for health-oriented foods had expanded the choice of
low-fat and low-calorie products. To compete in this
environment, the potato snack food segment is gradually
expanding its manufacture of oil-free potato chips as a
healthy alternative to traditional potato chips. Low-fat or
Although consumer hedonic perception on various food products was evaluated under blind and informed conditions, little research was
conducted on commercial potato chips to examine how consumers’ perception would change after products’ information was disclosed to
consumers. Sensory profiles and hedonic perception of six marketed potato chips were investigated under blind and informed conditions,
including the specific product manufacturer, nutritional ingredients, and additives. A total of 18 sensory attributes of the chips were
profiled by descriptive analysis, and all samples were evaluated under blind or informed conditions by 80 consumers, who rated their
acceptance. Significant variations in sensory profiles between tested samples were observed, indicating a broad range of product quality
in the marketplace. For the informed consumer test, the health-related positive effect such as oil-free on overall liking scores was not
manifested. It suggests that consumers are not willing to compromise on taste, regardless of any benefit, including health. Cluster analysis
also showed that no clear market segmentation was observed in both blind and informed evaluations. Therefore, it is concluded that
whether potato chips are health-oriented or not is not a key factor in dictating consumers’ hedonic perception. Taste is the most important
factor affecting consumer choice when purchasing potato chips.
Keywords: Potato chips; Health-oriented; Sensory analysis; Blind and informed test
A B S T R A C T
Emirates Journal of Food and Agriculture. 2020. 32(7): 543-549
doi: 10.9755/ejfa.2020.v32.i7.2123
http://www.ejfa.me/
R E S E A R C H A R T I C L E
2. Lee and Lee
544 Emir. J. Food Agric ● Vol 32 ● Issue 7 ● 2020
fat-free potato chips should have similar sensory quality
compared with traditional fried chips (Oladejo et al., 2018;
Wu et al., 2013). To develop a product that meets consumer
expectations, factors that affect the quality attributes and
consumer preferences of potato chip products need to be
objectively studied and validated through scientific methods
(Jee et al., 2008).
The success of innovative products in the market mainly
depends on consumer acceptability (Temesi et al.,
2019). One of the most critical factors for consumer
acceptability is flavor or expected flavor of the product
(Jonas et al., 1998; Krutulyte et al., 2008; Poulsen,
1999). Some authors reported that consumers did not
seem willing to compromise on flavor, regardless of
the food product’s health benefits or any other positive
effects (Kraus, 2015; Lalor et al., 2011; Lyly et al.,
2007). However, it is widely recognized that consumer
acceptance can be affected by not only intrinsic factors,
such as the sensory characteristics of the product,
but also by extrinsic factors, including product brand,
ingredients, or packaging etc (de Andrade et al., 2018;
Jaeger, 2006).
Although commercial oil-free potato chips are becoming
more interesting to consumers, studies that identify the
relationship between the extrinsic factors of products
described above and their consumer acceptability are rare.
Therefore, it is warranted to study consumer perception
for commercial potato chips including oil-free potato chips
under informed conditions (Asioli et al., 2017). Research
investigating the sensory and hedonic perception of
commercial potato chips in Korea by blind or informed
consumer tests has not yet been addressed in the literature,
therefore representing both a research and market
opportunity. This study was conducted to evaluate the
sensory profile and hedonic perception of six marketed
potato chips, including oil-free products, under blind and
informed conditions.
MATERIALS AND METHODS
Sample collection
Six commercial potato chips were obtained from a local
market in Korea. Chips with a broad range of sensory
properties and most consumed in Korea were selected for
this study. Four chips were conventional, which were fried
in oil ranging from 16 % to 22 % of fat content, while
the other two chips were oil free. A total of 20 bags were
purchased for each brand. All the potato chip bags had
a similar date of manufacture, indicating a similar shelf
life. Chips were kept at 20±1 ºC prior to all the analyses.
The detailed information on the products used is shown
in Table 1.
Descriptive analysis
An experienced (more than 1 year) panel of eight subjects
(6 female and 2 male, age range 21–31 years) conducted the
descriptive analysis of the various food products, including
snacks. They had extensive experience in establishing and
evaluating flavor and texture lexicon of food.
A total of 18 attributes related to the appearance, flavor,
and texture of potato chips were established on consensus
and evaluated on 15-point numerical scales (Table 2).
Two 5-h orientation sessions were held for the panelists
to familiarize themselves with the testing procedure and
minimize the variation among the panelists. Panelists
performed all tests in individual booths with adequate
lighting to minimize any potential psychological biases
associated with the samples. Samples (duplicates) were
presented in a completely randomized block design
(block = replication). Each session was followed by a 15-
min break. Panelists were asked to cleanse their palates with
water between evaluations. Side-by-side methodological
comparisons of samples were made for the evaluation of
each attribute to allow intensity comparisons within the
samples.
Table 1: Descriptions of potato chips used in this study
Name of potato chip (Abbreviation) Name of manufacturer Potato content(%) Fat content(%1)
) Ingredients
Potatochip (PTC) Nongshim 91 22 Potato, Rice bran oil, palm oil,
Seasoned salt
Pockachip (PKC) Orion 90 20 Potato, Mixed edible oil(Palm
olein oil, sunflower oil), Seasoned
salt, synthetic flavor
Sumi potato chip (SMC) Nongshim 94 16 Potato, Rice bran oil, palm oil,
Seasoning salt powder, Roasted
sun salt
Muddukdduk potato chip (MDD) Orion 85 20 Potato, Vegetable oil 1(Palm
olein oil, sunflower oil), pepper
salt seasoning, Vegetable oil 2
Just like your name potato chip (JLN) Lotus flower village 100 0 Potato
Uniontech potato chip (UNT) Uniontech 100 0 Potato,
1)
The % Daily Value indicates how much a nutrient in 30g of products to a daily diet, 2,000 calories a day is used for general nutrition advice
3. Lee and Lee
Emir. J. Food Agric ● Vol 32 ● Issue 7 ● 2020 545
Consumer acceptance test
This study was approved by the Institutional Review Board
of Dankook University in Korea (approval number: DKU
2018-07-014). A total of 80 consumers who had consumed
potato chips at least twice a week participated in the test.
Age of consumers participated was ranged from 20’s to
50s, while the ratio of male and female was almost the
same. The test was performed under blind and informed
conditions because how consumers’ perception would
change after the products’ information was disclosed to
consumers was of key concern in this test. All tests were
administered as a home-use-test. The blind test, in which
samples were presented with 3-digit random codes without
any type of product information, was followed by the
informed test. For the informed test, six identical samples
with the same blind test coded 3-digit numbers were given
to consumers. Approximately 20 g of each sample (10–20
pieces of chips depending on the sizes) was repackaged
in aluminum foil bags (10.0 × 15.0 cm) and given to each
consumer, along with the product information, including
its photo, name, raw material contents, and nutritional
information. A preliminary test was conducted to monitor
the moisture content of the repackaged samples during
7 days of storage. The moisture content of the repackaged
samples was stable over 7 days of storage (data not shown).
A 9-point hedonic scale was used.
Statistical analysis
XLSTAT version 2019 (Addinsoft, Paris, France)
software was used for the statistical analyses. Sensory
and consumer data were analyzed by two way analysis of
variance (ANOVA), followed by Tukey’s multiple range
test at P < 0.05 when significance existed. Products were
treated as fixed effects, while panelist and panelist by
product interaction (if significant, α = 0.05) were treated
as random effects. The interaction was used as the error
mean square in denominator of the F-statistics for testing
product variations. Principal component analysis (PCA)
was performed using descriptive analysis results to identify
the relationship between the products and their sensory
attributes. An independent t-test was run to identify
significant differences between blind and informed groups
in their ratings of overall liking (OL), appearance, flavor,
and texture of each sample. Agglomerative hierarchical
clustering analysis based on Ward’s method was used to
cluster each blind and informed group of consumers based
on their OL of the samples. The OL of each cluster in the
blind and informed groups was analyzed by ANOVA, and
the means were separated by Tukey’s multiple range test at
P < 0.05. PCA was then conducted for each test-type group
(blind and informed) to identify consumer’s acceptability
of the samples.
RESULTS AND DISCUSSION
Descriptive analysis
The mean values of the descriptive sensory attributes
for each product are shown in Table 2. The interactions
between the products and panelists for all the sensory
attributes were not significant (P < 0.05), indicating that
the chips tested were perceived similarly by the panelists.
All 12 flavor-based attributes, including appearance, but
just half out of the six texture-related attributes showed
Table 2: Mean intensities of sensory attributes for potato chips
Attributes Samples
MDD PKC PTC SMC JLN UNT
Appearance Yellowness 8.2a1)
4.9bc
6.4ab
3.3cd
6.6ab
2.1d
Thickness 10.4a
4.3cd
4.4cd
6.0bc
6.9b
3.8d
Foamability 6.9b
5.1b
4.8b
5.2b
10.4a
9.6a
Odor/Aroma Potato 5.3bc
7.6ab
9.0a
7.1ab
3.8c
4.4c
Oil 6.8a
7.6a
8.3a
6.8a
3.1b
3.3b
Taste Sweetness 3.3abc
4.5a
2.9abc
3.5ab
2.0bc
1.4c
Saltiness 11.0a
9.5ab
7.3c
7.9bc
2.8d
2.3d
Umami 7.9a
6.8ab
5.3bc
5.1bc
3.2c
3.0c
Pepper 10.8a
5.9b
4.8bc
3.8cd
1.8de
1.4e
Potato 7.9ab
9.2a
8.5ab
7.4ab
5.9b
6.8ab
Starch 3.7c
4.8c
5.3c
5.0c
8.4b
10.3a
Acridity 3.9bc
4.7abc
3.4c
3.7bc
6.3ab
6.5a
Texture/ Mouthfeel Brittleness 7.6a
6.1a
5.1a
5.4a
6.6a
7.1a
Hardness 10.1a
4.4c
3.8c
5.5bc
7.1b
5.5bc
Crispness 11.0a
8.6ab
8.1b
8.9ab
9.9ab
8.5b
Cohesiveness 4.8a
5.8a
6.6a
5.6a
4.4a
5.2a
Adhesiveness 6.8a
5.6a
7.4a
7.1a
5.9a
7.1a
Greasy 7.9ab
8.8a
7.4ab
6.1b
2.4c
2.7c
Product names are the same as in a Table 1. 1)
Different superscripts in the same row are significantly different at p<0.05
4. Lee and Lee
546 Emir. J. Food Agric ● Vol 32 ● Issue 7 ● 2020
significant differences. This result implies that the presence
and absence of oil in commercial chips have a greater
effect on flavor than the texture of the product (Garayo
and Moreira, 2002). In addition, different seasonings in
products might also impart different effects on the flavors
of the products. Interestingly, significant differences were
observed for hardness, crispness, and greasiness among
products. Hardness and crispness were the highest for
MDD. However, MDD had the highest thickness (Table 2),
and this could have affected these results because no clear
trends of hardness and crispness were found for both
oil and oil-free products. It has been reported that the
thickness of potato chips could be positively correlated
with their sensory texture properties (Salvador et al., 2009).
As expected, products JLN and UNT were the least greasy
because of their oil-free characteristics.
Among the appearance attributes, the yellowness and
thickness of MDD were significantly higher than the
other products. The color of potato chips has been
associated with the content of reducing sugars in potato
(Kumar et al., 2004). Although the reducing sugars were
not measured in this study, we suppose that MDD might
have a higher content of reducing sugars than the other
products. As the storage period of potato increases, the
amount of reducing sugars increases as well (Kumar
et al., 2004). Surface foamability was highest for JLN and
UNT. This observation might be attributed to a different
manufacturing process for JLN and UNT compared with
the other products, although the exact manufacturing
process of the products was unknown. It is noteworthy
that JLN and UNT are not fried in oil, but instead baked
in a conventional or microwave oven, which might lead
to insufficient gelatinization of the potato starch (Ravli,
2012). Another possible explanation for their high surface
foamability would be that there is a larger amount of potato
in these products than the other products. It was reported
that the higher the starch content of potato chips, the less
likely they might be gelatinized (Kawai et al., 2007).
Three basic tastes, namely sweet, salty, and umami, were
highest in MDD, PKC, PTC, and SMC. These products
contained additives, such as processed seasoning salts
(Table 2). Pepper flavor was the strongest in MDD because
only MDD contained pepper. It is considered that the
saltiness and umami of MDD were significantly higher as
a result of the higher amount of additives, including salt
seasonings or pepper, relative to the other samples. Pepper
is often used as a saltiness substitute (Shin and Lee, 2010),
so samples that were saltier than others were considered
to have strong pepper flavor. Acridity and starchy flavor
were significantly higher for UNT and JLN than the other
samples. It is thought that the starchy flavor of potato
was strong because only UNT and JLN did not contain
any additives. Insufficient starch gelatinization of these
products, as discussed above, could be another possible
reason. Acridity is known as a combination of spicy,
astringent, and bitterness, which is a colloidal taste when
starch contacts the tongue receptors (Lee, 1992).
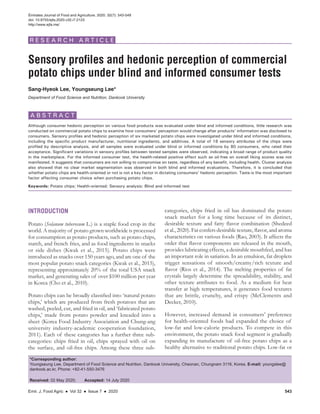
To visualize the relationships of products with their
attributes, PCA was performed using six products and 15
attributes that showed statistical significance (P < 0.05).
The PCA biplot explained 84.77% (F1:55.01%, F2:
29.76%) of the total variation (Fig. 1). The F1 dimension
mainly accounted for attributes of oil aroma, sweetness,
saltiness, umami, potato flavor, pepper flavor, and greasy.
The samples of MDD, SMC, PTC, and PKC had high
(positive) sensory values for these characteristics. In
the opposite (negative) direction were the attributes of
foamability, starchy flavor, and acridity, and the samples
of JLN and UNT. Attributes of thickness, crispness, and
hardness, and samples of MDD and JLN were loaded
positively on F2. For each sample, MDD showed higher
yellowness, pepper flavor, umami, and saltiness, whereas
JLN had higher foamability and acridity. UNT had a more
intense starchy flavor than the other samples. SMC, PKC,
and PTC showed similar sensory attributes to each other,
and prominent characteristics of potato flavor, oil flavor,
sweetness, and greasy.
Consumer acceptability between blind and informed
groups
Results of the consumer acceptance test for the blind
group evaluated without product information, and the
informed group that provided product information are
presented in Table 3. Consumer liking attributes were
significantly influenced by the products, as well as the
Fig. 1. PCA loadings for sensory attributes and the scores of the potato
chips. Product codes are as Table 1.
5. Lee and Lee
Emir. J. Food Agric ● Vol 32 ● Issue 7 ● 2020 547
evaluation methods. PKC received the highest score in
OL, while JLN was least liked by consumers under the
blind condition. For the informed evaluation, SMC, PKC,
and PTC obtained the highest liking scores, while UNT
and JLN were grouped in the lowest liking category. The
reason SMC and PKC were shifted up to the highest
liking group after product information was disclosed to
consumers under the informed test could be related to
brand power or familiarity of products (Paasovaara et
al., 2012). Products SMC and PKC were known to be
two of the top-selling conventional products in Korea.
The same explanation could be reasoned for the lowest
liking groups considering that UNT and JLN have
relatively low brand power in Korea’s snack market. It
would be also interesting to note that although products
UNT and JLN were oil-free products, it failed to draw
consumer’s attention in liking. This is interesting because
the effect of health-related factors was not great contrary
to expectations in selecting potato chips. This would be
more discussed hereafter.
Jaeger (2006) reported branding of products plays a key role
in consumers’ acceptability of food products. Well-known
branded products can add additional value to products,
including consumer familiarity, unique features, purchase
royalty, or positive recognition (Anselmsson et al., 2007;
Krystallis and Chryssohoidis, 2005). The reason is that
the product brand can serve as a relevant quality cue for
consumers, as consumers would buy these products on a
regular and routine basis under time pressure (Bredahl,
2004). Research (Ares et al., 2010; Arnade et al., 2008;
Cohen and Goodman, 2009) has demonstrated that familiar
brands could be associated with consumers’ attributes or
intentions toward products, such as purchase intentions,
choice preferences, and repurchase intention.
Yan et al. (2015) stated that health-related information
on products might increase consumer preference when
buying snacks. However, it was observed that the impact
of product information of oil-free products (UNT and
JLN) on OL values were minimal in this study (Table 3).
Despite knowing there is no fat in chips, an informed test
can potentially increase the acceptability of the product, but
it did not happen in this study. Such a result could imply
that consumers consider taste over any other information
about the products when buying potato chips. Consumer
acceptance toward food products is more likely influenced
by taste or expected taste of the product than any positive
health aspect associated with its consumption (Krutulyte
et al., 2008). Several studies demonstrated that consumers
were not willing to compromise on products’ taste or
purchase food products in exchange for products’ positive
health effects (Kraus, 2015; Lalor et al., 2011; Lyly et al.,
2007).
The mean OL scores of the products depending on the
consumer clusters according to test type are shown in
Table 4. In the blind group, cluster 1 consisted of 40%
of the panel (n = 32). Consumer acceptability of oil-free
products was higher in cluster 1 than cluster 2, which had
relatively higher consumer acceptability of fried products.
As a result, cluster 1 could be considered as a group that
preferred oil-free products. However, differences in OL
according to each cluster were minimal. No clear market
segmentation was observed in both blind and informed
evaluations, although slight increases in OL values were
found for some of the products (SMC, PTC, PKC,
and MDD) for cluster 2 under the informed test. This
outcome provides further support that the effects of
product information on the OL of chips are minimal.
Instead, consumer liking perception is driven by the
sensory profiles or any other extrinsic information of
products. This finding corroborated with previous studies
that found no significant effects on consumer hedonic
response when product label information was disclosed
(Meier-Dinkel et al., 2013). Therefore, it can be concluded
that the information as to whether chips contain oil or are
oil-free is not a drastic factor in determining consumer
hedonic perception. The PCA was conducted to visualize
the orientation of consumers’ preference for each cluster
in the blind (Fig. 2A) and informed (Fig. 2B) groups.
Most of the consumers in the blind and informed groups
were on the positive F1-axis. Compared with the blind
group, the points of some consumers in the informed
group moved to negative F1-axis in the UNT and JLN
Table 3: Overall liking, appearance, flavor and texture for potato chips according to test types (blind or informed test)
Sample Overall liking Appearance Flavor Texture
Blind Informed Blind Informed Blind Informed Blind Informed
UNT 4.6c1)
ns
2)
4.3c
5.1c
A
4.5c
B
4.1d
ns
3.7d
5.3c
A
4.5c
B
SMC 6.1b
B
3)
6.6a
A
6.0ab
B
6.5a
A
6.1b
B
6.6ab
A
6.0b
B
6.6a
A
PTC 5.9b
ns
6.0ab
6.2ab
ns
6.3ab
5.9bc
ns
6.0bc
5.9bc
ns
6.0ab
PKC 6.9a
ns
6.5a
6.5a
ns
6.4a
7.0a
ns
6.8a
7.0a
ns
6.7a
MDD 5.4b
ns
5.6b
5.8bc
ns
5.7b
5.4c
ns
5.5c
5.2c
ns
5.4b
JLN 3.4d
B
4.1c
A
3.9d
ns
4.3c
3.0e
B
3.6d
A
3.7d
ns
4.2c
Product names are the same as in a Table 1. 1)
Different superscripts in the same column for each test type are significantly different at p<0.05. 2)
“ns” means “not
significant” at p<0.05.3)
Different subscript in the same row for each test type are significantly different at p<0.05
6. Lee and Lee
548 Emir. J. Food Agric ● Vol 32 ● Issue 7 ● 2020
direction. In addition, consumers on the PCA biplot moved
from cluster 2 that disliked oil-free potato chips to cluster
1 that preferred oil-free potato chips. The reason is the
similarity of the attributes in the descriptive analysis, and
the raw material content of the samples.
CONCLUSIONS
The overall sensory quality of commercial potato chips
currently marketed in Korea was found to vary significantly.
The significant variations in the quality of chips seemed to
be attributed mainly to, firstly, whether the chips were fried
in oil or fat-free, and second, the different seasonings used
in the manufacturing process. Under informed test with
disclosing the product information to consumers, the effect
of brand power or familiarity of products was observed,
allowing some products’ liking to increase. Interestingly,
the positive effect from product information of oil-free
products (UNT and JLN) on OL values was not noticeable,
suggesting that consumers put more emphasis on taste than
product information when buying potato chips. Consumers
seemed unwilling to compromise on products’ taste.
Accordingly, it is summarized that whether potato chips are
fried or not is not a major factor in determining consumer
hedonic perception. Taste is the most important factor
affecting consumer choice when purchasing potato chips.
The results are limited to potato chips with 80 consumers,
and the extension of this study to different types of snacks
with larger number of consumers could be an interesting
research avenue to pursue.
ACKNOWLEDGEMENTS
This research was supported by the research fund of
Dankook Univ. in 2020.
REFERENCES
Anselmsson, J., U. Johansson and N. Persson. 2007. Understanding
price premium for grocery products: A conceptual model of
customer-based brand equity. J. Prod. Brand. Manag. 16(6):
401-414.
Ares, G., A. Giménez and R. Deliza. 2010. Influence of three non-
sensory factors on consumer choice of functional yogurts over
regular ones. Food Qual. Prefer. 21(4): 361-367.
Arnade, C., M. Gopinath and D. Pick. 2008. Brand inertia in US
household cheese consumption. Am. J. Agric. Econ. 90(3):
813-826.
Asioli, D., P. Varela, M. Hersleth, V. L. Almli, N. V. Olsen and T. Naes.
2017. A discussion of recent methodologies for combining
sensory and extrinsic product properties in consumer studies.
Food Qual. Prefer. 56: 266-273.
Bredahl, L. 2004. Cue utilisation and quality perception with regard to
branded beef. Food Qual. Prefer. 15(1): 65-75.
Cho, J. H., Y. E. Park, K. S. Cho, D. C. Chang, W. B. Son, J. T. Suh
and H. J. Kim. 2010. Analysis of Potato Production in USA
and Its Effect on the Korean Potato Chip Industry, 93th
Autumn
Symposium. Chungbuk National University, Korean Society
for Horticulture Science, Chungju, Chungbuk, Suwon, Korea,
pp. 1-6.
Cohen, E. and Goodman, S. 2009. An international comparison of
retail consumer wine choice. Int. J. Wine Bus. Res. 21(1): 41-49.
de Andrade, J. C., E. S. Nalério, C. Giongo, M. D. de Barcellos, G.
Fig. 2. PCA on consumer overall liking of potato chips under blind test (A) and informed test (B). Squares and circles are samples and consumers.
Arrows are the directions for center points of each cluster from the agglomerative hierarchical clustering analysis.
A B
Table 4: Mean overall liking for potato chips depending on
consumer clusters by agglomerative hierarchical clustering
analysis according to test types (blind or informed test)
UNT SMC PTC PKC MDD JLN
Blind
Cluster 1
(n=32)
5.1bc1)
A
2)
5.7ab
ns
3)
4.5cd
B
6.2a
B
4.2cd
B
3.6d
ns
Cluster 2
(n=48)
4.2c
B
6.3b
6.8ab
A
7.4a
A
6.2b
A
3.3d
Informed
Cluster 1
(n=42)
4.6cd
A
6.2a
B
5.2bc
B
5.7ab
B
4.5cd
B
4.2d
ns
Cluster 2
(n=38)
3.9b
B
7.1a
A
7.1a
A
7.4a
A
6.7a
A
3.9b
Product names are the same as in a Table 1.1)
Different superscripts in the
same row for each test type are significantly different at p<0.05.2)
Different
subscript in the same column for each test type are significantly different at
p<0.05.3)
“ns” means “not significant” at p<0.05
7. Lee and Lee
Emir. J. Food Agric ● Vol 32 ● Issue 7 ● 2020 549
Ares and Deliza, R. 2018. Consumer sensory and hedonic
perception of sheep meat coppa under blind and informed
conditions. Meat Sci. 137: 201-210.
Garayo, J. and R. Moreira. 2002. Vacuum frying of potato chips. J.
Food Eng. 55(2): 181-191.
Jaeger, S. R. 2006. Non-sensory factors in sensory science research.
Food Qual. Prefer. 17(1-2): 132-144.
Jee, J. H., H. S. Lee, J. W. Lee, D. S. Suh, H. S. Kim and K. O.
Kim. 2008. Sensory characteristics and consumer liking of
commercial sojues marketed in Korea. Korean J. Food Sci.
Technol. 40(2): 160-165.
Jonas, M. S. and S. C. Beckmann. 1998. Functional Foods: Consumer
Perceptions in Denmark and England (MAPP Working Paper
no. 55). Aarhus School of Business, Aarhus, Denmark.
Kawai, K., K. Fukami and K. Yamamoto. 2007. Effects of treatment
pressure, holding time, and starch content on gelatinization and
retrogradation properties of potato starch-water mixtures treated
with high hydrostatic pressure. Carbohydrate Polymers. 69(3):
590-596.
Korea Food Industry Association and Chung-ang University Industry-
academic Cooperation Foundation. 2011. Survey on the Market
of Processed Food Segmentation Market. Korea Agro-fisheries
and Food Trade Corporation, Korea. Available from: https://
www.atfis.or.kr/article/M001050000/view.do?articleId=365andb
oardId=3andpage=andsearchKey=andsearchString=andsearch
Category.
Kraus, A. 2015. Factors influencing the decisions to buy and consume
functional Food. Br. Food J. 117(6): 1622-1636.
Krutulyte, R., K. G. Grunert, J. Scholderer, K. S. Hagemann, P.
Elgaard, B. Nielsen and J. P. Graverholt. 2008. Motivational
factors for consuming omega-3 PUFAs: An exploratory study
with Danish consumers. Appetite. 51(1): 137-147.
Krystallis, A. and G. Chryssohoidis. 2005. Consumers’ willingness to
pay for organic food. Br. Food J. 107(5): 320-343.
Kumar, D., B. P. Singh and P. Kumar. 2004. An overview of the factors
affecting sugar content of potatoes. Ann. Appl. Biol. 145(3):
247-256.
Kwak, H. S., Y. H. Chang and Y. Lee. 2015. Estimation of crispness
and consumer acceptance of fried potato chips by mechanical
and acoustic measurements. Int. J. Food Sci. Tech. 50(2):
500-506.
Lalor, F., C. Madden, K. McKenzie and P. G. Wall. 2011. Health claims
on foodstuffs: A focus group study of consumer attitudes. J.
Funct. Foods. 3(1): 56-59.
Lee, B. J. 1992. The mechanism of taste. Korean J. Food Cook. Sci.
8(2): 169-175.
Lyly, M., K. Roininen, K. Honkapää, K. Poutanen and L. Lähteenmäki.
2007. Factors influencing consumers’ willingness to use
beverages and ready-to-eat frozen soups containing oat
β-glucan in Finland, France and Sweden. Food Qual. Prefer.
18(2): 242-255.
McClements, D. J. and Decker, E. A. 2010. Lipídeos. In: Damodaran,
S., K. L. Parkin and O. R. Fennema (Ed.), Química de Alimentos
de Fennema. 4th
ed. Artmed, Porto Alegre.
Meier-Dinkel, L., J. Trautmann, L. Frieden, E. Tholen, C. Knorr, A. R.
Sharifi and D. Mörlein. 2013. Consumer perception of boar meat
as affected by labelling information, malodorous compounds
and sensitivity to androstenone. Meat Sci. 93(2): 248-256.
Oladejo, A. O., H. Ma, W. Qu, C. Zhou, B. Wu, B. B. Uzoejinwa
and X. Yang. 2018. Application of pretreatment methods on
agricultural products prior to frying: A review. J. Sci. Food Agric.
98(2): 456-466.
Paasovaara, R., H. T. Luomala, T. Pohjanheimo and M. Sandell.
2012. Understanding consumers’ brand-induced food taste
perception: A comparison of brand familiarity-and consumer
value-brand symbolism (in) congruity-accounts. J. Consum.
Behav. 11(1): 11-20.
Poulsen, J. 1999. Danish Consumers’ Attitudes Towards Functional
Foods, No. 62. University of Aarhus, Aarhus School of Business,
The MAPP Centre, Denmark.
Rao, M. A. 2003. Phase transitions, food texture and structure. In:
McKenna, B. M. Texture in Food: Semi-solid Foods. Vol. 1.
Woodhead Publishing, Cambridge.
Ravli, Y. 2012. Improved Vacuum Frying Process for High Quality
Sweet Potato Chips. (Master’s Thesis), TexasAand M University.
Available from: http://www.hdl.handle.net/1969.1/148101.
Rios, R. V., M. D. F. Pessanha, P. F. D. Almeida, C. L. Viana and
S. C. D. Lannes. 2014. Application of fats in some food products.
Food Sci. Technol. 34(1): 3-15.
Salvador, A., P. Varela, T. Sanz and S. M. Fiszman. 2009.
Understanding potato chips crispy texture by simultaneous
fracture and acoustic measurements, and sensory analysis.
LWT-Food Sci. Technol. 42(3): 763-767.
Shedeed, N. A., E. S. A. El-Hady and R. A. ALoweis. 2020. Production
of oil-free crunchy potato chips using microwave. Food Nutr. Sci.
11(1): 40.
Shin, M. G. and G. H. Lee. 2010. Sensory and anti-oxidative
properties of the spice combinations as salty taste substitute. J.
Korean Soc. Food Sci. Nutr. 39(3): 428-434.
Temesi, Á., Á. Bacsó, K. G. Grunert and Z. Lakner. 2019. Perceived
correspondence of health effects as a new determinant
influencing purchase intention for functional food. Nutrients.
11(4): 740.
Wu, B. C., B. Degner and D. J. McClements. 2013. Creation of reduced
fat foods: Influence of calcium-induced droplet aggregation on
microstructure and rheology of mixed food dispersions. Food
Chem. 141(4): 3393-3401.
Yan, M., D. Brown, A. Parsons, G. Whalley, N. Hamid, K. Kantono and
E. Rush. 2015. Branding, ingredients and nutrition information:
Consumer liking of a healthier snack. J. Food Res. 4(5): 2015.