Chandigarh Call Girls 👙 7001035870 👙 Genuine WhatsApp Number for Real Meet
Stability of the BFI over time.
1. Long-Term Correlated Change in Personality Traits in Old Age
Mathias Allemand, Daniel Zimprich, and Mike Martin
University of Zurich
The present study examines long-term correlated change in personality traits in old age across a time
period of 12 years. Data from the Interdisciplinary Study on Adult Development were used to investigate
different aspects of personality change and stability. The sample consisted of 300 adults ranging from 60
to 64 years of age at Time 1. Personality was measured with the NEO Five-Factor Inventory. Longitu-
dinal structural stability, differential stability, change in interindividual differences, mean-level change,
and correlated change of the 5 personality traits were examined utilizing structural equation modeling.
After having established strict measurement invariance, factor variances in Openness to Experience and
Conscientiousness were found to be different across testing occasions, implying variant covariation
patterns over time. Stability coefficients were around .70, indicating high but not perfect differential
stability. The amount of interindividual differences increased with respect to Openness to Experience and
Conscientiousness. Both mean-level change and stability in personality were observed. Eventually,
except for Neuroticism, a number of medium effect-sized correlations among changes in personality traits
emerged, implying that personality changes share a substantial amount of commonality.
Keywords: personality traits, personality change, correlated change, aging, life span development
There is now growing evidence that both stability and change
mark personality trait development across the adult lifespan
(e.g., Allemand, Zimprich, & Hendriks, 2008; Caspi, Roberts, &
Shiner, 2005; McCrae et al., 1999; Roberts & DelVecchio, 2000;
Roberts, Walton, & Viechtbauer, 2006; Srivastava, John, Gosling, &
Potter, 2003; Terracciano, McCrae, Brant, & Costa, 2005). Gen-
erally, personality change and stability can be evaluated from
multiple perspectives. For example, structural stability (i.e., con-
stant correlations among personality factors within measurement
occasions) implies that the positioning of traits relative to each
other remains stable and is unaffected by age and aging. Differ-
ential stability indicates perfect correlations within personality
factors across measurement occasions, implying that individuals
keep their ranking in a reference group over time. Mean-level
change suggests that the average trait score of the group has
changed. Contrasting these sample- or population-oriented per-
spectives of change, the concept of individual differences in in-
traindividual change (e.g., Alwin, 1994; Nesselroade, 1991) im-
plies that individuals change differentially; also the degree and
direction or pattern of change may vary across people. Regarding
personality traits, there is growing evidence for the existence of
interindividual differences in personality trait change in young
adulthood (e.g., Robins, Fraley, Roberts, & Trzesniewski,
2001), middle age (e.g., Allemand, Zimprich, & Hertzog, 2007;
Roberts, Helson, & Klohnen, 2002), and old age (e.g., Alle-
mand et al., 2007; Mroczek & Spiro, 2003; Small, Hertzog,
Hultsch, & Dixon, 2003). To summarize, interindividual differ-
ences in intraindividual change speak to the unique develop-
mental patterns particular to individual lives.
The purpose of the present study was to extend previous re-
search on personality trait development by examining the afore-
mentioned aspects of stability and change in old age over a 12-year
time period, augmented by two additional aspects of change.
Specifically, we were interested in change in interindividual dif-
ferences in personality traits, and, particularly, in intraindividual
correlated change in personality.
Change in Interindividual Differences
Irrespective of the level of differential stability and mean-level
change, the amount of interindividual differences in personality
traits might change across time (e.g., Biesanz, West, & Kwok,
2003; Martin & Zimprich, 2005). In the sequel, we will use the
phrase change of divergence to describe change in individual
differences in personality traits. Empirically, this aspect of change
can be examined by comparing personality factor variances cross-
sectionally and, preferably, longitudinally. An increase or decrease
of personality factor variances would indicate that the amount of
change is different for different persons. Indeed, with respect to
cognitive functions, there is empirical evidence for increasing
variability with age regarding cognitive variables such as reaction
time, memory, or fluid intelligence (cf. Morse, 1993; Nelson &
Dannefer, 1992). If we borrow from the literature on cognitive
development, different amounts of individual differences in per-
sonality traits might be indicative of the variables governing
change and development. Horn (1988) has argued that relatively
Mathias Allemand, Daniel Zimprich, and Mike Martin, Department of
Psychology, University of Zurich, Zurich, Switzerland.
This publication is based on data from the Interdisciplinary Longitudinal
Study on Adult Development (ILSE), funded by the Federal Ministry of
Family Affairs, Senior Citizens, Women and Youth, Germany (AZ: 301-
1720-295/2). The order of the first two authors is strictly alphabetical; both
contributed equally.
Correspondence concerning this article should be addressed to Mathias
Allemand or Daniel Zimprich, Department of Psychology, Gerontopsy-
chology, University of Zurich, Binzmu¨hlestrasse 14/24, CH-8050 Zurich,
Switzerland. E-mail: m.allemand@psychologie.uzh.ch or d.zimprich@
psychologie.uzh.ch
Psychology and Aging Copyright 2008 by the American Psychological Association
2008, Vol. 23, No. 3, 545–557 0882-7974/08/$12.00 DOI: 10.1037/a0013239
545
2. homogeneous developmental trajectories might characterize a
more biologically driven developmental process, whereas increas-
ing variances might denote changes triggered by external influ-
ences that are socially driven. Based on this line of reasoning, the
amount of interindividual differences should be relatively stable if
person variables such as personality, cognition, or attitudes are
more genetically based (Johnson, McGue, & Krueger, 2005). By
contrast, increasing differences among individuals might arise
through a number of reasons such as the combined effects of
individuals’ unique experiences over more years producing in-
creasing differences among them or significant changes in physi-
ological and functional status in later adulthood.
To the best of our knowledge, only three studies have rigorously
tested change of divergence in the five personality traits. Small et
al. (2003) found that the Big Five personality factor variances were
equal across a 6-year period in a sample of older adults, implying
perfect stability of divergence across time. Allemand et al. (2007)
reported that, cross-sectionally, but not longitudinally, the Open-
ness to Experience variance in middle-aged participants (aged
42–46) was significantly larger than in older participants (aged
60–64) at two measurement occasions across 4 years. Recently, in
a large and representative Dutch sample, Allemand et al. (2008)
found that personality factor variances were cross-sectionally
equal across six age groups. To summarize, examination of age-
related changes in variances in the five personality traits across the
lifespan represents an important complement to the examination of
correlational and mean structures of personality.
Correlated Change
An important developmental question is whether changes in
different personality traits are related over time. Therefore, the
examination of specific versus general change (Allemand et al.,
2007; Martin & Zimprich, 2005; Zimprich, 2002a, 2002b; Zim-
prich & Martin, 2002) that can be examined through correlated
change on the latent level by means of latent change models
(Hertzog & Nesselroade, 2003; McArdle & Nesselroade, 1994)
focuses on the question whether changes in the Big Five person-
ality traits are related across individuals. It might be that the same
underlying causes of change such as social roles, life events, and
social environments (cf. Caspi & Roberts, 2001; Roberts & Caspi,
2003) operate simultaneously on multiple personality constructs
such as the Big Five. Recently, by investigating correlated change
in middle-aged and older adults across a 4-year period, Allemand
et al. (2007) found a number of statistically significant change
correlations with average absolute correlations of .36 and .32 for
middle-aged and older participants, respectively. This implies that
personality trait change over 4 years seems to occur in a concerted
manner. A more restrictive variant of a correlated change model
would test for equality of correlations at the first measurement
occasion, Time 1 (T1), that is, latent level factor correlations and
latent change factor correlations. Should equality hold, this would
imply “intercorrelations stationarity,” that is, stability of the asso-
ciations among personality factors over time.1
Specifically, if the
correlation between change factors is used as an estimate of
correlated linear change that would emerge if the longitudinal time
span tended to infinity, it can be shown that the cross-sectional
correlations among personality factors approach the change factor
correlations (cf. Hofer, Flaherty, & Hoffman, 2006). An indication
of intercorrelations stationarity would imply neither differentiation
nor dedifferentiation (e.g., Baltes, Cornelius, Spiro, Nesselroade,
& Willis, 1980). Intercorrelations stationarity is similar to but not
the same as structural stability. Whereas structural stability is
established in a step-by-step fashion in comparing pairs of mea-
surement occasions, intercorrelations stationarity is directly based
on change but has implications for the individual measurement
occasions.
Longitudinal Measurement Invariance
In order to ensure that the same psychological construct (e.g.,
Neuroticism) operates in the same way at different time points and
that the measure of that construct has equivalent measurement
properties, one has to establish longitudinal measurement invari-
ance (MI; cf. Bontempo & Hofer, 2006; Horn & McArdle, 1992;
Meredith, 1993; Meredith & Horn, 2001). Briefly, MI entails the
degree to which a measure behaves equivalently over testing
occasions and/or across different groups such as age groups. One
might distinguish four forms of longitudinal MI (cf. Meredith,
1993): (a) Configural invariance entails that the number of factors
and according salient and nonsalient loadings are equal over time,
which ensures that the dimensionality of the measured constructs
is longitudinally equivalent. (b) Weak MI requires that pattern
matrices be fully invariant across measurement occasions. This
form of MI ensures that the same indicators (manifest variables) on
different measurement occasions do relate to constructs (latent
variables) in the same way. (c) Strong MI requires that pattern
matrices and intercepts of the manifest indicators be invariant over
time. Establishing this form of MI allows for meaningfully com-
paring means, covariances, and variances across measurement
occasions. (d) Strict MI requires that pattern matrices, intercepts,
and unique variances be invariant over time. This strictest form of
invariance implies that all of the differences in means, covariances,
and variances of the observed indicators across measurement oc-
casions arise from differences in latent variables or factors. Ex-
amining different degrees of MI is accomplished by employing
confirmatory factor models with increasingly severe across-group
and across-time restrictions on parameters (cf. Allemand et al.,
2007, 2008; Martin & Zimprich, 2005; Zimprich, Allemand, &
Hornung, 2006).
The Present Study
In the present study, we examined long-term changes in person-
ality from the early 60s into the mid-70s by examining structural
stability, differential stability, mean-level changes, and changes in
interindividual differences in personality traits. Furthermore, we
investigated correlated change in personality to determine whether
change in one personality trait over time is related to changes in
other traits. Specifically, we focused on the following research
questions: (a) Can strict MI of the manifest indicators be estab-
lished in the measurement of the Big Five personality factors over
time? The affirmative answer to this question represents a prereq-
uisite for addressing the following issues. (b) Does structural
1
We thank Christopher Hertzog for suggesting the intercorrelations
stationarity model.
546 ALLEMAND, ZIMPRICH, AND MARTIN
3. stability in the Big Five personality traits hold over time? (c) What
is the level of differential stability in the Big Five personality traits
over time? (d) Does the amount of interindividual differences in
the Big Five personality traits change over time? (e) Are there
mean-level changes in the Big Five personality factors over time?
(f) Are there correlated changes in the Big Five personality factors
over time in individuals? Finally, (g) are the intercorrelations
among personality changes equal to the cross-sectional correla-
tions among personality factors at T1?
Method
Sample
We used data from the Interdisciplinary Study on Adult Devel-
opment (ILSE; Martin, Gru¨nendahl, & Martin, 2001). In ILSE,
participants come from two cohorts, one comprising individuals
born before World War II and the other including individuals born
shortly after the war (i.e., 1930–1932 vs. 1950–1952, respec-
tively). The ILSE started in 1994 (T1), followed by reassessments
in 1998 (Time 2; T2) and in 2006 (Time 3; T3). So far, only
participants from the older age cohort (1930–1932) were reas-
sessed at T3. Because the focus of the present study was on
long-term changes in personality, we selected persons who partic-
ipated at the initial, the second, and the third measurement occa-
sion, but we concentrated on the T1-T3 changes only. The data on
personality changes between T1 and T2 have been reported else-
where (Allemand et al., 2007). Of those 314 participants from
originally 500 participants at T1 who returned at T3, 300 had
complete data records for the variables of interest (the Big Five
personality traits). Participants were paid €50 (ϳUS$68) for par-
ticipation at T3. Reasons for attrition before T3 were categorized
as follows: 32% of the nonreturning participants had passed away,
20% stayed away due to health reasons, while 18% did not
mention a concrete reason. In addition, 7% had moved to another
region, 6% considered the reimbursement for participation as
insufficient, 6% regarded participation as being too involved, 4%
lost their interest in participation, 4% had no time because they
were caregivers for a family member, and 3% (e.g., a relative)
suffered from an unspecified type of cognitive impairment accord-
ing to an informant.
Due to the fact that attrition may have an effect on the magni-
tude and types of change, we tested whether attrition was infor-
mative regarding (a) demographic variables and (b) personality
traits. First, we conducted attrition analyses by comparing demo-
graphic variables of the individuals included in this study with
those participants who dropped out (n ϭ 200). The average age of
participants at T1 (1994) was 62.46 (SD ϭ 0.86, range: 60–64). In
comparison to those participants who were not included in this
report (M ϭ 62.57, SD ϭ 0.95, range ϭ 60–65), there was no
statistically significant difference in age at T1, t(484) ϭ 1.30, p Ͼ
.10, Cohen’s d ϭ .12 (see Cohen, 1988, p. 20). The gender balance
was equal, with 50.7% of the sample being female, whereas 44%
of those who dropped out were female. This difference was not
statistically significant, 2
(1) ϭ 2.14, p Ͼ .10, Cohen’s w ϭ 0.07
(see Cohen, 1988, p. 216). Years of education were, on average,
10.31 (SD ϭ 2.76) for those who attended both measurement
occasions and 10.03 (SD ϭ 2.76) for those who dropped out. This
difference was not statistically significant at T1, t(484) ϭ 1.27,
p Ͼ .30, d ϭ 0.10. There was, however, a group difference with
respect to the general knowledge subtest of the Wechsler Adult
Intelligence Scale—Revised (Wechsler, 1981), with those partic-
ipants who dropped out showing a lower knowledge score (M ϭ
14.68, SD ϭ 4.90) than those included in this report (M ϭ 16.23,
SD ϭ 4.65), t(484) ϭ 3.56, p Ͻ .001, d ϭ 0.32. Albeit being
statistically significant, this difference reflects a small effect size.
On a 5-point Likert-type scale ranging from 1 (poor) to 5 (very
good), average subjective health ratings were 3.44 (SD ϭ 1.43) for
those who remained in the study and 3.34 (SD ϭ 1.43) for those
who did not return. No significant difference was found, t(484) ϭ
0.78, p Ͼ .10, d ϭ 0.07.
It is possible that those persons who were assessed on T1 and T3
manifested distinct developmental patterns in personality traits
than those who dropped out. Previous research on personality trait
development has shown that attrition apparently has little effect on
estimates of differential stability (Roberts & DelVecchio, 2000)
and mean-level changes in personality traits (Roberts et al., 2006).
We examined whether there are group difference with respect to
the Big Five personality traits at T1. Those persons who were
reassessed at T3 were statistically significantly less neurotic at T1
(M ϭ 18.05, SD ϭ 6.69) than those who dropped out (M ϭ 19.39,
SD ϭ 6.79), t(484) ϭ 2.18, p Ͻ .05, d ϭ 0.20, and they were more
open to experience (M ϭ 26.05, SD ϭ 4.78) compared to those
dropped out (M ϭ 25.17, SD ϭ 4.61), t(484) ϭ 2.04, p Ͻ .05, d ϭ
0.19—effect sizes were small, however. Thus, there was evidence
that attrition was informative for at least two personality traits
in the sense that those dropping out during the study were different
at the beginning of the study. We also compared change in per-
sonality between T1 and T2 for those who remained in the study
until T3 (n ϭ 300) and those who dropped out after T2 (n ϭ 106)
using latent change models. Results showed that those who
dropped out after T2 decreased in Agreeableness between T1 and
T2, whereas those who returned at T3 increased in Agreeableness
between T1 and T2. For the correlations among changes an
intriguing pattern emerged: For those who dropped out after T2,
changes in Neuroticism between T1 and T2 were strongly
related to changes in Extraversion (r ϭ –.71) but not to changes
in the other personality traits. By contrast, for those who
returned at T3, changes in Neuroticism between T1 and T2 were
related to changes in Extraversion (r ϭ –.47), Openness (r ϭ
–.49), Agreeableness (r ϭ –.45), and most strongly to changes
in Conscientiousness (r ϭ –.75).
Together, these analyses point to a number of differences be-
tween those who did and those who did not return for a third
assessment in the sense that attrition was selective and, hence,
informative. This does not compromise the results reported below,
but it narrows their generalizability, because it appears unwar-
ranted to consider the data as being missing at random (R. J. A.
Little & Rubin, 1987) once one assumes that one might extrapolate
from findings regarding changes between T1 and T2 to changes
between T1 and T3.
Measures
We measured the Big Five personality traits using the German
Revised NEO Five-Factor Inventory (NEO-FFI; Borkenau & Os-
tendorf, 1993; Costa & McCrae, 1992). The NEO-FFI contains 60
statements that participants were asked to respond on a 5-point
547LONG-TERM CORRELATED CHANGE IN PERSONALITY TRAITS
4. Likert scale ranging from 0 (strongly disagree) to 4 (strongly
agree). The NEO-FFI yields scores for the following personality
constructs: Neuroticism, Extraversion, Openness to Experience,
Agreeableness, and Conscientiousness. Each scale consists of 12
items, which were all scaled in a way so that higher scores indicate
higher values in the direction consistent with the construct label.
Estimates of internal consistency (Cronbach’s ␣) based on the
sample of 300 participants were as follows: Neuroticism ␣ ϭ .78
(T1) and .82 (T3), Extraversion ␣ ϭ .73 (T1) and .76 (T3),
Openness to Experience ␣ ϭ .57 (T1) and .59 (T3), Agreeableness
␣ ϭ .65 (T1) and .74 (T3), and Conscientiousness ␣ ϭ .75 (T1)
and .82 (T3).
Analytic Procedures
To investigate our research questions, we utilized multiple-
groups confirmatory factor analyses by means of structural equa-
tion modeling. We assessed MI over time and then performed
direct statistical comparisons of the similarities and differences in
the factor means, variances, and covariances among the constructs.
Statistical modeling proceeded in a sequence of nine steps: (a) a
test of an unconstrained measurement model that longitudinally
specified the relationship between manifest indicators (e.g., the
NEO-FFI items) and the latent constructs (e.g., the Big Five
personality factors), (b) a test of a model of weak MI, (c) a test of
a model of strong MI, (d) a test of a model of strict MI, (e) a test
of a model of equal covariances of the latent constructs across time
(longitudinal structural stability), (f) a test of a model of equal
variances of the latent constructs across time (change in interindi-
vidual differences), (g) a test of a model of equal means of the
latent constructs across time (mean-level change), (h) a test
of latent change models to investigate correlated change among the
latent constructs, and (i) a test of an intercorrelations stationarity
model, that is, equal factor and latent change factor correlations.
In the measurement model there were five latent constructs:
Neuroticism, Extraversion, Openness to Experience, Agreeable-
ness, and Conscientiousness. For each of the five latent variables,
we created domain-representative parcels to form three manifest
indicators. Parceling is a technique commonly used with estab-
lished measures (cf. Bandalos & Finney, 2001; T. D. Little, Cun-
ningham, Shahar, & Widaman, 2002). A parcel is an aggregate-
level indicator comprising the sum (or average) of several single
items. To create parcels, we used the item-to-construct balancing
technique (T. D. Little et al., 2002, p. 166). Briefly, the three items
with the highest loadings were selected to anchor the three parcels
of each personality factor. Subsequently, the three items with the
next highest item-to-construct loadings were added to the anchors
in an inverted order. This procedure was repeated until all items
had been assigned to a parcel. As a result, three parcels consisting
of the sum of four single items each were built for each of the five
personality factors.
In order to identify and scale the models, instead of using
traditional procedures such as setting the loading of one manifest
reference variable to unity and the intercept of this reference
variable to zero (Meredith & Horn, 2001), we utilized an alterna-
tive parameterization to identification and scale setting: Common
factors were scaled by fixing their variances to unity at T1, and all
loadings were estimated freely. Furthermore, we set the factor
means to zero and estimated intercepts of all manifest indicators
instead. These identification constraints were relaxed in conjunc-
tion with more restrictive models of MI.
To examine correlated change in the Big Five personality fac-
tors, we modeled interindividual differences in intraindividual
change in the five personality factors by using latent change
models, which involve a reparameterization of the structural part
of the longitudinal factor model (McArdle & Nesselroade, 1994).
In latent change models, the level of a latent construct and the
change of this latent construct over time are estimated. More
precisely, if the indicators at T1 and T2 load on one latent variable
and the unstandardized factor loadings of the indicators are invari-
ant over time, and a second latent variable with equal factor
loadings is introduced for the indicators at T2, the variance of this
second latent variable captures interindividual differences in latent
variable change over time. Thus, the second latent variable may be
called a latent change factor. It follows that if the variance of the
second latent variable is significantly different from 0, there are
interindividual differences in intraindividual development (cf.
Nesselroade, 1991).
All analyses were conducted using Mx (Neale, Boker, Xie, &
Maes, 2003). The absolute goodness-of-fit of models was evalu-
ated using the chi-square test and two additional criteria, the
comparative fit index (CFI) and the root-mean-square error of
approximation (RMSEA). Values of the CFI above .90 are con-
sidered to be adequate, whereas for the RMSEA values less than
.08 indicate an acceptable model fit (cf. Browne & Cudeck, 1993;
Hu & Bentler, 1999). In comparing the relative fit of nested
models, we used the chi-square difference test. Due to its depen-
dency on sample size, we complemented the chi-square difference
by calculating 90% RMSEA confidence intervals (CIs) for the models
estimated (MacCallum, Browne, & Sugawara, 1996). Since the RM-
SEA is virtually independent of sample size, the comparison of
RMSEA CIs provides an effective, alternative method of assessing
relative model fit of nested models. As a measure of effect size for
mean differences, we report Cohen’s d (Cohen, 1988, p. 20). To
determine whether parameters of personality traits at T1 were
significantly different from those at T2 on the 5% level, we
calculated 95% inferential CIs (Tyron, 2001).
Results
Raw data were checked for departures from both univariate and
multivariate normality and, apart from the first and the third parcel
of Conscientiousness at T3, the skewness and kurtosis estimates of
the personality parcels did not exceed 1 or –1 (average skewness ϭ
–0.32; average kurtosis ϭ 0.52). The distribution of the first and
third parcel of Conscientiousness in 2006 was negatively skewed
(g1 ϭ –1.5, –1.2, respectively) and both exhibited inflated kurtosis
(g2 ϭ 4.5, 4.0, respectively). This was mainly due to 5 individual
participants who showed comparatively low scores in Conscien-
tiousness, and not to a distribution deviating in general from
normality. The normalized estimate of Mardia’s coefficient of
multivariate kurtosis was 0.92. Hence, with the limitation that the
distribution of two Conscientiousness parcels was inconsistent
with univariate normality, the multivariate distributional properties
of the 15 manifest personality trait variables warranted maximum
likelihood parameter estimation.
548 ALLEMAND, ZIMPRICH, AND MARTIN
5. Longitudinal MI
To examine MI of the NEO-FFI over time, we imposed different
degrees of MI by constraining parameters to be equal across
measurement occasions. The confirmatory factor analysis started
with an unconstrained model (Model LCM1) that specified the five
factors of personality without any constraints across measurement
occasions. In order to scale the latent variables, we fixed factor
variances to 1 and factor means to 0. As can be seen from Table 1,
Model LCM1 did achieve an acceptable fit as judged by the CFI
and RMSEA. Accordingly, configural invariance of the five-factor
model of personality appears to hold across the two measurement
occasions regarding 15 NEO-FFI item parcels. Next, for Model
LCM2, factor loadings were constrained to be equal across mea-
surement occasions, thus imposing weak MI. LCM2 also evinced
an acceptable fit, as can be seen from Table 1. With respect to
relative fit and the CFI and RMSEA, Model LCM2 represented the
data as well as the former model, while at the same time being
more parsimonious. Therefore, one might conclude that weak MI
holds across measurement occasions with respect to the five per-
sonality traits. Subsequently, in Model LCM3, the additional con-
straint of equal intercepts of the manifest indicators, implying
strong MI, was tested. Model LCM3 also achieved an acceptable
fit and in comparison to the preceding model, the chi-square
difference was not significant. The CFI and the RMSEA, however,
had improved. Hence, one might conjecture that strong MI holds.
In a final model (LCM4), strict MI was examined by constraining
residual variances of the item parcels to be equal across measure-
ment occasions. The resulting model still yielded an acceptable fit.
Further, compared to Model LCM3, Model LCM4 did not exhibit
a significant reduction in relative model fit. From this one might
conclude that the assumption of strict MI was tenable. Conse-
quently, we selected Model LCM4 (i.e., the model of strict MI in
personality traits) as adequately describing the associations among
the Big Five personality traits at both testing occasions. All sub-
sequent analyses were based on this reference model. Parameter
estimates based on the model of strict MI (Model LCM4) are
shown in Table 2.
To summarize, the tests of different degrees of MI revealed that
the measurement properties of the NEO-FFI parcels appear to be
longitudinally stable in the sense that the NEO-FFI measures the
same construct over time. Results showed that the criteria for strict
MI were met, implying that unique item variances of the manifest
indicators were constant across measurement occasions. Variance
changes are, thus, changes in true scores.
Longitudinal Structural Stability
To assess structural stability of the Big Five personality traits
over time, we constrained factor covariances to be equal across
measurement occasions. The resulting model (Model LCM5) still
yielded an acceptable fit (see Table 1). Compared to Model LCM4,
this model represented a statistically significant decrement as
judged from the chi-square difference. This implies that equal
factor covariances could not be assumed over the 12-year period
for older adults. To localize changes in structural stability, we
depict factor covariances between the five personality traits with
respect to both measurement occasions in Figure 1. Figure 1 is to
be read as follows: If the 95% inferential CI of a factor covariance
between, for example, Neuroticism and Extraversion, at T2 over-
laps with the 95% inferential CI of T1, factor covariances are not
significantly different at the 5% level. In turn, if the 95% inferen-
tial CI of a factor covariance at T3 does not overlap with the 95%
inferential CI of the factor covariance at T1, factor covariances
should be considered as being significantly different at the 5%
level. As can be seen from Figure 1, three significant differences
in factor covariances emerged. The factor covariance between
Extraversion and Conscientiousness at T3 was significantly higher
as compared to the covariance at T1 (0.520 vs. 0.776). In addition,
the covariance between Openness and Conscientiousness (0.291
vs. 0.681) and between Agreeableness and Conscientiousness
(0.383 vs. 0.679) increased significantly. To cross-check this find-
ing, we reestimated Model LCM5 with the three factor covariances
between Conscientiousness and Extraversion, Openness, and
Agreeableness at T3 being freely estimated. For this relaxed
model, 2
(387) ϭ 701.67, p Ͻ .05, CFI ϭ 0.928, RMSEA ϭ
0.052. Compared to the reference Model (LCM4), fit was statisti-
cally indistinguishable, ⌬2
(7) ϭ 10.62, p Ͼ .15.
Taken together, the findings revealed that covariances among at
least four of the Big Five were not similar across measurement
occasions, implying variant covariation patterns of Conscientious-
ness with Extraversion, Openness, and Agreeableness over time.
Table 1
Fit Indices for Latent Change Models
Model 2
df CFI RMSEA RMSEA 90% CI ⌬2
⌬df ⌬LCM
LCM1 644.45ء
345 0.931 0.054 0.046, 0.060
LCM2 661.83ء
355 0.929 0.054 0.047, 0.060 17.38ء
10 2–1
LCM3 668.06ء
365 0.930 0.053 0.044, 0.059 6.23ء
10 3–2
LCM4 691.05ء
380 0.929 0.052 0.046, 0.058 22.99ء
15 4–3
LCM5 718.25ء
390 0.924 0.053 0.047, 0.059 27.20ء
10 5–4
LCM6 705.13ء
385 0.926 0.053 0.046, 0.059 16.61ء
5 6–4
LCM7 746.82ء
385 0.917 0.056 0.050, 0.062 55.77ء
5 7–4
LCM8 733.64ء
390 0.921 0.054 0.048, 0.060 42.59ء
10 8–4
Note. N ϭ 300. CFI ϭ comparative fit index; RMSEA ϭ root-mean-square error of approximation; CI ϭ confidence interval; ⌬LCM ϭ comparison of
latent change models; LCM1 ϭ unconstrained model; LCM2 ϭ model of weak measurement invariance (MI); LCM3 ϭ model of strong MI; LCM4 ϭ model
of strict MI; LCM5 ϭ model of strict MI and equal factor variances across time; LCM6 ϭ model of strict MI and equal factor covariances across time;
LCM7 ϭ model of strict MI and equal factor means across time; LCM8 ϭ stationarity model (i.e., equal latent level factor and latent change factor
correlations).
ء
p Ͻ .01.
549LONG-TERM CORRELATED CHANGE IN PERSONALITY TRAITS
6. Differential Stability
To assess differential stability of the Big Five personality traits,
we estimated factor test–retest correlations based on Model LCM4.
Neuroticism (.762), Extraversion (.830), and Openness to Experi-
ence (.686) showed rather strong differential stability, whereas
Conscientiousness (.612) and, especially, Agreeableness (.506)
appeared to be less stable over a 12-year period in older adults. The
mean differential stability index across all personality traits was
calculated using the Fisher’s r-to-z transformation approach, re-
sulting in r ϭ .696. These findings imply that individual differ-
ences in change of personality traits exist, because differential
stability was far less than perfect. In order to test for stability more
rigorously, we constrained the respective factor stability coeffi-
cients to unity. For this more constrained model, 2
(385) ϭ
1239.34, p Ͻ .05, CFI ϭ 0.803, RMSEA ϭ 0.086. Compared to
the reference Model (LCM4), fit had decreased significantly,
⌬2
(5) ϭ 548.29, p Ͻ .05. In sum, then, there were some pro-
nounced shifts of rank-order in the five personality factors.
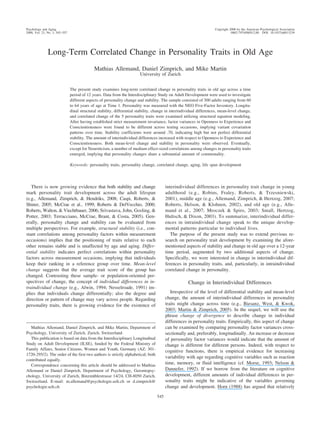
Change in Interindividual Differences
To examine change of divergence, we constrained factor vari-
ances to be equal across measurement occasions. Although the fit
of the tested model (Model LCM6) was acceptable, compared to
the reference model (Model LCM4), the model yielded a signifi-
cant loss in relative and absolute fit (see Table 1), implying change
of divergence across the 12-year period in older adults. To locate
the longitudinal differences more precisely, we present factor
variances and the 95% inferential CIs for both measurement oc-
casions in Figure 2. As can be seen from Figure 2, the 95%
inferential CI of the Openness to Experience variance at T2 did not
overlap with the 95% inferential CI of the variance at T1. This
implies that older adults became more heterogeneous with respect
Table 2
Parameter Estimates of Model LCM4 (Strict Measurement
Invariance)
Parcel
Factor
loading
Latent
intercept R2
Time 1 R2
Time 2
NEURO1 2.052 10.42 0.550 0.551
NEURO2 1.860 9.94 0.497 0.498
NEURO3 2.079 9.59 0.627 0.627
EXTRA1 1.304 12.08 0.336 0.479
EXTRA2 1.654 12.74 0.510 0.557
EXTRA3 2.101 13.51 0.631 0.674
OPEN1 1.913 12.39 0.553 0.623
OPEN2 1.935 13.90 0.588 0.656
OPEN3 1.621 14.11 0.496 0.568
AGRE1 1.829 14.31 0.665 0.668
AGRE2 1.667 13.24 0.574 0.578
AGRE3 1.731 15.36 0.677 0.681
CONS1 1.588 15.38 0.418 0.504
CONS2 1.674 14.61 0.448 0.535
CONS3 1.520 16.39 0.582 0.663
Note. Factor loadings are unstandardized. NEURO1 to NEURO3 ϭ
parcels of neuroticism; EXTRA1 to EXTRA3 ϭ parcels of extraversion;
OPEN1 to OPEN3 ϭ parcels of openness; AGRE1 to AGRE3 ϭ parcels of
agreeableness; CONS1 to CONS3 ϭ parcels of conscientiousness.
Figure 1. Factor covariances among personality factors at both measurement occasions. Estimates are based
on Model LCM4 (strict measurement invariance). Error bars reflect the 95% inferential confidence interval (CIs).
N ϭ Neuroticism; E ϭ Extraversion; O ϭ Openness to Experience; A ϭ Agreeableness; C ϭ Conscientiousness.
550 ALLEMAND, ZIMPRICH, AND MARTIN
7. to Openness. Similarly, the amount of interindividual differences
in Conscientiousness increased over time. The remaining Big Five
personality traits (i.e., Neuroticism, Extraversion, and Agreeable-
ness) did not show significant changes in terms of factor variances.
In order to cross-check this finding, we again reestimated Model
LCM6 with the Openness and Conscientiousness factor variances
at the second testing occasion being free parameters, 2
(383) ϭ
693.87, p Ͻ .05, CFI ϭ 0.928, RMSEA ϭ 0.052. Compared to the
reference Model (LCM4), there was no statistically significant
difference in fit, ⌬2
(3) ϭ 2.84, p Ͼ .41.
To summarize, the findings revealed significant change of di-
versity with respect to Openness to Experience and Conscientious-
ness. In other words, compared to T1, the sample showed a
significantly higher amount of interindividual differences in the
two personality traits 12 years after the T1.
Mean-Level Change
To test for mean-level change in the Big Five personality traits
over time, we constrained factor means to be equal across the
measurement occasions. Although Model LCM7 still yielded an
acceptable fit (see Table 1), it exhibited a statistically and substan-
tively significant decrement in fit as compared to the reference
model. This implies that the assumption of equal factor means
across time was not tenable for older adults. Figure 3 shows the
mean-level changes in factor means for each of the Big Five
personality. As can be seen from Figure 3, participants became, on
average, significantly less neurotic and less extraverted as they
passed from later midlife into old age. These age-related mean-
level changes reflected small (Neuroticism) to medium (Extraver-
sion) effects sizes. To cross-check this result, we estimated Model
LCM7 again, this time with the factor means of Neuroticism and
Extraversion at T3 being freely estimated, 2
(383) ϭ 695.95, p Ͻ
.05, CFI ϭ 0.928, RMSEA ϭ 0.052. Importantly, the difference in
fit compared to Model LCM4 was no longer statistically signifi-
cant, ⌬2
(3) ϭ 4.90, p Ͼ .17. Thus, we may conclude that across
the 12-year period, Neuroticism, on average, decreased slightly,
while Extraversion, on average, decreased more substantially.
Correlated Change
To examine specific versus general changes in the Big Five
personality traits, we utilized latent change models. The analysis
started with a latent change model that specified the latent initial
level and latent change factors over the 12-year period for each of
the NEO-FFI personality traits. All latent initial and change factors
were allowed to covary. The overall fit of the model exactly
mirrored the fit of Model LCM4 (see Table 1). The statistically
significant latent change variances (⌬Var) of the Big Five person-
ality for older adults were as follows: Neuroticism: ⌬Var ϭ .478,
Extraversion: ⌬Var ϭ .383, Openness to Experience: ⌬Var ϭ
.751, Agreeableness: ⌬Var ϭ .996, and Conscientiousness:
⌬Var ϭ .959. This implies, that in Agreeableness, Conscientious-
ness, and Openness to Experience interindividual differences in
intraindividual change were most pronounced.
Subsequently, covariances among the latent change-scores of
the NEO-FFI were estimated. Table 3 reports three kinds of latent
correlations. First, the correlations between the initial levels of the
Figure 2. Variances of personality factors at both measurement occasions. Factor variances at T1 are scaled
to unity. Estimates are based on Model LCM4 (strict measurement invariance). Error bars reflect the 95%
inferential confidence interval (CIs).
551LONG-TERM CORRELATED CHANGE IN PERSONALITY TRAITS
8. Big Five factors are shown in the upper-left partition of the
correlation matrix. The findings revealed that Neuroticism was
negatively related to all other personality traits, with the highest
correlation emerging between Neuroticism and Extraversion (r ϭ
–.458), and effect sizes being in the medium to large range (rs; cf.
Cohen, 1988). Thus, participants who were less neurotic were, on
average, more extraverted, more open to experience, more agree-
able, and more conscientious. Extraversion was also significantly
related to all other personality traits ranging from r ϭ .520 with
Conscientiousness to r ϭ .419 with Agreeableness, thus represent-
ing large effect sizes. Accordingly, participants who were more
extraverted were less neurotic and more open to experience, agree-
able, and conscientious.
Second, the correlations between initial levels and changes for
the Big Five personality factors are summarized in the lower-left
partition (see Table 3)2
and show that, with few exceptions,
level-change correlations were negative. These correlations imply
that participants with higher initial scores, for example in Extra-
version, tended to show less pronounced changes over time. Effect
sizes were in the small to large range. Additionally, several across-
domain level-change correlations were found (see Table 3). Initial
Neuroticism was significantly related to change in Agreeableness,
indicating that participants with higher baseline scores in Neurot-
icism were more likely to decrease in Agreeableness. Extraversion
at T1 was correlated with changes in Openness to Experience and
Agreeableness. Moreover, participants with higher baseline scores
in Agreeableness tended to show a slightly less pronounced change
in Extraversion, Openness to Experience, and Conscientiousness.
Finally, a cross-domain correlation was found for Conscientious-
ness and change in Agreeableness.
Third, correlations between the latent change scores of the five
personality factors, which refer to the aspect of specific versus
general change, are summarized in the lower-right partition of the
correlation matrix (see Table 3). For example, changes in Extra-
version were significantly and positively related to Openness to
Experience, Agreeableness, and Conscientiousness, with effect
sizes being in the large range. The findings imply that participants
who exhibited higher latent change scores in Extraversion tended
to become more open, agreeable, and conscientious. Furthermore,
participants produced substantial latent change scores correlations
between Conscientiousness and Extraversion, Openness to Expe-
rience, and Agreeableness. The effect sizes for the change corre-
lations were in the large range. Interestingly, changes in Neuroti-
cism were unrelated to the other Big Five personality change
scores (see Table 3), indicating that participants with an increase in
Neuroticism did not show related changes in other personality
traits.
To summarize, the present data provide evidence for interindi-
vidual differences in intraindividual change in all Big Five per-
sonality traits in older adults across a 12-year time period. With
respect to the personality traits examined, interindividual differ-
2
It should be noted that estimating correlations between level and
change scores is difficult in a study with two measurement occasions (cf.
Raudenbush & Bryk, 2002, p. 166).
Figure 3. Means of personality factors at both measurement occasions. The initial measurement occasion was
used as a reference, having factor means of zero, that is, factor means at the second measurement occasion reflect
deviations from the reference. Factor means were scaled as Cohen’s ds. Estimates are based on Model LCM4
(strict measurement invariance). Error bars reflect the 95% inferential confidence interval (CIs).
552 ALLEMAND, ZIMPRICH, AND MARTIN
9. ences in initial level were negatively correlated with the amount of
individual change. Furthermore, several across-domain level-
change correlations were found. Finally, a number of statistically
significant latent change correlations among personality traits
emerged, except for Neuroticism. Together, these findings indicate
that personality trait change across the 12-year time period seems
to occur in a concerted manner.3
To test for the equality of level factor and change factor corre-
lations (intercorrelations stationarity), we constrained level corre-
lations in Model LCM8 to equal their according slope correlations
(e.g., the correlation between Neuroticism [N] and Extraversion
[E] equals the correlation between ⌬N and ⌬E). As can be seen
from Table 1, Model LCM8 did achieve an adequate model fit,
which, however, represented a statistically significant loss in fit
compared to Model LCM4, indicating that not all level intercor-
relations were equal to their respective change correlations. Accord-
ing to Figure 4, there were four statistically significant differences
between level factor and change factor correlations: Neuroticism and
Extraversion, Neuroticism and Openness, Neuroticism and Agree-
ableness, and Agreeableness and Conscientiousness. While with
respect to Neuroticism, the change factor correlations were smaller
than their level factor counterparts; for Agreeableness and Con-
scientiousness, the change factor correlation was stronger than
their level factor correlation. Taking this significant difference and
the general picture of correlations into account, it appears as if
Neuroticism disassociates from the other four personality factors,
while these move together.4
In order to cross-check the finding of
four statistically level factor and change factor correlations, we
reestimated Model LCM8 with the Neuroticism and Extraver-
sion, Neuroticism and Openness, Neuroticism and Agreeable-
ness, and Agreeableness and Conscientiousness correlations
being unconstrained, 2
(386) ϭ 700.88, p Ͻ .05, CFI ϭ 0.928,
RMSEA ϭ 0.052, which compared to the reference model
(LCM4) did not represent a statistically significant difference,
⌬2
(6) ϭ 9.83, p Ͼ .13. Thus, we may conclude that apart from
the aforementioned correlations, there was stationarity regard-
ing level and slope correlations.
Discussion
The aim of the present article was to extend previous research
on personality trait development in old age by investigating struc-
tural stability, differential stability, and mean-level change over an
approximately 12-year time period. In addition, change in interin-
dividual differences and intraindividual correlated change were
examined.
We started our analyses with an emphasis on the measurement
properties of the NEO-FFI parcels, which were subjected to a
series of increasingly rigorous tests of the comparability of their
scores over time. We found that the criteria for strict MI were met
across the 12-year follow-up period (cf. Meredith, 1993). Hence,
comparisons of factor (co)variances and means were deemed in-
terpretable as reflecting quantitative shifts in invariant measures.
Our inferences about MI are tempered, however, by the fact that
we were not able to evaluate invariance across intact personality
facet scales (i.e., the NEO Personality Inventory—Revised; Costa
& McCrae, 1992), which are nonexistent in the NEO-FFI (but see
Chapman, 2007; Saucier, 1998). By using parcels as an alternative
of item-level modeling, we specified a less complex measurement
model due to fact that the number of manifest variables entering
the analyses was reduced considerably. This fact probably contrib-
uted to the feasibility of finding strict MI. At the same time, the
distributional properties of the parcel warranted the use of maxi-
3
Upon the suggestion of an anonymous reviewer, we reestimated
change correlations using linear latent growth models and data from all
three measurement occasions, that is, including T2. Results regarding
change correlations were virtually the same, which, in light of the fact that
the T2 data receive only one ninth of the weighting of that of the T3 data
with respect to slope variances and covariances, is what one would have
expected.
4
An anonymous reviewer suggested that the correlational patterns
among personality traits at T1 and, in particular, among the personality trait
changes across 12 years might suggest a second-order factor model. We
tested such a model with Extraversion, Openness, Agreeableness, and
Conscientiousness at T1 loading on one common factor and Extraversion,
Openness, Agreeableness, and Conscientiousness changes loading on a
second common factor. This model did achieve an almost adequate fit as
judged by the standalone fit indices, 2
(411) ϭ 834.58, CFI ϭ .903,
RMSEA ϭ 0.059, 90% CI ϭ 0.053, 0.064. However, compared to LCM4,
it represented a pronounced loss in fit, ⌬2
(31) ϭ 143.53, p Ͻ .01. Upon
inspection, the loss in model fit was mainly due to the fact that second-
order factors did not adequately capture the T1 change correlations of the
personality traits.
Table 3
Personality Factor and Change Factor Correlations
Variable 1 2 3 4 5 6 7 8 9 10
1. Neuroticism —
2. Extraversion Ϫ.458 —
3. Openness Ϫ.262 Ϫ.482 —
4. Agreeableness Ϫ.263 Ϫ.419 Ϫ.240 —
5. Conscientiousness Ϫ.299 Ϫ.520 Ϫ.291 Ϫ.383 —
6. ⌬Neuroticsim Ϫ.343 Ϫ.064 Ϫ.097 Ϫ.018 Ϫ.050 —
7. ⌬Extraversion Ϫ.019 Ϫ.144 Ϫ.002 Ϫ.198 Ϫ.112 Ϫ.133 —
8. ⌬Openness Ϫ.001 Ϫ.134 Ϫ.240 Ϫ.154 Ϫ.126 Ϫ.030 Ϫ.554 —
9. ⌬Agreeableness Ϫ.137 Ϫ.168 Ϫ.051 Ϫ.491 Ϫ.189 Ϫ.001 Ϫ.435 Ϫ.410 —
10. ⌬Conscientiousness Ϫ.041 Ϫ.075 Ϫ.089 Ϫ.190 Ϫ.278 Ϫ.141 Ϫ.658 Ϫ.486 Ϫ.686 —
Note. N ϭ 300. Correlations in italics are not statistically significant at p Ͻ .05. Correlation estimates are based on Model LCM4 (strict measurement
invariance).
553LONG-TERM CORRELATED CHANGE IN PERSONALITY TRAITS
10. mum likelihood parameter estimation, whereas directly factoring
individual items would have required multiple-groups factor anal-
ysis of ordered-categorical data (Yun-Tein & Millsap, 2004).
Next, structural stability was investigated. Our data suggested
that the relations among the five personality traits are subject to
change over time. Specifically, the pattern of covariation between
Conscientiousness and three other traits (i.e., Extraversion, Open-
ness to Experience, and Agreeableness) showed an increase at T2,
indicating that the relative significance of Conscientiousness with
respect to these three other personality traits seemed to become
stronger over time. This finding contrasts with other studies, where
the interrelations among the five personality traits across age have
been reported to be highly stable both cross-sectionally and lon-
gitudinally (e.g., Allemand et al., 2007; Costa & McCrae, 1997;
Small et al., 2003; Srivastava et al., 2003). However, in the
majority of studies investigating structural stability in personality
traits in old age, the longitudinal time span was shorter than in our
study, where it was long enough to capture structural changes of
personality.
The present finding of structural change implies that personality
might become less differentiated or, in turn, more dedifferentiated
over time in old age. A similar finding concerning the development
of the structure of traits in adolescents, yet in the opposite direc-
tion, has been reported by Allik, Laidra, Realo, and Pullmann
(2004). In a large cross-sectional sample of 12- to 18-year-olds,
they found that self-reported personality trait structure matures and
becomes sufficiently differentiated around age 14–15 and grows to
be practically indistinguishable from adult personality by the age
of 15. The most striking age difference was found for the corre-
lation between Agreeableness and Conscientiousness, which de-
creased with age from .49 to .18. Together with our results, this
suggests a lifespan pattern of differentiation of personality into
adulthood, followed by a dedifferentiation into old age (Baltes et
al., 1980).
Regarding the associations within factors, but across occasions,
mean differential stability of .70 over 12 years in old age appears
high; however, it leaves room for individual change. Generally, the
present data closely correspond to the longitudinal stability coef-
ficients reported in previous longitudinal aging studies (Mroczek
& Spiro, 2003; Roberts & DelVechio, 2000; Small et al., 2003).
Recently, Terracciano, Costa, and McCrae (2006) reported differ-
ential stability of the Big Five personality traits for adults older
than 65 across an average time interval of approximately 10 years.
In our study, Openness to Experience, Agreeableness, and Con-
scientiousness had lower stabilities than reported by Terracciano
and colleagues (2006). These attenuated stability coefficients may
have three potential sources: First, personality traits appear to be
less stable when assessed with the shorter and less precise NEO-
FFI test form (Costa & McCrae, 1992). Terracciano et al. (2006)
and other researchers (e.g., Costa, Herbst, McCrae, & Siegler,
2000), for example, reported lower stability coefficients with re-
spect to specific traits or facets of the five factors. Second, our
participants were slightly younger and more homogeneous with
respect to age (60–64 years at T1) than Terracciano et al.’s (2006)
oldest age group (66–89 at T1), which might have attenuated
stabilities. Eventually, the relatively lower differential stability of
the personality traits in our study might be explained, in part, by
the transition phase from young–old age into old–old age occur-
Figure 4. Level and change factor correlations. Estimates are based on Model LCM4 (strict measurement
invariance). Error bars reflect the 95% inferential confidence interval (CIs). N ϭ Neuroticism; E ϭ Extraversion;
O ϭ Openness to Experience; A ϭ Agreeableness; C ϭ Conscientiousness.
554 ALLEMAND, ZIMPRICH, AND MARTIN
11. ring during the longitudinal follow-up. That is, one might expect
that transitional phases in life and the way different individuals
deal with them should decrease the stability estimates of person-
ality.
An oftentimes neglected aspect of change is change of diver-
gence, which refers to increasing or decreasing individual differ-
ences over time. Although change of divergence is preferably
examined longitudinally, sample selectivity could systematically
affect variances, which may be one reason for a neglect of inves-
tigating variance changes in developmental personality research.
Another reason probably is that existent theories on personality
development do not touch the issue of variance changes directly,
which makes it difficult to deduce hypotheses. Our results indicate
increases in individual differences in Openness to Experience and
Conscientiousness revealed a statistically significant increase,
amounting to about 29% and 34%, respectively. Hence, 12 years
after the T1 the sample had become more heterogeneous with
respect to these two personality traits.
For individuals, this necessarily implies that they develop dif-
ferentially, giving rise to the so-called fan-spread phenomenon
(e.g., McArdle, 1988). Elsewhere, developmental psychologists
have argued that age-graded influences including biological and
environmental aspects (e.g., developmental tasks) that may shape
development in relatively normative ways should lead to relatively
homogeneous trajectories. By contrast, nonnormative events that
impact only some individuals may result in increased heterogene-
ity (Baltes et al., 1980). In light of such a view of development,
one might interpret the increasing variances in Openness and
Conscientiousness as reflecting the impact of nonnormative events
more strongly than the other traits. The increasing Openness and
Conscientiousness variances across time also show that chrono-
logical age becomes an increasingly inaccurate indicator of these
personality traits.
Regarding mean-level changes across time, we found statisti-
cally significant decreases in Neuroticism and Extraversion, im-
plying that older adults become, on average, less neurotic and less
extraverted as they move from young–old age into old–old age. In
terms of effect size, these effects were small (Neuroticism) and
medium (Extraversion). Other researchers have reported similar
findings (e.g., Mroczek & Spiro, 2003; Roberts, Robins, Caspi, &
Trzesniewski, 2003, Roberts et al., 2006; Small et al., 2003;
Terracciano et al., 2005). Of particular interest regarding Extra-
version is that it has been suggested that people disengage or
withdraw from society as they grow older (Achenbaum & Bengt-
son, 1994; Cumming & Henry, 1961). Further, Openness to Ex-
perience tended to decrease in old age, which is consistent with
most other findings (e.g., Field & Millsap, 1991; Roberts et al.,
2006; Small et al., 2003; Terracciano et al., 2005). This might
reflect, in part, the increasing influence of social or interpersonal
factors, such as the more constricted life space or greater socio-
emotional selectivity (cf. Carstensen, Mikels, & Mather, 2006).
Our findings regarding Agreeableness and Conscientiousness
appear to be in contrast with meta-analytic findings. Roberts et al.
(2006) reported continuing longitudinal increases in Agreeable-
ness and Conscientiousness in adulthood, but there is little infor-
mation on the developmental pattern of those personality traits in
old samples. A cross-sectional study of patients aged 65 to 100
found evidence for higher levels of Agreeableness among older
individuals (Weiss et al., 2005), and a longitudinal study reported
increases in Agreeableness in old age (Terracciano et al., 2005).
By contrast, in the study by Small et al. (2003), neither initial level
of Agreeableness or Conscientiousness nor change across 6 years
was related to age. This discrepancy between others’ results and
our results are not easily explained but might, in part, be due to the
fact that effect sizes of age differences in personality and age
changes in personality are typically in the small to medium range,
which might lead to more fluctuations in terms of significant or
nonsignificant mean changes from study to study. Another possi-
ble explanation is that there may be cultural differences between
our German sample and the North American samples used in other
studies (cf. McCrae & Costa, 2006).
Long-Term Correlated Change in Personality Traits
Up to the present, personality trait development researchers
have neglected the aspect of whether changes in the Big Five
personality factors are correlated. By utilizing latent change mod-
els (e.g., Hertzog & Nesselroade, 2003; McArdle & Nesselroade,
1994), we found, first, substantial initial factor intercorrelations for
the personality traits. Second, the within-domain level-change
relations indicate that initial levels of personality traits are nega-
tively related to change in personality traits. This implies that
people with high T1 scores, especially on Neuroticism and Agree-
ableness, tend to show less pronounced changes over time. Moreover,
we observed some small across-domain level-change correlations,
which suggest that people with high initial level on Agreeableness
tend to show less pronounced changes over time with respect to
Extraversion, Openness, and Conscientiousness. Finally, a number
of statistically significant and large latent change correlations
emerged among Extraversion, Openness to Experience, Agree-
ableness, and Conscientiousness, reflecting the fact that individual
change in one personality trait was accompanied by a tendency of
proportional individual changes in other personality traits. Inter-
estingly, change in Neuroticism, which reflects an individual’s
emotional reactivity, tendency to worry, and also susceptibility to
negative mood, was not significantly related to change in the
remaining four Big Five traits. This finding might imply that
Neuroticism did not codevelop with the other traits from young–
old age into old–old age.
In an attempt to rigorously compare cross-sectional and longi-
tudinal correlations among personality factors, we estimated an
intercorrelations stationarity model. From this model we con-
cluded that changes in Neuroticism were significantly less strongly
related to Extraversion, Openness, and Agreeableness than their
cross-sectional counterparts. This result, again, indicated that the
development of Neuroticism appeared to uncouple from the men-
tioned traits. In turn, Agreeableness and Conscientiousness seemed
to coalesce longitudinally. We think that this result could be taken
as an indication that, longitudinally, personality might be regarded
as a fabric of dynamically interwoven traits.
The overall pattern suggests that four personality traits appear to
dedifferentiate somewhat. By contrast, we found some indications
of a differentiation of Neuroticism from the other personality
factors. This pattern suggests multiple causes for personality
change in old age. Causes could be homogeneous with respect to
the latter four personality traits, such as similar environmental
influences or similar reactivity to environmental contingencies,
and be heterogeneous with respect to Neuroticism, such as Neu-
555LONG-TERM CORRELATED CHANGE IN PERSONALITY TRAITS
12. roticism being influenced by changes in individual health status
(e.g., Caspi & Roberts, 2001; Smith & Spiro, 2002). This finding
may also reflect the result of a survival effect, with those having
higher Neuroticism being less likely to survive into older age, thus
uncoupling the relation between Neuroticism and the remaining
Big Five personality traits. Although this remains speculative at
this point, it discloses the need of revisiting the correlated person-
ality trait development in old age from both an empirical and a
theoretical perspective. Not only is the question whether person-
ality remains stable or change as people age—our results confirm
that personality traits are, in fact, plastic—but how and why
stability and changes in personality trait development are related.
To conclude, we have shown that individual differences in
personality may become more pronounced with age. Furthermore,
we have demonstrated that, regarding their commonality, person-
ality changes operate on an intermediate level: They are neither
completely specific or isolated, nor are they totally general or
shared. Traditional conceptualizations of personality tended to
emphasize the stability of personality traits after the age of 30 (e.g.,
Costa & McCrae, 1994), which may explain why theoretical
accounts of personality are only beginning to emerge (e.g., Baltes,
Lindenberger, & Staudinger, 2006; Mroczek & Little, 2006; Rob-
erts, Wood, & Caspi, in press). From our perspective, the results
presented herein exemplify the need for a theoretical understand-
ing of the dynamics of personality change in old age.
References
Achenbaum, W. A., & Bengtson, V. L. (1994). Re-engaging the disen-
gagement theory of aging: On the history and assessment of theory
development in gerontology. The Gerontologist, 34, 756–763.
Allemand, M., Zimprich, D., & Hendriks, A. A. J. (2008). Age differences
in five personality domains across the life span. Developmental Psychol-
ogy, 44, 758–770.
Allemand, M., Zimprich, D., & Hertzog, C. (2007). Cross-sectional age
differences and longitudinal age changes of personality in middle adult-
hood and old age. Journal of Personality, 75, 323–358.
Allik, J., Laidra, K., Realo, A., & Pullmann, H. (2004). Personality devel-
opment from 12 to 18 years of age: Changes in mean-levels and structure
of traits. European Journal of Personality, 18, 445–462.
Alwin, D. F. (1994). Aging, personality, and social change: The stability of
individual differences over the adult life span. In D. L. Featherman,
R. M. Lerner, & M. Perlmutter (Eds.), Lifespan development and be-
havior (Vol. 12, pp. 135–185). Hillsdale, NJ: Erlbaum.
Baltes, P. B., Cornelius, S. W., Spiro, A., Nesselroade, J. R., & Willis, S.
(1980). Integration versus differentiation of fluid/crystallized intelli-
gence in old age. Developmental Psychology, 16, 625–635.
Baltes, P. B., Lindenberger, U., & Staudinger, U. M. (2006). Lifespan
theory in developmental psychology. In R. M. Lerner (Ed.), Handbook
of child psychology (Vol. 1, 6th ed., pp. 569–664). New York: Wiley.
Bandalos, D. L., & Finney, S. J. (2001). Item parceling issues in structural
equation modeling. In G. A. Marcoulides & R. E. Schumacker (Eds.),
New developments and techniques in structural equation modeling (pp.
269–296). Mahwah, NJ: Erlbaum.
Biesanz, J. C., West, S. G., & Kwok, O.-M. (2003). Personality over time:
Methodological approaches to the study of short-term and long-term
development and change. Journal of Personality, 71, 905–941.
Bontempo, D. E., & Hofer, S. M. (2006). Assessing factorial invariance in
cross-sectional and longitudinal studies. In A. D. Ong & M. van Dulmen
(Eds.), Handbook of methods in positive psychology (pp. 153–175). New
York: Oxford University Press.
Borkenau, P., & Ostendorf, F. (1993). NEO-Fu¨nf-Faktoren Inventar (NEO-
FFI) nach Costa und McCrae. Handanweisung [NEO Five-Factor Inven-
tory (NEO-FFI) according to Costa and McCrae. Manual.]. Go¨ttingen,
Germany: Hogrefe.
Browne, M. W., & Cudeck, R. (1993). Alternative ways of model fit. In
K. A. Bollen & J. S. Long (Eds.), Testing structural equation models
(pp. 136–162). Newbury Park, CA: Sage.
Carstensen, L. L., Mikels, J. A., & Mather, M. (2006). Aging and the
intersection of cognition, motivation, and emotion. In J. E. Birren &
K. W. Schaie (Eds.), Handbook of the psychology of aging (6th ed., pp.
343–362). Amsterdam: Elsevier.
Caspi, A., & Roberts, B. W. (2001). Personality development across the
life course: The argument for change and continuity. Psychological
Inquiry, 12, 49–66.
Caspi, A., Roberts, B. W., & Shiner, R. L. (2005). Personality develop-
ment: Stability and change. Annual Review of Psychology, 56, 453–484.
Chapman, B. P. (2007). Bandwidth and fidelity on the NEO-Five Factor
Inventory: Replicability and reliability of Saucier’s (1998) item cluster
subcomponents. Journal of Personality Assessment, 88, 220–234.
Cohen, J. (1988). Statistical power analysis for the behavioral sciences
(2nd ed.). Hillsdale, NJ: Erlbaum.
Costa, P. T., Jr., Herbst, J. H., McCrae, R. R., & Siegler, I. C. (2000).
Personality at midlife: Stability, intrinsic motivation, and responses to
life events. Assessment, 7, 365–378.
Costa, P. T., Jr., & McCrae, R. R. (1992). Professional manual: Revised
NEO Personality Inventory (NEO-PI-R) and NEO Five-Factor Inven-
tory (NEO-FFI). Odessa, FL: Psychological Assessment Resources.
Costa, P. T., Jr., & McCrae, R. R. (1994). Set like plaster? Evidence for the
stability of the adult personality. In T. F. Heatherton & J. L. Weinberger
(Eds.), Can personality change? (pp. 21–40). Washington, DC: Amer-
ican Psychological Association.
Costa, P. T., Jr., & McCrae, R. R. (1997). Longitudinal stability of adult
personality. In R. Hogan, J. Johnson, & S. Briggs (Eds.), Handbook of
personality psychology (pp. 269–290). San Diego, CA: Academic Press.
Cumming, E., & Henry, W. E. (1961). Growing old. New York: Basic
Books.
Field, D., & Millsap, R. E. (1991). Personality in advanced old age:
Continuity or change? Journals of Gerontology, Series B: Psychological
Sciences, 46, P299–P308.
Hertzog, C., & Nesselroade, J. R. (2003). Assessing psychological change
in adulthood: An overview of methodological issues. Psychology and
Aging, 18, 639–657.
Hofer, S. M., Flaherty, B. P., & Hoffman, L. (2006). Cross-sectional
analysis of time-dependent data: Problems of mean-induced association
in age-heterogeneous samples and an alternative method based on se-
quential narrow age-cohorts. Multivariate Behavioral Research, 41,
165–187.
Horn, J. L. (1988). Thinking about human abilities. In J. R., Nesselroade &
R. B. Cattell (Eds.), Handbook of multivariate experimental psychology
(2nd ed., pp. 645–685). New York: Plenum Press.
Horn, J. L., & McArdle, J. J. (1992). A practical and theoretical guide to
measurement invariance in aging research. Experimental Aging Re-
search, 18, 117–144.
Hu, L., & Bentler, P. M. (1999). Cutoff criteria for fit indexes in covariance
structure analysis: Conventional criteria versus new alternatives. Struc-
tural Equation Modeling, 6, 1–55.
Johnson, W., McGue, M., & Krueger, R. F. (2005). Personality stability in
late adulthood: A behavioral genetic analysis. Journal of Personality, 73,
523–551.
Little, R. J. A., & Rubin, D. B. (1987). Statistical analysis with missing
data. New York: Wiley.
Little, T. D., Cunningham, W. A., Shahar, G., & Widaman, K. F. (2002).
To parcel or not to parcel: Exploring the question, weighing the merits.
Structural Equation Modeling, 9, 151–173.
MacCallum, R., Browne, M., & Sugawara, H. M. (1996). Power analysis
556 ALLEMAND, ZIMPRICH, AND MARTIN
13. and determination of sample size for covariance structure modeling.
Psychological Methods, 2, 130–149.
Martin, M., Gru¨nendahl, M., & Martin, P. (2001). Age differences in stress,
social resources and well-being in middle and older age. Journals of
Gerontology, Series B: Psychological Sciences, 56, P214–P222.
Martin, M., & Zimprich, D. (2005). Cognitive development in midlife. In
S. L. Willis & M. Martin (Eds.), Middle adulthood: A lifespan perspec-
tive (pp. 179–206). Thousand Oaks, CA: Sage.
McArdle, J. J. (1988). Dynamic but structural equation modeling of re-
peated measures data. In R. B. Cattell & J. Nesselroade (Eds.), Hand-
book of multivariate experimental psychology (2nd ed., pp. 561–614).
New York: Plenum Press.
McArdle, J. J., & Nesselroade, J. R. (1994). Using multivariate data to
structure developmental change. In H. W. Reese & S. H. Cohen (Eds.),
Lifespan developmental psychology: Methodological contributions (pp.
223–267). Hillsdale, NJ: Erlbaum.
McCrae, R. R., & Costa, P. T., Jr. (2006). Cross-cultural perspectives on
adult personality trait development. In D. K. Mroczek & T. D. Little
(Eds.), Handbook of personality development (p. 129–145). Mahwah,
NJ: Erlbaum.
McCrae, R. R., Costa, P. T., Jr., de Lima, M. P., Simones, A., Ostendorf,
F., Angleitner, A., et al. (1999). Age differences in personality across the
adult life: Parallels in five cultures. Developmental Psychology, 35,
466–477.
Meredith, W. (1993). Measurement invariance, factor analysis, and facto-
rial invariance. Psychometrika, 58, 525–543.
Meredith, W., & Horn, J. L. (2001). The role of measurement invariance in
modeling growth and change. In L. M. Collins & A. G. Sayer (Eds.),
New methods for the analysis of change (pp. 203–240). Washington DC:
American Psychological Association.
Morse, C. K. (1993). Does variability increase with age? An archival study
on cognitive measures. Psychology and Aging, 8, 146–154.
Mroczek, D. K., & Little, T. D. (2006). Handbook of personality develop-
ment. Mahwah, NJ: Erlbaum.
Mroczek, D. K., & Spiro, A., III. (2003). Modeling intraindividual change
in personality traits: Findings from the normative aging study. Journals
of Gerontology, Series B: Psychological Sciences, 58, P153–P165.
Neale, M. C., Boker, S. M., Xie, G., & Maes, H. H. (2003). Mx: Statistical
modeling (6th ed.). Richmond, VA: Virginia Commonwealth University,
Department of Psychiatry.
Nelson, A. E., & Dannefer, D. (1992). Aged heterogeneity: Fact or fiction?
The fate of diversity in gerontological research. The Gerontologist, 32,
17–23.
Nesselroade, J. R. (1991). Interindividual differences in intraindividual
change. In L. M. Collins & J. L. Horn (Eds.), Best methods for the
analysis of change (pp. 92–105). Washington, DC: American Psycho-
logical Association.
Raudenbush, S. W., & Bryk, A. S. (2002). Hierarchical linear models:
Applications and data analysis methods. Thousand Oaks, CA: Sage.
Roberts, B. W., & Caspi, A. (2003). The cumulative continuity model of
personality development: Striking a balance between continuity and
change in personality traits across the life course. In U. M. Staudinger &
U. Lindenberger (Eds.), Understanding human development: Dialogues
with lifespan psychology (pp. 183–214). New York: Kluwer Academic.
Roberts, B. W., & DelVecchio, W. F. (2000). The rank-order continuity of
personality traits from childhood to old age: A quantitative review of
longitudinal studies. Psychological Bulletin, 126, 3–25.
Roberts, B. W., Helson, R., & Klohnen, E. C. (2002). Personality devel-
opment and growth in women across 30 years: Three perspectives.
Journal of Personality, 70, 79–102.
Roberts, B. W., Robins, R. W., Caspi, A., & Trzesniewski, K. H. (2003).
Personality trait development in adulthood. In J. T. Mortimer & M.
Shanahan (Eds.), Handbook of the life course (pp. 579–595). New York:
Plenum.
Roberts, B. W., Walton, K. E., & Viechtbauer, W. (2006). Patterns of
mean-level change in personality traits across the life course: A meta-
analysis of longitudinal studies. Psychological Bulletin, 132, 1–25.
Roberts, B. W., Wood, D., & Caspi, A. (in press). The development of
personality traits in adulthood. In O. P. John, R. W. Robins, & L. A.
Pervin (Eds.), Handbook of personality: Theory and research (3rd ed.).
New York: Guilford Press.
Robins, R. W., Fraley, R. C., Roberts, B. W., & Trzesniewski, K. H.
(2001). A longitudinal study of personality change in young adulthood.
Journal of Personality, 69, 617–640.
Saucier, G. (1998). Replicable item-cluster subcomponents in the NEO
Five-Factor Inventory. Journal of Personality Assessment, 70, 263–276.
Small, B. J., Hertzog, C., Hultsch, D. F., & Dixon, R. A. (2003). Stability
and change in adult personality over 6 years: Findings from the Victoria
longitudinal study. Journals of Gerontology, Series B: Psychological
Sciences, 58, P166–P176.
Smith, T. W., & Spiro, A., III. (2002). Personality, health, and aging:
Prolegomenon for the next generation. Journal of Research in Person-
ality, 36, 363–394.
Srivastava, S. S., John, O. P., Gosling, S. D., & Potter, J. (2003). Devel-
opment of personality in early and middle adulthood: Set like plaster or
persistent change? Journal of Personality and Social Psychology, 84,
1041–1053.
Terracciano, A., Costa, P. T., Jr., & McCrae, R. R. (2006). Personality
plasticity after age 30. Personality and Social Psychology Bulletin, 32,
999–1009.
Terracciano, A., McCrae, R. R., Brant, L. J., & Costa, P. T., Jr. (2005).
Hierarchical linear modeling analyses of the NEO-PI-R scales in the
Baltimore Longitudinal Study of Aging. Psychology and Aging, 20,
493–506.
Tyron, W. W. (2001). Evaluating statistical difference, equivalence, and
indeterminacy using inferential confidence intervals: An integrated al-
ternative method of conducting null hypothesis statistical tests. Psycho-
logical Methods, 6, 371–386.
Wechsler, D. (1981). WAIS-manual: Wechsler Adult Intelligence Scale—
Revised. New York: Psychological Cooperation.
Weiss, A., Costa, P. T., Jr., Karuza, J., Duberstein, P. R., Friedeman, B., &
McCrae, R. R. (2005). Cross-sectional age differences in personality
among Medicare patients aged 65 to 100. Psychology and Aging, 20,
182–185.
Yun-Tein, J., & Millsap, R. E. (2004). Assessing factorial invariance in
ordered-categorical measures. Multivariate Behavioral Research, 39,
479–515.
Zimprich, D. (2002a). Kognitive Entwicklung im Alter-Die Bedeutung der
Informationsverarbeitungsgeschwindigkeit und sensorischer Funktionen
fu¨r den kognitiven Alterungsprozess [Cognitive development in old
age—On the significance of processing speed and sensory functioning
for cognitive aging]. Hamburg, Germany: Dr. Kovac.
Zimprich, D. (2002b). Cross-sectionally and longitudinally balanced ef-
fects of processing speed on intellectual abilities. Experimental Aging
Research, 28, 231–251.
Zimprich, D., Allemand, M., & Hornung, R. (2006). Measurement invari-
ance of the abridged sense of coherence scale in adolescents. European
Journal of Psychological Assessment, 22, 280–287.
Zimprich, D., & Martin, M. (2002). Can longitudinal changes in processing
speed explain longitudinal changes in fluid intelligence? Psychology and
Aging, 17, 690–695.
Received October 10, 2007
Revision received June 23, 2008
Accepted June 24, 2008 Ⅲ
557LONG-TERM CORRELATED CHANGE IN PERSONALITY TRAITS
All in-text references underlined in blue are linked to publications on ResearchGate, letting you access and read them immediately.