Free cash flow monsanto
•
1 like•720 views

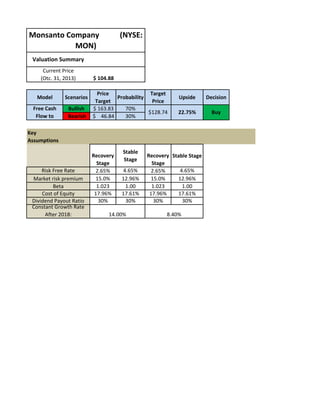
This document provides a valuation summary and analysis of Monsanto Company (MON). It estimates a bullish target price of $163.83 per share with a 70% probability based on discounted cash flow modeling. Key assumptions in the model include a recovery growth rate of 14% until 2018 followed by stable growth of 8.4%, a cost of equity of 17.61-17.96%, and a 30% dividend payout ratio. Historical financial data from 2008-2013 show sales, EBITDA, and EPS growth with improving margins over time.

Recommended
More Related Content
What's hot
What's hot (20)
Viewers also liked
Similar to Free cash flow monsanto
Similar to Free cash flow monsanto (20)
More from Usman Riaz
Recently uploaded
Recently uploaded (20)
Free cash flow monsanto
- 1. Monsanto Company MON) (NYSE: Valuation Summary Current Price (Otc. 31, 2013) Model Scenarios Free Cash Flow to Bullish Bearish $ 104.88 Price Target Probability Target Price $ 163.83 70% $128.74 $ 46.84 30% Upside Decision 22.75% Buy Key Assumptions Risk Free Rate Market risk premium Beta Cost of Equity Dividend Payout Ratio Constant Growth Rate After 2018: Recovery Stage 2.65% 15.0% 1.023 17.96% 30% Stable Stage 4.65% 12.96% 1.00 17.61% 30% 14.00% Recovery Stable Stage Stage 4.65% 2.65% 15.0% 12.96% 1.023 1.00 17.96% 17.61% 30% 30% 8.40%
- 2. (Dollars in millions, except per share amounts) Net Sales Cost of goods sold Gross Profit Operating Expenses: Selling, general and administrative expenses Research and development expenses Acquired in-process research and development Restructuring charges, net Total Operating Expenses Income from Operations EBITDA Interest expense Interest income Solutia-related income, net Other expense, net Income from Continuing Operations Before Income Taxes Income tax provision Income from Continuing Operations Including Portion Attributable to Noncontrolling Interest Discontinued Operations: Income from operations of discontinued businesses Income tax provision Income on Discontinued Operations Net Income Less: Net income attributable to noncontrolling interest Net Income Attributable to Monsanto Company Amounts Attributable to Monsanto Company: Income from continuing operations Income on discontinued operations Net Income Attributable to Monsanto Company Basic Earnings per Share Attributable to Monsanto Company: Income from continuing operations Income on discontinued operations Net Income Attributable to Monsanto Company Diluted Earnings per Share Attributable to Monsanto Company: Income from continuing operations Income on discontinued operations Net Income Attributable to Monsanto Company EPS growth Weighted Average Shares Outstanding: Basic Diluted 2008 $11,365 5,188 6,177 2009 $11,724 4,962 6,762 2010 $10,502 5,416 5,086 2011 $11,822 5,743 6,079 2012 $13,504 6,459 7,045 2013 $14,861 7,208 7,653 2,312 980 164 2,037 1,098 163 361 3,659 3,103 3,651 129 (71) 2,064 1,205 2,190 1,386 2,390 1,517 2,550 1,533 210 3,479 1,607 2,209 162 (56) 1 3,577 2,502 3,115 162 (74) (10) 3,897 3,148 3,770 191 (77) 4,083 3,570 4,185 172 (92) 78 2,967 7 1,494 40 2,374 46 2,988 61 3,429 899 2,027 845 2,122 370 1,124 717 1,657 901 2,087 915 2,514 20 3 17 2,044 20 $2,024 19 8 11 2,133 24 $2,109 4 4 1,128 19 $1,109 3 1 2 1,659 52 $1,607 10 4 6 2,093 48 $2,045 17 6 11 2,525 43 $2,482 $2,007 17 $2,024 $2,098 11 $2,109 $1,105 4 $1,109 $1,605 2 $1,607 $2,039 6 $2,045 $2,471 11 $2,482 $3.66 0.03 $3.69 $3.83 0.02 $3.85 $2.03 0.01 $2.04 $2.99 0.01 $3.00 $3.82 0.01 $3.83 $4.63 0.02 $4.65 $3.59 0.03 $3.62 $3.78 0.02 $3.80 4.97% $2.01 $2.96 $2.01 -47.11% $2.96 47.26% $3.78 0.01 $3.79 28.04% $4.58 0.02 $4.60 21.37% 548.90 559.70 547.10 555.60 543.70 550.80 536.50 542.40 534.10 540.20 533.70 539.70 3,456 2,721 3,294 110 (132) (187) 4 2,926 2014 15740.22 2015 16758.26 2016 18408.26 2017 20120.48 2018 21793.7 2019 23306.81
- 3. (Dollars in millions, except share amounts) Assets Current Assets: Cash and cash equivalents (variable interest entities restricted - 2013: $140 and 2012:$120 Short-term investments Trade receivables, net (variable interest entities restricted - 2013: $0 and 2012:$52 Miscellaneous receivables Deferred tax assets Inventory, net Other current assets Total Current Assets Total property, plant and equipment Less: Accumulated depreciation Property, Plant and Equipment, Net Goodwill Other Intangible Assets, Net Noncurrent Deferred Tax Assets Long-Term Receivables, Net Other Assets Total Assets Liabilities and Shareowners Equity Current Liabilities: Short-term debt, including current portion of long-term debt Accounts payable Income taxes payable Accrued compensation and benefits Accrued marketing programs Deferred revenues Grower production accruals Dividends payable Customer payable Restructuring reserves Miscellaneous short-term accruals Total Current Liabilities Long-Term Debt Postretirement Liabilities Long-Term Deferred Revenue Noncurrent Deferred Tax Liabilities Long-Term Portion of Environmental and Litigation Liabilities Other Liabilities Shareowners Equity: Common stock (authorized: 1,500,000,000 shares, par value $0.01) 2009 2010 2011 2012 2013 $1,956 $1,485 $2,572 $3,283 $3,668 1,556 1,590 302 2,117 302 1,897 254 1,715 654 662 2,934 121 7,883 7,158 3,549 3,609 3,218 1,371 743 557 496 $17,877 717 511 2,739 80 7,122 8,068 3,841 4,227 3,204 1,263 1,014 513 524 $17,867 629 446 2,591 152 8,809 8,697 4,303 4,394 3,365 1,309 873 475 619 $19,844 620 534 2,839 183 9,658 8,835 4,470 4,365 3,435 1,237 551 376 602 $20,224 748 579 2,947 166 10,077 9,491 4,837 4,654 3,520 1,226 454 237 496 $20,664 $79 $241 $678 $36 $51 676 79 263 934 219 139 145 307 286 629 3,756 1,724 793 488 153 197 752 66 179 839 219 130 151 83 197 684 3,541 1,862 920 395 137 188 839 117 427 1,110 373 87 161 94 24 819 4,729 1,543 509 337 152 176 794 75 546 1,281 396 194 200 14 995 91 492 1,078 517 60 228 12 685 4,221 2,038 543 245 313 213 812 4,336 2,061 357 138 469 193 641 681 682 615 382 6 6 6 6 6 Issued 601,631,267 and 596,136,929 shares, respectively Outstanding 529,029,712 and 534,373,880 shares, respectively Treasury stock 72,601,555 and 61,763,049 shares, respectively, at cost Additional contributed capital Retained earnings Accumulated other comprehensive loss Reserve for ESOP debt retirement Total Monsanto Company Shareowners Equity Noncontrolling Interest Total Shareowners Equity Total Liabilities and Shareowners Equity Non-cash Working Capital (1,577) (2,110) (2,613) (3,045) (4,140) 9,695 2,682 (744) (6) 10,056 69 10,125 $17,877 2,171 9,896 3,208 (897) (4) 10,099 44 10,143 $17,867 2,096 10,096 4,174 (116) (2) 11,545 171 11,716 $19,844 1,508 10,371 5,537 (1,036) 10,783 7,188 (1,278) 11,833 203 12,036 $20,224 2,154 12,559 169 12,728 $20,664 2,073 $1,803 $2,103 $2,221 $2,074 $2,112 ($153) 3651 -0.04 $618 ($351) ($1,209) ($1,556) 2209 3115 3770 4185 0.28 -0.11 -0.32 -0.37 -0.11
- 4. (Dollars in millions) Operating Activities: Net Income Adjustments to reconcile cash provided by operating activities: Items that did not require (provide) cash: Depreciation and amortization Bad-debt expense Receipt of securities from Solutia settlement Stock-based compensation expense Excess tax benefits from stock-based compensation Deferred income taxes Restructuring charges, net Equity affiliate income, net Acquired in-process research and development Net gain on sales of a business or other assets Other items, net Changes in assets and liabilities that provided (required) cash, net of acquisitions: Trade receivables, net Inventory, net Deferred revenues Accounts payable and other accrued liabilities Restructuring cash payments Pension contributions Net investment hedge settlement Other items, net Net Cash Provided by Operating Activities Investing Activities: Cash Flows Provided (Required) by Investing Purchases of short-term investments Maturities of short-term investments Capital expenditures Acquisition of businesses, net of cash acquired Purchases of long-term debt and equity securities Technology and other investments Proceeds from divestiture of a business Other investments and property disposal proceeds Net Cash Required by Investing Activities Financing Activities: Cash Flows Provided (Required) by Financing Net change in financing with less than 90-day maturities Short-term debt proceeds Short-term debt reductions Long-term debt proceeds Long-term debt reductions Payments on other financing Debt issuance costs Treasury stock purchases Stock option exercises Excess tax benefits from stock-based compensation Tax withholding on restricted stock and restricted stock units Dividend payments Proceeds from noncontrolling interest Dividend payments to noncontrolling interests Net Cash Required by Financing Activities Cash Assumed from Initial Consolidations of Variable Interest Entities Effect of Exchange Rate Changes on Cash and Cash Equivalents Net Increase in Cash and Cash Equivalents Cash and Cash Equivalents at Beginning of Period Cash and Cash Equivalents at End of Period 2008 2009 2010 2011 2012 2013 $2,044 $2,133 $1,128 $1,659 $2,093 $2,525 573 57 (38) 90 (198) 47 548 49 602 58 613 3 622 3 615 27 102 (43) 10 210 (29) 104 (36) 124 1 (21) 128 (50) 263 (10) (19) 100 (79) 176 25 116 (35) 264 361 (22) 163 (66) (25) (3) 65 (5) 18 (4) 2 (17) (77) (318) (691) 492 889 526 (638) (700) (327) (187) 35 51 2,246 (347) 181 85 586 (183) (291) 170 (427) (39) 439 (12) (83) 222 (192) 50 (104) (120) (124) (53) 2,837 (22) 213 (89) (438) (263) (134) (4) 35 1,398 323 2,814 (25) 3,051 (414) 2,740 (732) 430 (540) (99) (746) 746 (646) (322) (716) 764 (741) (165) (55) (77) (88) 50 (834) 21 (975) 11 (1,034) 169 (777) (142) 75 (45) 48 75 (101) (71) (6) (4) (1) (116) 30 (42) 499 (629) 104 22 (29) 32 (2) (398) 39 35 (532) 56 43 69 84 (74) 299 (193) (1) (5) (502) 65 36 (4) (5) (432) 117 50 (19) (1,095) 257 79 (10) (419) (23) (552) (10) (577) (45) (125) (1,075) (1,038) (602) 69 (105) (864) 77 (642) 101 (77) (1,165) (802) 133 (174) (1,485) 77 747 866 $1,613 (105) 343 1,613 $1,956 3 (471) 1,956 $1,485 35 1,087 1,485 $2,572 (141) 711 2,572 $3,283 (93) 385 3,283 $3,668 (2) 164 (132) 59 (918) (1,022) (78) (41) 90 (2,042) 92 (10) 546 (254) (3) (5) (361) 114 198 132 (916) (329) (7) (72) 300 169 (723) (755) (57) (39) (33) (17) (75)
- 5. Current Hight Growth Ratio Analysis 2009A 2010A 2011A 2012A 2013A 2014E Sales growth EBITDA growth EPS growth 3.2% 10.8% 4.97% -10.4% -39.5% -47.11% 12.6% 41.0% 47.26% 14.2% 21.0% 28.04% 10.0% 11.0% 21.37% Gross margin EBIT margin EBITDA margin Tax rate Net margin 57.7% 26.5% 31.1% 28.5% 18.0% 48.4% 15.3% 21.0% 24.8% 10.6% 51.4% 21.2% 26.3% 30.2% 13.6% 52.2% 23.3% 27.9% 30.2% 15.1% 51.5% 24.0% 28.2% 26.7% 16.7% 5.9% 8.9% 20.00% 6.00% 52.2% 22.1% 26.9% 30.6% 15.3% Return on equity (ROE) 20.8% 10.9% 13.7% 17.0% 19.5% Payout Ratio 26.2% 52.0% 37.5% 31.4% 32.3% Retention Ratio 73.8% 48.0% 62.5% 68.6% 67.7% 16.4% 17.0% 35.9% 35.9% 64.1% 64.1% 2015E Stable Growth 2016E 2017E 2018E 2019E 6.5% 9.8% 9.3% 8.3% 6.9% 8.5% 18.1% 13.5% 12.0% 10.5% 19.00% 18.00% 17.00% 16.00% 14.00% Bullish 6.400% 6.800% 7.200% 7.600% 8.40% Bearish 51.2% 51.7% 51.8% 51.7% 51.7% 21.2% 22.3% 22.6% 22.4% 22.1% 26.1% 27.1% 27.2% 27.1% 26.9% 27.2% 31.1% 27.6% 31.6% 30.0% 15.4% 15.4% 16.3% 15.4% 15.5% 17.0% 16.2% 34.9% 34.9% 65.1% 65.1% 17.6% 15.3% 33.9% 33.9% 66.1% 66.1% 18.2% 14.5% 32.9% 32.9% 67.1% 67.1% 18.8% 13.7% 32.0% 32.0% 68.0% 68.0% 20.0% 12.0% 30% 30% 70.0% 70.0% Bullish Bearish Bullish Bearish Bullish Bearish
- 6. Beta I calculated beta using regression for the period 01/2006 - 11/2013. Using the covariance formula Estimating Risk Premium E(Rm)= 17.61% High Growth COE E( R)= Rf+ b(E(Rm) - Rf) 17.96% Stable Growth COE E( R)= Rf+ b(E(Rm) - Rf) 17.61% Gordon Growth value of stock expected dividend expexted growth rate 104.88 1.900772 15.80% Rf b E(Rm) 2.65% 1.023422 17.61% Rf b E(Rm) 4.65% 1 17.61% 1.023422
- 7. Free Cash Flow to Equity (Year Ending August 31) 2009A Net Income 2010A 2011A Current 2013A 2012A High Growth 2014E 2978.40 2630.92 3.00% 633.45 2.00% 755.82 2015E 3544.30 2799.30 652.45 770.94 2016E 4182.27 2989.65 672.03 786.36 2017E 4893.26 3204.91 692.19 802.08 2018E 5676.18 3448.48 712.95 818.12 Stable Growth 2019E 6470.84 bullish 3738.15 bearish 734.34 834.49 $2,109 $1,109 $1,607 $2,045 $2,482 548 916 602 755 613 540 622 646 615 741 2,934 7,883 1,956 676 79 145 307 7,654 2,739 7,122 1,485 752 66 151 83 7,324 2,591 8,809 2,572 839 117 161 94 7,617 2,839 9,658 3,283 794 75 200 14 8,131 2,947 10,077 3,668 995 91 228 12 8,030 102% 8150.45 8272.71 8396.80 8522.75 8650.59 8780.35 (330) 293 514 (101) 120.45 122.26 124.09 125.95 127.84 130.00 Add: Depreciation Less:Capital Expenditures Inventory, net Total Current Assets Cash and Cash Equivalents at End of Period Accounts payable Income taxes payable Dividends payable Customer payable Non-Cash Working Capital Less:Change in Non-Cash Working Capital Short-term debt proceeds 75 75 84 30 22 Long-term debt proceeds 0 0 299 499 32 Short-term debt reductions (45) (101) (74) (42) (29) Long-term debt reductions (71) (4) (193) (629) (2) Plus: Net Cash Inflow from Borrowings FCFE ($41) $1,700 ($30) $1,256 $116 $1,503 ($142) $1,365 $23 $2,480 Growth Rate Cost of Equity Risk Free Rate Beta Risk Premium Cost of Equity Components of Value Cash Flow - High Growth Terminal Price Total Value Shares Outstanding Total Value per Share Target price 14.00% 8.40% bullish bearish High Growth Stable Growth 2.65% 1.02 14.96% 17.96% 4.65% 1.00 12.96% 17.61% Bullish Bearish Target(70%) target(30%) $ 11,837.04 $ 8,433.32 $ 76,583.68 $ 16,848.67 $ 88,420.72 $ 25,282.00 539.70 539.70 $ 163.83 $ 128.74 46.84 Relative Multiple Price Forward Earnings P/E Target $ 128.74 $ 5.33 24.2x Actual $ 104.88 $ 4.56 23.0x Potential Appreciation 22.75% Recommendation Buy bullish bearish $ 2,306 $ 2,363 $ 2,393 $ 2,398 $ 2,376 $ 76,584 $ 2,012 $ 1,828 $ 1,667 $ 1,526 $ 1,401 $ 16,849 Present Value ($15) ($15) ($15) ($15) ($15) ($15) $2,721 $3,289 $3,929 $4,642 $5,428 $6,226 $ 2,373 $ 2,544 $ 2,736 $ 2,954 $ 3,200 $ 3,493 bullish bearish