SlideShare a Scribd company logo
1 of 8
Download to read offline
The International Journal Of Engineering And Science (IJES) 
|| Volume || 3 || Issue || 8 || Pages || 27-34 || 2014 || 
ISSN (e): 2319 – 1813 ISSN (p): 2319 – 1805 
www.theijes.com The IJES Page 27 
Experimental assessment of bitumen coat-resistance to impact strength corrosion deterioration of low carbon steel using shewart charts 1, T.N. Guma, 2, S.Y. Aku, 3, D.S. Yawas, 4, M. Dauda 1, Department of Mechanical Engineering Nigerian Defence Academy, P.M.B 2109, Kaduna Kaduna State, Nigeria Tel: +2348068747385 (GSM) 2, 3, 4, Department of Mechanical Engineering Ahmadu Bello University, Zaria, Kaduna State, Nigeria --------------------------------------------------------------ABSTRACT------------------------------------------------------- Maximum information on the performance of a production or an experimental process can be obtained by employing statistical methods. A study of various coat-resistance levels to corrosion deterioration of mechanical properties of low carbon steel by some bitumen from Nigerian resources has previously been undertaken through parallel experimental processes. The purpose of this paper is to present an assessment of overall levels of variation in such processes through inferences drawn from impact strength using proper data size and the charts as a case study. 78 ASTM impact specimens were similarly prepared from procured rods of the steel and three clear bitumen samples harvested at different critical resource sites in Nigeria for the study. Three of the specimens as a set were each bath-dip-coated to a working thickness of 0.81mm with a separate bitumen sample and the level of the coating’s resistance to corrosion deterioration of impact fracture strength of the specimens determined through the same experimental process. This was repeated at different times with each of the remaining sets. The overall appropriately obtained information was tabulated and analyzed using the charts. The analysis indicated that the quality of the harvested bitumen samples and their corrosion coat protection levels of the steel strength and the overall as-conducted experimental process were in statistical quality control. Keywords: Low carbon steel, mechanical properties, deterioration, Nigerian bitumen, protection levels, process, variation, acceptability --------------------------------------------------------------------------------------------------------------------------------------- 
Date of Submission: 04 Aug 2014 Date of Publication: 20 August 2014 --------------------------------------------------------------------------------------------------------------------------------------- 
I. INTRODUCTION 
Corrosion costs for industrialized nations are put at 5% of their gross national domestic products (GNDP). In developing countries, the general level of corrosion-consciousness and counteractions are however minimal and the deleterious phenomenon has more or less silently been taking its toll directly and indirectly on their economies and people’s lives in many quarters. Corrosion is preponderant in the oil and gas industry. The total cost of corrosion to the industry worldwide is huge and staggering. A figure of 300 billion US dollars was mentioned in the United States of America alone in 1998. It was estimated that only 45% of this amount was economically justifiable using the existing technologies of corrosion prevention. The cost of pipeline corrosion alone can also be huge. For example, corrosion and its related effects cost the United States of America transmission pipeline companies as much as 8.6 billion dollars per year (Guma et al, 2010; 2011a ,b and 2013a). The most important corrosion problem in all quarters worldwide is the rusting of structural steelworks. Rusting is a uniform or nearly uniform form of corrosion and accounts to about 90% of all corrosion problems in the total economy. The amount of steel which rusts away for lack of adequate protection amounts to about 1000 tonnes every single day (Higgins, 1993). Rusting can impair the levels of mechanical properties of steel to the extent that it may not perform satisfactorily in structural service or even collapse. Although the most steel- corrosive natural environments include; acidic soils, highly saline soils and heavy clays of high electrical conductivity, organic deposits such as silt and harbor mud, and sea water; the material rusts at almost incredible rates on the surf beaches in the tropics where it is exposed to continuous spray of sea salts particularly sodium chloride. (Laque, 1975; Cottrell, 1985; Guma et al, 2013a and Guma and Oguchi, 2011). The rate of rusting increases with the salt and moisture contents of air. At a very high salt content of 11.1% and dew point, a rate of 0.95mm/yr was obtained for ingot iron by Ambler and Bain (2012) at 50 yards from the tropical surf beach in Lagos, Nigeria.
Experimental assessment of bitumen coat-resistance to impact… 
www.theijes.com The IJES Page 28 
Nigeria’s economy is about 85% petroleum-dependent. The country is a developing nation that is groping for ways to catapult her to the status of an industrialized nation without necessarily preparing for it. No government in Nigeria has yet come to grips with the reality of the devastating effect of corrosion on the country’s economy. The country is endowed with abundant critical and strategic resources that can help her to easily attain the industrial status if managed properly but so far, the utilization of these resources as raw materials is dependent wholly on the industrialized economies. The petroleum industry upon which her economy is so dependent is prone to corrosion ravages. About 80% of her refinery equipment and transmission pipelines are made of carbon steel particularly of the low carbon type. The petroleum products are transported from one location to another through pipelines which pass through the sea, rivers, ground or surface water in urban and rural areas. The deterioration of these pipelines and other aspects of plants due to corrosion is a huge cost to the country in terms of; subsequent oil leakage and spillage, violation of environmental and safety laws, product contaminations, reduction of efficiency of operating plants, loss of production, over design, protection and maintenance, replacements of parts, fire and other general losses. Yet all the materials of construction in the country are imported, an enormous amount of foreign exchange is lost for combating corrosion in the country. These necessitate professional and technological challenges on how best to protect these pipelines with novel approaches (Ali, 1998; Wami, 1998; Yawas, 2006, Guma et al, 2010; 2011a, b and 2013a). There are many approaches to combating corrosion; however, the most economical, versatile, widely and commonly used method is by paints or organic coatings. It is estimated that about 90% of all steel surfaces are protected by paints or organic coatings (Laque, 1975 and Pludek, 1977). Bitumen is an important organic material that has been in use for coat-protection of steelworks in corrosion-preponderant industries such as petroleum or other chemical and water industries and coatings based on it provide excellent resistance to industrial pollution. The grades and service attributes of bitumen obtained from different sources can however vary widely. Nigeria is blessed with abundant reserves of natural bitumen amounting to about 14.46 billion barrels whose quality varies from location to location and capability for synthesizing large quantities of bitumen from petroleum, but there has been no public-available coating codes of practice with her bitumen (Olalere, 1991; Fed. Min. Sol. Mine. Dev; 2006; INTERNET, 2012 and Guma et al, 2013a). Guma et al (2010; 2011a, b and 2013a) undertook a study to evaluate and provide information on suitability levels of various coating treatments of bitumen from the resources as inhibitors of steel corrosion. In that study; coat-resistances to corrosion deterioration of hardness, fatigue, tensile and impact fracture strengths of a low carbon steel by three harvested bitumen samples designated as Ondo S-A, Ondo S-B, and KPB from different critical resource sites in the country were evaluated. Five different coating treatments of working thicknesses in the range of 0.81- 1.46mm were used. The obtained results showed different appreciable inhibition performance levels of practical importance that generally increased with the working thickness within the range of 53.36 to about 97.42%. The experimental processes from which the information were obtained included: procurement of the bitumen samples and low carbon steel rods, analyses of chemical composition and microstructures of the steel rods to ascertain those that were indeed low carbon steel and consistent in structure, analyses of physico-chemical properties to assess grades of bitumen from the sample sources, machine-production of 33 specimens for ASTM E8 tensile; 33 for ASTM E23 (impact); 33 for ASTM 384 (Knoop micro-hardness); and 175 for ASTM E92-82 (fatigue) tests with the rods, polishing the produced specimens to an average surface finish of 25 microns, normalization of the specimens to relieve them of any machining stresses, heating each bitumen sample to a desired temperature and bitumen-coating sets of specimen types to various thicknesses by bath- dipping them in the heated bitumen for a period of 30 seconds, removing the specimens from the bath and allowing the coatings on them to cool to room temperature and statistically determining the working coating thickness for each case of bath coating temperature used, place-exposing the coated specimens continuously to a design-produced acidic and chloride corrosive medium for 50 days to undergo any possible level of corrosion, removing the specimens and subjecting each as well as the others for control to appropriate mechanical tests, collection of the test results and appropriately evaluating the resistance level of each coating thickness of each bitumen sample to corrosion deterioration of each mechanical property, etc. Although these processes were so carried out for each mechanical property and coating thickness, any one or more unknown causes from them might have affected the true inhibition data values from the overall tests. This is because variations in quality characteristic are inevitable, however well a process may be controlled and tests carried out (Holman, 1984). The variation is attributable to two types of causes, namely; i Natural or chance causes. ii Assignable (special) causes.
Experimental assessment of bitumen coat-resistance to impact… 
www.theijes.com The IJES Page 29 
Variations due to material or chance causes are inherent in a process. They are due to multitude of causes which are difficult to identify and uneconomical to eliminate. Furthermore, variations due to chance causes consists of many individual causes with any one chance resulting in only a very minute amount of variation; and follow statistical laws. Such causes include; changes in the process over time and time required taking measurements, errors introduced into the measurement by the instrumentation system, lack of perfection in reading instruments, small variation due to aging of machine or equipment. On the contrast, assignable or special causes of variation are generally due to few individual factors which can be identified and eliminated. Assignable causes do not follow statistical laws and any one of them can result in a very large amount of variation in the output from a process. Some typical assignable causes of variations are; batch defective raw materials, faulty set-ups, and new or inexperienced operators (Holman, 1984; Miller and Freund, 1987; Evans and Lindsay, 1996; Jain, 2005; Jain and Aggarwal, 2008). Statistical methods of experimental and production assessments provide the basis for making decisions, determining errors, precision and general validity of measurements; or performance levels. Statistical process control is a methodology which operators, supervisors and managers use control charts to monitor output to identify and to eliminate special cause of variation in a process. It is a proven technique for reducing scrap and rework, thus, increasing productivity. It also provides the basis for determining process capability and predicting yield from a process. In many industries, suppliers are required to provide evidence of statistical process control to their customers. The commonly used methods for statistical quality control include the average (X ) and range (R) charts; also called Shewart charts, fraction defective (p-chart), and chart for defective (c-chart). Where the characteristic under study can be measured along a scale of measurement, the X and R charts have proved to be of greater values and should be used in preference to the p and c charts. Usually 25 to 30 data values per sample and three to ten samples are collected and used for the X and R charts (Evans and Lindsay, 1996; Jain and Aggarwal, 2008 and INTERNET, 2013a, b). The object in this paper is to understand better the levels of variation in qualities of the as-harvested bitumen samples from Nigerian resources and the overall experimental processes used to obtain their various coat-resistance levels to corrosion deterioration of mechanical properties of a low carbon steel by Guma et al (2010; 2011a, b and 2013a); through inferences from Shewart charts’ analyses of a proper test-obtained data size on the levels by the bitumen samples with impact fracture strength and 0.81mm working thickness as a case study. 
II. EXPERIMENTAL CONCEPT/METHOD 
Material Sourcing Low carbon steel rods of diameters 8-10mm were purchased from a supplier in the iron and steel market in Lagos, Nigeria, while two natural bitumen samples with identification names Ondo S-A and Ondo S- B, and a synthetic bitumen sample with name KPB were collected in sufficient quantities from critical bitumen sources in Nigeria for the tests. Ondo S-A was collected from a clear bitumen deposit on the ground surface in a waterlogged area in Ondo state on the outskirts of Agbabu village that adjoined Agbabu-Ore road, and Ondo S- B from a rich deposit underground within the village through a standard extraction hole drilled by early explorers of bitumen in Nigeria. KPB was from bitumen manufactured at Kaduna Refining and Petrochemical Company (KRPC) with the blend of the Nigerian and Iran’s Basara crudes as feedstock (Guma et al, 2010; 2011a, b; 2013a). Test Procedures The elemental average weight composition of each procured rod was determined by the energy dispersive X-ray fluorescence analysis and a chromatographic technique. The obtained composition together with analyses of revealed microstructures of the rods at an optical magnification of 200 confirmed rods that were similar low carbon steel. The obtained composition and microstructure had previously been presented by Guma et al (2010; 2011a, b and 2013a). 
The confirmed rods were used to machine-produce 26 three-set impact specimens at different occasions according to ASTM E23 test procedure. The sets were designated numbers. 1-26. The number (No.) 1 set was first produced and each specimen of the set similarly machine-polished with various grades of polishing paper, starting with the 250-grade and finishing with the 400 at a profilometer-ascertained average surface finish of 25 microns. Differences in machining parameters can exist and result in various residual stresses among the same type of specimens and have different effects on corrosion and impact strength values of the specimens and cause difficulty and inaccuracy in analysis of true effects of the test corrosion per se on the specimens. The polished specimens were thus normalized to relieve them of any such stresses by heating them in a tubular heat treatment furnace to a temperature of 8500C, holding them there for enough time of two hours, and removing and cooling
Experimental assessment of bitumen coat-resistance to impact… 
www.theijes.com The IJES Page 30 
them in air at room-temperature in accordance to Cottrell (1985), Rajan et al (1990), Guma et al ( 2010; 2011a ,b and 2013a, b), and Guma and Oguchi (2011). The normalized specimens were coated by dipping them in the bitumen bath at 2300C. The temperature was chosen within the range of 150-250OC for heating and coat-applying most bitumen (Pain. Dec. Con., 1995; Guma et al, 2010; 2011a, b and 2013a, b). A 20-kg gas-fired heating unit was used to heat a portion of Ondo S- A in a steel container to 2300C. The temperature was monitored by a 0-360oC mercury-in-glass thermometer. A specimen was held on its head with a thin-lip crucible tong and dipped into the bitumen for 30 seconds. This was repeated with a different specimen and portion of Ondo S-B and likewise KPB. This produced a statistically determined overall working coating thickness of 0.81mm with the bitumen samples after the coatings had cooled to room temperature, in accordance with Guma et al ( 2010; 2011a, b and 2013a, b). The coated specimens were fully exposed to a corrosive medium that was design-prepared with a very high factor of aggressiveness in accordance with the principle for laboratory corrosion testing, using Armfield corrosion studies kit. 11.538g of NaCl and 2.308g of concentrated sulphuric acid (H2SO4) were determined with a very accurate digital weighing scale and mixed thoroughly in 1000cm3 of water to get the corrosive medium composed of 30% NaCl + 5% con. H2SO4 + 65% water by mass. The medium was poured to about 70% of the volume capacity of a flat-based 250-ml plastic container in which the specimens had been carefully placed in vertical positions with due consideration to identity of each as-coated with the bitumen samples. Air from the compressor part of the kit was released at a pressure of 0.015 bars in excess of one atmosphere via a 4mm- diameter plastic hose that had its open end immersed to the bottom of the corrosive medium in the container.. This aerated the medium and made it to circulate in an up and down fashion over the specimens at the prevailing room temperature to simulate with a reasonable higher aggressive factors, the specimens’ field exposure to one of the worst natural corrosive environments-the tropical surf beach atmosphere of 100% relative humidity. In that way, the specimens were left continuously exposed to the medium for 50 days at ambient room temperature in the laboratory to undergo any possible level of corrosion (Guma et al, 2010; 2011a, b and 2013b). At the end of the exposure time, the specimens were all removed and tested within two hours of their impact fracture strengths in accordance with ASTM E23 procedures (Choudary, 2003 and Guma et al, 2011b) using the Hounsfield balanced impact strength machine. Each specimen was properly held in the vise of the machine and struck at the position of its notch with two similar pendulums each of mass 2.443kg travelling at a calibrated speed of 5m/s in opposite directions with a kinetic energy of 149.25 Joules from its calibrated standard height to fracture the specimen. The energy remaining after fracture was determined in each case from the height rise of the pendulums and their weights. The difference between the energy input and energy remaining represented the energy absorbed by the specimen. In that way three different data values were collected from the test. The percentage inhibition performance (Xi) on deterioration of the strength with the coating thickness for each case of bitumen sample was evaluated as (Guma et al, 2011b): Xi = (ΔTi /ΔUi) 100……..1 Where ΔTi is the change in the impact fracture energy between the un-coated but corroded (UC) specimens of the steel in the same test corrosive medium as was test-obtained and the coated and corroded steel specimen in the medium. ΔUi is the change in the impact fracture energy between the un-coated and un- corroded (UU) and the UC specimens (Guma et al 2011b). The impact energy values of 87.1 and 93.63 Joules for the UC and UU specimens respectively determined by Guma et al (2011b) were used to evaluate ΔTi and ΔUi. The above process from the machine-production of No. 1 set of specimen to evaluation of Xi from equation 1 was repeated with each of No. 2 to No. 26 three-set specimen at different occasions in accordance with the same test procedure used by Guma et al (2011b). The overall test obtained coat-resistance or inhibition data was tabulated. Evaluation of Requisite Parameters of the Coat-Resistance Performance data for Shewart Charts The average (X ) and range (R) values were evaluated from the test-obtained data on all the steel specimens of sets No. 1- 26 presented in Tables 1a and 1b. For each set (Ni), the average value (푋 푁) for the set was evaluated as (Miller and Freund, 1987):
Experimental assessment of bitumen coat-resistance to impact… 
www.theijes.com The IJES Page 31 
푋 푁= 푋푖 푖=3 푖=1 13 ………………………………………………..(2) Where, Xi is as obtained from equation 1 for a specimen The corresponding range (Ri) for the set was evaluated as ( Grant and Leavenworth, 1996): Ri = Xi max - Xi min --------------------------- (3) Xi max, Xi min are the least and highest coat-resistance values respectively in each case with a three-set specimen. The average of the average values (푋 ) for the 26 three-set specimen was evaluated as (Miller and Freund, 1987): X = X 푁 푁=26 푁=1 126=47.8846% ………………………..(4) The average (R ) of the ranges (Ri) for the 26 three-set specimens was evaluated as (Jain and Aggarwal, 2008): R = 푅푖 푁=26 푁=1 126=26.846154% ………………………..(5) Where, N is the total number three-set specimen used (N = 26). From these, the upper control limits (UCL), and lower control limits (LCL) for the R and X charts were appropriately evaluated according to Evans and Lindsay (1996), and Grant and Leavenworth (1996) as follows; The upper control limit for the range (R) chart (UCLR) was set as: UCLR = D1R = 2.574(26.846154) = 69.102% -------------------------------- (6a) The lower control limit for the R chart (LCLR) was set as: LC LR = D2R = 0.0 --------------------------------- (6b) The upper control limit for the X chart (UCLX) was set as: UCLX = X + A R = X + 3σ = 47.8846 + 1.023(26.846154) = 75.348216% ------------------ (7a) The lower control limit for the X chart (LCLX) was set as: LCLX = X - A R = X – 3σ = 47.8846 – 1.023(26.846154) = 20.420984% ----------------- (7b) Where; D1, D2, and A are parameters that depend on the sample size (n) for the 푋 and R control charts, and σ is the population standard deviation of the average values for all the three-set specimens and was determined from an equation given by Miller and Freund (1987) and Jain (2005) as: σ= 푋 − 푋 푁 푁=26 푁=1 126=10.459912% ………………………..(8) For the three-set size used, that is n = 3; D1, D2, and A were obtained from data table for X and R charts given by Evans and Lindsay (1996) and Grant and Leavenworth (1996) as; 1.023, 2.574, and 0 respectively. The obtained parameters from equations 1-5, 6a, 6b, 7a and 7b were used to plot the X and R charts of the obtained corrosion coat-resistance data with the bitumen samples. 
III. RESULTS AND DISCUSSION 
Results 
Results of corrosion coat-resistance levels to impact strength deterioration of a low carbon steel specimens by Ondo S-A, Ondo S-B and KPB as were appropriately obtained from a laboratory test process with a more or less working coating thickness of 0.81mm are shown in Table 1a while the appropriately evaluated parameters for the X and R charts using results in Table 1a, are shown in Table 1b. The drawn X and R charts using information presented in Table 1b are shown in Figures 1 and 2 respectively. The upper control limit for the X chart is set at an inhibition performance value of 75.348316% and the lower limit at 20.420984%, while those for the R chart are 69.102 and 0.0% respectively. The average (X ) values vary from the least value of 26% to the highest value of 62%, while the range (R) values from the least value of 5% to the highest value of 52%
Experimental assessment of bitumen coat-resistance to impact… 
www.theijes.com The IJES Page 32 
as can be seen from Table 1b and Figures 1 and 2. The centre line (CL) for the X chart is at 47.8864% and R chart at 26.85%. Discussion of Results From the drawn Shewart charts with the bitumen coat-protection levels of corrosion deterioration of impact fracture strength of a low carbon steel shown in Figures 1 and 2, it can be observed that for each chart no point is outside its control limits, the number of points above and below the centre line of each control chart are about the same. The points seem to fall randomly above and below the centre line of each chart and most points are near the centre line with only few close to the control limits. All the obtained data values of each chart fall within its lower and upper control limits and fluctuate randomly without any recognizable pattern as can be observed from Figures 1 and 2. This indicates that the overall experimental process was quite in statistical quality control, so that there was no special cause of variation to be eliminated in the quality of the test bitumen samples, low carbon steel, facilities and the overall conduction of the experimental process. 
IV. SUMMARY AND CONCLUSION 
An experimental or production process will always exhibit some variations in outputs or levels of performance when repeated a number of times in the same process with even precise and accurate facilities using similar materials, samples or specimens. This variability can be due to multitude of natural or chance causes which are difficult to identify and uneconomical to eliminate or assignable (special) causes due to a few individual factors which can be identified and eliminated. The data obtained from such a process may therefore be an assembly of readings but not an exact and reliable result. The data is however considered acceptable or reliable if its individual values are found to all fall within a permissible range of variation. Maximum information for acceptability or reliability of such assembly can be extracted by employing statistical methods. Shewart-charts’ analyses of overall results from a meticulously conducted laboratory test process of evaluating coat-resistance levels of impact strength corrosion deterioration of a low carbon steel by three harvested bitumen samples from some critical bitumen sources in Nigeria with a working coating thickness of 0.81mm has been presented. The analyses indicate that variation in the obtained data values and hence qualities of the test bitumen samples, steel, facilities and the overall conducted test process are all in statistical quality control (acceptable range of variation), so there was no special cause of variation to be eliminated in the process. The analyses also give an indication of acceptability of results for the cases of other coating thicknesses previously obtained by Guma et al (2011b) with other coating thicknesses using the same test process and results with parallel test processes for cases of other mechanical properties of the steel by Guma et al (2010, 2011a and 2013b). 
V. RECOMMENDATIONS 
Clear natural bitumen around the region of Agbabu, in Ondo State and the KRPC-synthesized type in Nigeria are recommended to be harvesting and exploiting as economical materials of more or less consistent quality for desired corrosion coat-protection levels with various coating thicknesses. The bitumen should be used for protection of steelworks in the country’s corrosion-preponderant industries with due consideration to existing coating codes of practice with bitumen and coat-inhibition information presented in this paper and previously by Guma et al (2010; 2011a, b and 2013a). REFERENCES 
[1]. Jain, K.C and Aggarwal, L.N. (2008). Production Planning Control and Industrial Managementp, Khanna Publishers Delhi, India, pp: 846-876 
[2]. Jain, R.K. (2005), Engineering Metrology, Khanna Publishers, Delhi, India, pp:. 896 – 897 
[3]. Evans, J.R. and Lindsay, W.L. (1996). The Management and Control of Quality, 3rd Edn. West Publishing Company, NewYork, pp:. 638-669 
[4]. Grant, E.L. and Leavenworth, R.S. (1996). Statistical Quality Control. Tata McGraw-Hill Publishing Co. Ltd. New Delhi, pp: 37- 70 
[5]. Olalere, A. (1991). Asphalt/Bitumen Production from Nigerian Crude. A HND Research Project, Unpublished, Department of Chemical Engineering, Kaduna Polytechnic, Nigeria 
[6]. Fed.Min. Sol. Mine. Dev. (2006). Technical Overview in Nigeria’s Bitumen Belt and Development Potential Report, Federal Ministry of Solid Minerals Development, Abuja, Nigeria, March 
[7]. Ambler and Bain: (2012). In: Atmospheric corrosion by G.O. Llyod. Extracted from http://www.npl.co.uk/upload/pdf/atmospheric_corrosion.pdf (20/10/2012) 
[8]. Ali, J.A. (1998). Social-Economic Costs of Corrosion, the Nigerian Situation and Policy Suggestions. J. Constr. Mat. Techn., 1(!), Nigerian Building and Road Research Institute (NBRRI), pp:. 30 – 39 
[9]. Wami, E.N. (1998). Investigation of Underground Corrosion of Mild Steel and High Carbon Steels. Nig. J. Tech. Edn. 15(!), National. Board for Technical Education, Nigeria. 
[10]. Yawas, D.S. (2006). Corrosion Characteristics of Mild Steel and Ductile Iron Exposed to Different Media. NSE Technical Transaction, Lagos, 41(3)
Experimental assessment of bitumen coat-resistance to impact… 
www.theijes.com The IJES Page 33 
[11]. Higgins, R.A. (1993). Engineering Metallurgy-Applied Physical Metallurgy, 6th Edn.. Arnold, Hodder Headline Group, London 
pp:. 507-537. 
[12]. Laque, F.I. (1975). Marine Corrosion. A Wiley-Interscience Publication, New York, pp:. 12-317 
[13]. Pain. Dec. Con. (1995). Painting and Decorating Craftman’s Manual and Textbook, 8th, Edn. Published by Painting and 
Decorating Contractors of America, Fairfax Va, pp: 7-15 
[14]. Pludek, V.R. (1977). Design and Corrosion Control. The Macmillan Press Limited, London. pp.: 36-390 
[15]. Guma T.N; Madakson P.B; Yawas, D.S; and Aku, S.Y, (2010), Effects of Some Bitumen Coating Treatments on the Hardness 
Corrosion of Low Carbon Steel. Int. Res. J. Eng. Sc. & Tech.7(!), Edna-Ben Publishers, Owerri, Nigeria 
[16]. Guma T.N; Madakson P.B; Yawas, D.S; and Aku, S.Y, (2011a), Assessment of Capability Levels of Bitumen from Some 
Nigerian Sources to Coat-inhibit Tensile Strength Corrosion of Low Carbon Steel. Int. J Eng. Sc. 3(1), Pan-African Book 
Company, Accra, Ghana 
[17]. Guma T.N; Madakson P.B; Yawas, D.S; and Aku, S.Y, (2011b). Assessment of Capability Levels of Bitumen from Some 
Nigerian Sources to Coat-inhibit Impact Strength Corrosion of Low Carbon Steel. Int. J. Mech. Eng., 3(1), Blackwell Academic 
Journals Lagos, Nigeria 
[18]. Guma T.N; Madakson P.B; Yawas, D.S; and Aku, S.Y, (2013a). Effects of Some Bitumen Coating Treatments on the Corrosion 
Fatigue Strength of Low Carbon Steel. Research Desk-Int. J. Sc. & Tech. 2(1) 
[19]. Guma T.N; Madakson P.B; Yawas, D.S; and Aku, S.Y, (2013b). Characterization of Working Thicknesses of some Bath-Dip- 
Produced Corrosion-Protective Bitumen Coatings on Polish-Prepared Low Carbon Steel. Int. J. Eng. Res. & Dev. 6(12) 
[20]. Guma T.N. and Oguchi C.I.C. (2011). Field Test Assessment of Corrosivity of River Kaduna to Mild Steel. PeCop J. Sci. Eng. & 
Tech. 4 (1&2). PeCop Res. Nig. Ltd. Bauchi, Nigeria. 
[21]. Holman J.P. (1984). Experimental Methods for Engineers, 4th Edn. J.P. Holman & W.J Gajda-Singapore McGraw Hill Co. pp: 
15-40 
[22]. Miller, I. and Freund, J.E. (1987). Probability and Statistics for Engineers. Prentice Hall of India Private Ltd. New Delhi, India, 
pp: 153-160 
[23]. INTERNET {2012): Nigerian bitumen. http://farriconsulting.blogspot.com/2011/02/bitumen-exploitation-and-exploration-in. 
htme (7/10/2012) 
[24]. Barton, K. (1976). Protection against Atmospheric Corrosion: Theories and Methods. John Wiley and Sons Limited London, 
England, pp: 1-182 
[25]. ASM (1975). Metals Handbook Vol. 10: Analysis and Prevention. Published by the ASM Handbook Committee, American 
Society for Metals, Metals Park Ohio, USA pp: 168 -227 
[26]. Cottrell, A. (1985). An Introduction to Metallurgy, 2nd Edition, Edward Arnold Limited, London, England, Pp. 451-523 
[27]. INTERNET (2013a). The Shewart Procedure: Characteristic of Shewart 
[28]. Charts.http://support.sas.com/documentation/cdl/en/qcug/63922/HTML/defau lt (15/12/2013) 
[29]. INTERNET (2013b). What is Quality Control and Control Charts http://www.statoff.com/text/quality.control.charts/ 
(21/12/2013)
Experimental assessment of bitumen coat-resistance to impact… 
www.theijes.com The IJES Page 34 
Fig. 1: 퐗 Chart for the Impact Strength Coat-inhibition values 
Fig. 2: R Chart for the Impact Strength Coat-inhibition values

More Related Content

Viewers also liked

Model based Spatial for Monitoring Surveillance of Fisheries to Ward Illegal ...
Model based Spatial for Monitoring Surveillance of Fisheries to Ward Illegal ...Model based Spatial for Monitoring Surveillance of Fisheries to Ward Illegal ...
Model based Spatial for Monitoring Surveillance of Fisheries to Ward Illegal ...theijes
 
D03504017024
D03504017024D03504017024
D03504017024theijes
 
Disturbance Observer And Optimal Fuzzy Controllers Used In Controlling Force ...
Disturbance Observer And Optimal Fuzzy Controllers Used In Controlling Force ...Disturbance Observer And Optimal Fuzzy Controllers Used In Controlling Force ...
Disturbance Observer And Optimal Fuzzy Controllers Used In Controlling Force ...theijes
 
On Communicative Competence and Students' Performance in English Language
On Communicative Competence and Students' Performance in English LanguageOn Communicative Competence and Students' Performance in English Language
On Communicative Competence and Students' Performance in English Languagetheijes
 
C03501027040
C03501027040C03501027040
C03501027040theijes
 
H0371041047
H0371041047H0371041047
H0371041047theijes
 
E03502023027
E03502023027E03502023027
E03502023027theijes
 
Analysis of Performance of Jack Hammer to Determine the Penetration Rate on D...
Analysis of Performance of Jack Hammer to Determine the Penetration Rate on D...Analysis of Performance of Jack Hammer to Determine the Penetration Rate on D...
Analysis of Performance of Jack Hammer to Determine the Penetration Rate on D...theijes
 
The International Journal of Engineering and Science (The IJES)
The International Journal of Engineering and Science (The IJES)The International Journal of Engineering and Science (The IJES)
The International Journal of Engineering and Science (The IJES)theijes
 
F0362036045
F0362036045F0362036045
F0362036045theijes
 
Measurement of Electromagnetic Waves Radiated from Base Transceiver Stations...
	Measurement of Electromagnetic Waves Radiated from Base Transceiver Stations...	Measurement of Electromagnetic Waves Radiated from Base Transceiver Stations...
Measurement of Electromagnetic Waves Radiated from Base Transceiver Stations...theijes
 
B0360106010
B0360106010B0360106010
B0360106010theijes
 
J0381057059
J0381057059J0381057059
J0381057059theijes
 
E0371019024
E0371019024E0371019024
E0371019024theijes
 
The Effect of Gamma Irradiation on the Radiofrequency Dielectric Dispersion P...
The Effect of Gamma Irradiation on the Radiofrequency Dielectric Dispersion P...The Effect of Gamma Irradiation on the Radiofrequency Dielectric Dispersion P...
The Effect of Gamma Irradiation on the Radiofrequency Dielectric Dispersion P...theijes
 
F03601032037
F03601032037F03601032037
F03601032037theijes
 
H03503045055
H03503045055H03503045055
H03503045055theijes
 
Stress of Environmental Pollution on Zooplanktons and theirComparative Studi...
	Stress of Environmental Pollution on Zooplanktons and theirComparative Studi...	Stress of Environmental Pollution on Zooplanktons and theirComparative Studi...
Stress of Environmental Pollution on Zooplanktons and theirComparative Studi...theijes
 
A03710105
A03710105A03710105
A03710105theijes
 

Viewers also liked (19)

Model based Spatial for Monitoring Surveillance of Fisheries to Ward Illegal ...
Model based Spatial for Monitoring Surveillance of Fisheries to Ward Illegal ...Model based Spatial for Monitoring Surveillance of Fisheries to Ward Illegal ...
Model based Spatial for Monitoring Surveillance of Fisheries to Ward Illegal ...
 
D03504017024
D03504017024D03504017024
D03504017024
 
Disturbance Observer And Optimal Fuzzy Controllers Used In Controlling Force ...
Disturbance Observer And Optimal Fuzzy Controllers Used In Controlling Force ...Disturbance Observer And Optimal Fuzzy Controllers Used In Controlling Force ...
Disturbance Observer And Optimal Fuzzy Controllers Used In Controlling Force ...
 
On Communicative Competence and Students' Performance in English Language
On Communicative Competence and Students' Performance in English LanguageOn Communicative Competence and Students' Performance in English Language
On Communicative Competence and Students' Performance in English Language
 
C03501027040
C03501027040C03501027040
C03501027040
 
H0371041047
H0371041047H0371041047
H0371041047
 
E03502023027
E03502023027E03502023027
E03502023027
 
Analysis of Performance of Jack Hammer to Determine the Penetration Rate on D...
Analysis of Performance of Jack Hammer to Determine the Penetration Rate on D...Analysis of Performance of Jack Hammer to Determine the Penetration Rate on D...
Analysis of Performance of Jack Hammer to Determine the Penetration Rate on D...
 
The International Journal of Engineering and Science (The IJES)
The International Journal of Engineering and Science (The IJES)The International Journal of Engineering and Science (The IJES)
The International Journal of Engineering and Science (The IJES)
 
F0362036045
F0362036045F0362036045
F0362036045
 
Measurement of Electromagnetic Waves Radiated from Base Transceiver Stations...
	Measurement of Electromagnetic Waves Radiated from Base Transceiver Stations...	Measurement of Electromagnetic Waves Radiated from Base Transceiver Stations...
Measurement of Electromagnetic Waves Radiated from Base Transceiver Stations...
 
B0360106010
B0360106010B0360106010
B0360106010
 
J0381057059
J0381057059J0381057059
J0381057059
 
E0371019024
E0371019024E0371019024
E0371019024
 
The Effect of Gamma Irradiation on the Radiofrequency Dielectric Dispersion P...
The Effect of Gamma Irradiation on the Radiofrequency Dielectric Dispersion P...The Effect of Gamma Irradiation on the Radiofrequency Dielectric Dispersion P...
The Effect of Gamma Irradiation on the Radiofrequency Dielectric Dispersion P...
 
F03601032037
F03601032037F03601032037
F03601032037
 
H03503045055
H03503045055H03503045055
H03503045055
 
Stress of Environmental Pollution on Zooplanktons and theirComparative Studi...
	Stress of Environmental Pollution on Zooplanktons and theirComparative Studi...	Stress of Environmental Pollution on Zooplanktons and theirComparative Studi...
Stress of Environmental Pollution on Zooplanktons and theirComparative Studi...
 
A03710105
A03710105A03710105
A03710105
 

Similar to Experimental assessment of bitumen coat-resistance to impact strength corrosion deterioration of low carbon steel using shewart charts

International Journal of Engineering Research and Development (IJERD)
International Journal of Engineering Research and Development (IJERD)International Journal of Engineering Research and Development (IJERD)
International Journal of Engineering Research and Development (IJERD)IJERD Editor
 
The International Journal of Engineering and Science (The IJES)
The International Journal of Engineering and Science (The IJES)The International Journal of Engineering and Science (The IJES)
The International Journal of Engineering and Science (The IJES)theijes
 
Utilization of Melon and Snail Shell Waste Mixtures in the Carburization of M...
Utilization of Melon and Snail Shell Waste Mixtures in the Carburization of M...Utilization of Melon and Snail Shell Waste Mixtures in the Carburization of M...
Utilization of Melon and Snail Shell Waste Mixtures in the Carburization of M...ijtsrd
 
Comparative study of tribological characteristics of
Comparative study of tribological characteristics ofComparative study of tribological characteristics of
Comparative study of tribological characteristics ofeSAT Publishing House
 
Comparative study of tribological characteristics of aa2024+10% fly ash compo...
Comparative study of tribological characteristics of aa2024+10% fly ash compo...Comparative study of tribological characteristics of aa2024+10% fly ash compo...
Comparative study of tribological characteristics of aa2024+10% fly ash compo...eSAT Journals
 
A03404001007
A03404001007A03404001007
A03404001007theijes
 
Mechanical properties of heavy weight concrete using heavy weight coarse aggr...
Mechanical properties of heavy weight concrete using heavy weight coarse aggr...Mechanical properties of heavy weight concrete using heavy weight coarse aggr...
Mechanical properties of heavy weight concrete using heavy weight coarse aggr...eSAT Publishing House
 
Correlation between Soil Properties and External Corrosion Growth rate of Car...
Correlation between Soil Properties and External Corrosion Growth rate of Car...Correlation between Soil Properties and External Corrosion Growth rate of Car...
Correlation between Soil Properties and External Corrosion Growth rate of Car...theijes
 
X-Ray Diffraction Analysis of the Microscopies of Some Corrosion-Protective B...
X-Ray Diffraction Analysis of the Microscopies of Some Corrosion-Protective B...X-Ray Diffraction Analysis of the Microscopies of Some Corrosion-Protective B...
X-Ray Diffraction Analysis of the Microscopies of Some Corrosion-Protective B...IJMER
 
Experimental investigations on strength, durability,
Experimental investigations on strength, durability,Experimental investigations on strength, durability,
Experimental investigations on strength, durability,eSAT Publishing House
 
A REVIEW ON SYNTHESIS AND DEVELOPMENT OF SUPERHYDROPHOBIC COATING
A REVIEW ON SYNTHESIS AND DEVELOPMENT OF SUPERHYDROPHOBIC COATINGA REVIEW ON SYNTHESIS AND DEVELOPMENT OF SUPERHYDROPHOBIC COATING
A REVIEW ON SYNTHESIS AND DEVELOPMENT OF SUPERHYDROPHOBIC COATINGIRJET Journal
 
IRJET- Impact of Accelerated Corrosion Test in Flexural Behaviour of RC B...
IRJET-  	  Impact of Accelerated Corrosion Test in Flexural Behaviour of RC B...IRJET-  	  Impact of Accelerated Corrosion Test in Flexural Behaviour of RC B...
IRJET- Impact of Accelerated Corrosion Test in Flexural Behaviour of RC B...IRJET Journal
 
Effect of cold swaging on the mechanical and microstructure characteristics o...
Effect of cold swaging on the mechanical and microstructure characteristics o...Effect of cold swaging on the mechanical and microstructure characteristics o...
Effect of cold swaging on the mechanical and microstructure characteristics o...eSAT Journals
 
TO STUDY THE EFFECT OF ACCELERATED CURING ON THE STRENGTH OF THE CONCRETE INC...
TO STUDY THE EFFECT OF ACCELERATED CURING ON THE STRENGTH OF THE CONCRETE INC...TO STUDY THE EFFECT OF ACCELERATED CURING ON THE STRENGTH OF THE CONCRETE INC...
TO STUDY THE EFFECT OF ACCELERATED CURING ON THE STRENGTH OF THE CONCRETE INC...IRJET Journal
 
Experimental investigation of Solid Particle Erosion of Brass, Stainless Stee...
Experimental investigation of Solid Particle Erosion of Brass, Stainless Stee...Experimental investigation of Solid Particle Erosion of Brass, Stainless Stee...
Experimental investigation of Solid Particle Erosion of Brass, Stainless Stee...IRJET Journal
 
Material Characterization of Buried GFRP Pipeline Failed during Hydrostatic T...
Material Characterization of Buried GFRP Pipeline Failed during Hydrostatic T...Material Characterization of Buried GFRP Pipeline Failed during Hydrostatic T...
Material Characterization of Buried GFRP Pipeline Failed during Hydrostatic T...IRJET Journal
 
IRJET- Improving the Performance of M42 Twist Drill Tool
IRJET- Improving the Performance of M42 Twist Drill ToolIRJET- Improving the Performance of M42 Twist Drill Tool
IRJET- Improving the Performance of M42 Twist Drill ToolIRJET Journal
 

Similar to Experimental assessment of bitumen coat-resistance to impact strength corrosion deterioration of low carbon steel using shewart charts (20)

International Journal of Engineering Research and Development (IJERD)
International Journal of Engineering Research and Development (IJERD)International Journal of Engineering Research and Development (IJERD)
International Journal of Engineering Research and Development (IJERD)
 
The International Journal of Engineering and Science (The IJES)
The International Journal of Engineering and Science (The IJES)The International Journal of Engineering and Science (The IJES)
The International Journal of Engineering and Science (The IJES)
 
Vol. 1 (3), 2014, 71 78
Vol. 1 (3), 2014, 71 78Vol. 1 (3), 2014, 71 78
Vol. 1 (3), 2014, 71 78
 
Utilization of Melon and Snail Shell Waste Mixtures in the Carburization of M...
Utilization of Melon and Snail Shell Waste Mixtures in the Carburization of M...Utilization of Melon and Snail Shell Waste Mixtures in the Carburization of M...
Utilization of Melon and Snail Shell Waste Mixtures in the Carburization of M...
 
Comparative study of tribological characteristics of
Comparative study of tribological characteristics ofComparative study of tribological characteristics of
Comparative study of tribological characteristics of
 
Comparative study of tribological characteristics of aa2024+10% fly ash compo...
Comparative study of tribological characteristics of aa2024+10% fly ash compo...Comparative study of tribological characteristics of aa2024+10% fly ash compo...
Comparative study of tribological characteristics of aa2024+10% fly ash compo...
 
A03404001007
A03404001007A03404001007
A03404001007
 
Introduction to corrosion
Introduction to corrosionIntroduction to corrosion
Introduction to corrosion
 
Mechanical properties of heavy weight concrete using heavy weight coarse aggr...
Mechanical properties of heavy weight concrete using heavy weight coarse aggr...Mechanical properties of heavy weight concrete using heavy weight coarse aggr...
Mechanical properties of heavy weight concrete using heavy weight coarse aggr...
 
SHAKEEL PREC FIRST
SHAKEEL PREC FIRSTSHAKEEL PREC FIRST
SHAKEEL PREC FIRST
 
Correlation between Soil Properties and External Corrosion Growth rate of Car...
Correlation between Soil Properties and External Corrosion Growth rate of Car...Correlation between Soil Properties and External Corrosion Growth rate of Car...
Correlation between Soil Properties and External Corrosion Growth rate of Car...
 
X-Ray Diffraction Analysis of the Microscopies of Some Corrosion-Protective B...
X-Ray Diffraction Analysis of the Microscopies of Some Corrosion-Protective B...X-Ray Diffraction Analysis of the Microscopies of Some Corrosion-Protective B...
X-Ray Diffraction Analysis of the Microscopies of Some Corrosion-Protective B...
 
Experimental investigations on strength, durability,
Experimental investigations on strength, durability,Experimental investigations on strength, durability,
Experimental investigations on strength, durability,
 
A REVIEW ON SYNTHESIS AND DEVELOPMENT OF SUPERHYDROPHOBIC COATING
A REVIEW ON SYNTHESIS AND DEVELOPMENT OF SUPERHYDROPHOBIC COATINGA REVIEW ON SYNTHESIS AND DEVELOPMENT OF SUPERHYDROPHOBIC COATING
A REVIEW ON SYNTHESIS AND DEVELOPMENT OF SUPERHYDROPHOBIC COATING
 
IRJET- Impact of Accelerated Corrosion Test in Flexural Behaviour of RC B...
IRJET-  	  Impact of Accelerated Corrosion Test in Flexural Behaviour of RC B...IRJET-  	  Impact of Accelerated Corrosion Test in Flexural Behaviour of RC B...
IRJET- Impact of Accelerated Corrosion Test in Flexural Behaviour of RC B...
 
Effect of cold swaging on the mechanical and microstructure characteristics o...
Effect of cold swaging on the mechanical and microstructure characteristics o...Effect of cold swaging on the mechanical and microstructure characteristics o...
Effect of cold swaging on the mechanical and microstructure characteristics o...
 
TO STUDY THE EFFECT OF ACCELERATED CURING ON THE STRENGTH OF THE CONCRETE INC...
TO STUDY THE EFFECT OF ACCELERATED CURING ON THE STRENGTH OF THE CONCRETE INC...TO STUDY THE EFFECT OF ACCELERATED CURING ON THE STRENGTH OF THE CONCRETE INC...
TO STUDY THE EFFECT OF ACCELERATED CURING ON THE STRENGTH OF THE CONCRETE INC...
 
Experimental investigation of Solid Particle Erosion of Brass, Stainless Stee...
Experimental investigation of Solid Particle Erosion of Brass, Stainless Stee...Experimental investigation of Solid Particle Erosion of Brass, Stainless Stee...
Experimental investigation of Solid Particle Erosion of Brass, Stainless Stee...
 
Material Characterization of Buried GFRP Pipeline Failed during Hydrostatic T...
Material Characterization of Buried GFRP Pipeline Failed during Hydrostatic T...Material Characterization of Buried GFRP Pipeline Failed during Hydrostatic T...
Material Characterization of Buried GFRP Pipeline Failed during Hydrostatic T...
 
IRJET- Improving the Performance of M42 Twist Drill Tool
IRJET- Improving the Performance of M42 Twist Drill ToolIRJET- Improving the Performance of M42 Twist Drill Tool
IRJET- Improving the Performance of M42 Twist Drill Tool
 

Recently uploaded

EIS-Webinar-Prompt-Knowledge-Eng-2024-04-08.pptx
EIS-Webinar-Prompt-Knowledge-Eng-2024-04-08.pptxEIS-Webinar-Prompt-Knowledge-Eng-2024-04-08.pptx
EIS-Webinar-Prompt-Knowledge-Eng-2024-04-08.pptxEarley Information Science
 
Scaling API-first – The story of a global engineering organization
Scaling API-first – The story of a global engineering organizationScaling API-first – The story of a global engineering organization
Scaling API-first – The story of a global engineering organizationRadu Cotescu
 
08448380779 Call Girls In Greater Kailash - I Women Seeking Men
08448380779 Call Girls In Greater Kailash - I Women Seeking Men08448380779 Call Girls In Greater Kailash - I Women Seeking Men
08448380779 Call Girls In Greater Kailash - I Women Seeking MenDelhi Call girls
 
What Are The Drone Anti-jamming Systems Technology?
What Are The Drone Anti-jamming Systems Technology?What Are The Drone Anti-jamming Systems Technology?
What Are The Drone Anti-jamming Systems Technology?Antenna Manufacturer Coco
 
Tech Trends Report 2024 Future Today Institute.pdf
Tech Trends Report 2024 Future Today Institute.pdfTech Trends Report 2024 Future Today Institute.pdf
Tech Trends Report 2024 Future Today Institute.pdfhans926745
 
ProductAnonymous-April2024-WinProductDiscovery-MelissaKlemke
ProductAnonymous-April2024-WinProductDiscovery-MelissaKlemkeProductAnonymous-April2024-WinProductDiscovery-MelissaKlemke
ProductAnonymous-April2024-WinProductDiscovery-MelissaKlemkeProduct Anonymous
 
Raspberry Pi 5: Challenges and Solutions in Bringing up an OpenGL/Vulkan Driv...
Raspberry Pi 5: Challenges and Solutions in Bringing up an OpenGL/Vulkan Driv...Raspberry Pi 5: Challenges and Solutions in Bringing up an OpenGL/Vulkan Driv...
Raspberry Pi 5: Challenges and Solutions in Bringing up an OpenGL/Vulkan Driv...Igalia
 
Partners Life - Insurer Innovation Award 2024
Partners Life - Insurer Innovation Award 2024Partners Life - Insurer Innovation Award 2024
Partners Life - Insurer Innovation Award 2024The Digital Insurer
 
Handwritten Text Recognition for manuscripts and early printed texts
Handwritten Text Recognition for manuscripts and early printed textsHandwritten Text Recognition for manuscripts and early printed texts
Handwritten Text Recognition for manuscripts and early printed textsMaria Levchenko
 
Strategize a Smooth Tenant-to-tenant Migration and Copilot Takeoff
Strategize a Smooth Tenant-to-tenant Migration and Copilot TakeoffStrategize a Smooth Tenant-to-tenant Migration and Copilot Takeoff
Strategize a Smooth Tenant-to-tenant Migration and Copilot Takeoffsammart93
 
presentation ICT roal in 21st century education
presentation ICT roal in 21st century educationpresentation ICT roal in 21st century education
presentation ICT roal in 21st century educationjfdjdjcjdnsjd
 
IAC 2024 - IA Fast Track to Search Focused AI Solutions
IAC 2024 - IA Fast Track to Search Focused AI SolutionsIAC 2024 - IA Fast Track to Search Focused AI Solutions
IAC 2024 - IA Fast Track to Search Focused AI SolutionsEnterprise Knowledge
 
The Role of Taxonomy and Ontology in Semantic Layers - Heather Hedden.pdf
The Role of Taxonomy and Ontology in Semantic Layers - Heather Hedden.pdfThe Role of Taxonomy and Ontology in Semantic Layers - Heather Hedden.pdf
The Role of Taxonomy and Ontology in Semantic Layers - Heather Hedden.pdfEnterprise Knowledge
 
04-2024-HHUG-Sales-and-Marketing-Alignment.pptx
04-2024-HHUG-Sales-and-Marketing-Alignment.pptx04-2024-HHUG-Sales-and-Marketing-Alignment.pptx
04-2024-HHUG-Sales-and-Marketing-Alignment.pptxHampshireHUG
 
GenAI Risks & Security Meetup 01052024.pdf
GenAI Risks & Security Meetup 01052024.pdfGenAI Risks & Security Meetup 01052024.pdf
GenAI Risks & Security Meetup 01052024.pdflior mazor
 
The 7 Things I Know About Cyber Security After 25 Years | April 2024
The 7 Things I Know About Cyber Security After 25 Years | April 2024The 7 Things I Know About Cyber Security After 25 Years | April 2024
The 7 Things I Know About Cyber Security After 25 Years | April 2024Rafal Los
 
08448380779 Call Girls In Friends Colony Women Seeking Men
08448380779 Call Girls In Friends Colony Women Seeking Men08448380779 Call Girls In Friends Colony Women Seeking Men
08448380779 Call Girls In Friends Colony Women Seeking MenDelhi Call girls
 
🐬 The future of MySQL is Postgres 🐘
🐬  The future of MySQL is Postgres   🐘🐬  The future of MySQL is Postgres   🐘
🐬 The future of MySQL is Postgres 🐘RTylerCroy
 
From Event to Action: Accelerate Your Decision Making with Real-Time Automation
From Event to Action: Accelerate Your Decision Making with Real-Time AutomationFrom Event to Action: Accelerate Your Decision Making with Real-Time Automation
From Event to Action: Accelerate Your Decision Making with Real-Time AutomationSafe Software
 
CNv6 Instructor Chapter 6 Quality of Service
CNv6 Instructor Chapter 6 Quality of ServiceCNv6 Instructor Chapter 6 Quality of Service
CNv6 Instructor Chapter 6 Quality of Servicegiselly40
 

Recently uploaded (20)

EIS-Webinar-Prompt-Knowledge-Eng-2024-04-08.pptx
EIS-Webinar-Prompt-Knowledge-Eng-2024-04-08.pptxEIS-Webinar-Prompt-Knowledge-Eng-2024-04-08.pptx
EIS-Webinar-Prompt-Knowledge-Eng-2024-04-08.pptx
 
Scaling API-first – The story of a global engineering organization
Scaling API-first – The story of a global engineering organizationScaling API-first – The story of a global engineering organization
Scaling API-first – The story of a global engineering organization
 
08448380779 Call Girls In Greater Kailash - I Women Seeking Men
08448380779 Call Girls In Greater Kailash - I Women Seeking Men08448380779 Call Girls In Greater Kailash - I Women Seeking Men
08448380779 Call Girls In Greater Kailash - I Women Seeking Men
 
What Are The Drone Anti-jamming Systems Technology?
What Are The Drone Anti-jamming Systems Technology?What Are The Drone Anti-jamming Systems Technology?
What Are The Drone Anti-jamming Systems Technology?
 
Tech Trends Report 2024 Future Today Institute.pdf
Tech Trends Report 2024 Future Today Institute.pdfTech Trends Report 2024 Future Today Institute.pdf
Tech Trends Report 2024 Future Today Institute.pdf
 
ProductAnonymous-April2024-WinProductDiscovery-MelissaKlemke
ProductAnonymous-April2024-WinProductDiscovery-MelissaKlemkeProductAnonymous-April2024-WinProductDiscovery-MelissaKlemke
ProductAnonymous-April2024-WinProductDiscovery-MelissaKlemke
 
Raspberry Pi 5: Challenges and Solutions in Bringing up an OpenGL/Vulkan Driv...
Raspberry Pi 5: Challenges and Solutions in Bringing up an OpenGL/Vulkan Driv...Raspberry Pi 5: Challenges and Solutions in Bringing up an OpenGL/Vulkan Driv...
Raspberry Pi 5: Challenges and Solutions in Bringing up an OpenGL/Vulkan Driv...
 
Partners Life - Insurer Innovation Award 2024
Partners Life - Insurer Innovation Award 2024Partners Life - Insurer Innovation Award 2024
Partners Life - Insurer Innovation Award 2024
 
Handwritten Text Recognition for manuscripts and early printed texts
Handwritten Text Recognition for manuscripts and early printed textsHandwritten Text Recognition for manuscripts and early printed texts
Handwritten Text Recognition for manuscripts and early printed texts
 
Strategize a Smooth Tenant-to-tenant Migration and Copilot Takeoff
Strategize a Smooth Tenant-to-tenant Migration and Copilot TakeoffStrategize a Smooth Tenant-to-tenant Migration and Copilot Takeoff
Strategize a Smooth Tenant-to-tenant Migration and Copilot Takeoff
 
presentation ICT roal in 21st century education
presentation ICT roal in 21st century educationpresentation ICT roal in 21st century education
presentation ICT roal in 21st century education
 
IAC 2024 - IA Fast Track to Search Focused AI Solutions
IAC 2024 - IA Fast Track to Search Focused AI SolutionsIAC 2024 - IA Fast Track to Search Focused AI Solutions
IAC 2024 - IA Fast Track to Search Focused AI Solutions
 
The Role of Taxonomy and Ontology in Semantic Layers - Heather Hedden.pdf
The Role of Taxonomy and Ontology in Semantic Layers - Heather Hedden.pdfThe Role of Taxonomy and Ontology in Semantic Layers - Heather Hedden.pdf
The Role of Taxonomy and Ontology in Semantic Layers - Heather Hedden.pdf
 
04-2024-HHUG-Sales-and-Marketing-Alignment.pptx
04-2024-HHUG-Sales-and-Marketing-Alignment.pptx04-2024-HHUG-Sales-and-Marketing-Alignment.pptx
04-2024-HHUG-Sales-and-Marketing-Alignment.pptx
 
GenAI Risks & Security Meetup 01052024.pdf
GenAI Risks & Security Meetup 01052024.pdfGenAI Risks & Security Meetup 01052024.pdf
GenAI Risks & Security Meetup 01052024.pdf
 
The 7 Things I Know About Cyber Security After 25 Years | April 2024
The 7 Things I Know About Cyber Security After 25 Years | April 2024The 7 Things I Know About Cyber Security After 25 Years | April 2024
The 7 Things I Know About Cyber Security After 25 Years | April 2024
 
08448380779 Call Girls In Friends Colony Women Seeking Men
08448380779 Call Girls In Friends Colony Women Seeking Men08448380779 Call Girls In Friends Colony Women Seeking Men
08448380779 Call Girls In Friends Colony Women Seeking Men
 
🐬 The future of MySQL is Postgres 🐘
🐬  The future of MySQL is Postgres   🐘🐬  The future of MySQL is Postgres   🐘
🐬 The future of MySQL is Postgres 🐘
 
From Event to Action: Accelerate Your Decision Making with Real-Time Automation
From Event to Action: Accelerate Your Decision Making with Real-Time AutomationFrom Event to Action: Accelerate Your Decision Making with Real-Time Automation
From Event to Action: Accelerate Your Decision Making with Real-Time Automation
 
CNv6 Instructor Chapter 6 Quality of Service
CNv6 Instructor Chapter 6 Quality of ServiceCNv6 Instructor Chapter 6 Quality of Service
CNv6 Instructor Chapter 6 Quality of Service
 

Experimental assessment of bitumen coat-resistance to impact strength corrosion deterioration of low carbon steel using shewart charts

  • 1. The International Journal Of Engineering And Science (IJES) || Volume || 3 || Issue || 8 || Pages || 27-34 || 2014 || ISSN (e): 2319 – 1813 ISSN (p): 2319 – 1805 www.theijes.com The IJES Page 27 Experimental assessment of bitumen coat-resistance to impact strength corrosion deterioration of low carbon steel using shewart charts 1, T.N. Guma, 2, S.Y. Aku, 3, D.S. Yawas, 4, M. Dauda 1, Department of Mechanical Engineering Nigerian Defence Academy, P.M.B 2109, Kaduna Kaduna State, Nigeria Tel: +2348068747385 (GSM) 2, 3, 4, Department of Mechanical Engineering Ahmadu Bello University, Zaria, Kaduna State, Nigeria --------------------------------------------------------------ABSTRACT------------------------------------------------------- Maximum information on the performance of a production or an experimental process can be obtained by employing statistical methods. A study of various coat-resistance levels to corrosion deterioration of mechanical properties of low carbon steel by some bitumen from Nigerian resources has previously been undertaken through parallel experimental processes. The purpose of this paper is to present an assessment of overall levels of variation in such processes through inferences drawn from impact strength using proper data size and the charts as a case study. 78 ASTM impact specimens were similarly prepared from procured rods of the steel and three clear bitumen samples harvested at different critical resource sites in Nigeria for the study. Three of the specimens as a set were each bath-dip-coated to a working thickness of 0.81mm with a separate bitumen sample and the level of the coating’s resistance to corrosion deterioration of impact fracture strength of the specimens determined through the same experimental process. This was repeated at different times with each of the remaining sets. The overall appropriately obtained information was tabulated and analyzed using the charts. The analysis indicated that the quality of the harvested bitumen samples and their corrosion coat protection levels of the steel strength and the overall as-conducted experimental process were in statistical quality control. Keywords: Low carbon steel, mechanical properties, deterioration, Nigerian bitumen, protection levels, process, variation, acceptability --------------------------------------------------------------------------------------------------------------------------------------- Date of Submission: 04 Aug 2014 Date of Publication: 20 August 2014 --------------------------------------------------------------------------------------------------------------------------------------- I. INTRODUCTION Corrosion costs for industrialized nations are put at 5% of their gross national domestic products (GNDP). In developing countries, the general level of corrosion-consciousness and counteractions are however minimal and the deleterious phenomenon has more or less silently been taking its toll directly and indirectly on their economies and people’s lives in many quarters. Corrosion is preponderant in the oil and gas industry. The total cost of corrosion to the industry worldwide is huge and staggering. A figure of 300 billion US dollars was mentioned in the United States of America alone in 1998. It was estimated that only 45% of this amount was economically justifiable using the existing technologies of corrosion prevention. The cost of pipeline corrosion alone can also be huge. For example, corrosion and its related effects cost the United States of America transmission pipeline companies as much as 8.6 billion dollars per year (Guma et al, 2010; 2011a ,b and 2013a). The most important corrosion problem in all quarters worldwide is the rusting of structural steelworks. Rusting is a uniform or nearly uniform form of corrosion and accounts to about 90% of all corrosion problems in the total economy. The amount of steel which rusts away for lack of adequate protection amounts to about 1000 tonnes every single day (Higgins, 1993). Rusting can impair the levels of mechanical properties of steel to the extent that it may not perform satisfactorily in structural service or even collapse. Although the most steel- corrosive natural environments include; acidic soils, highly saline soils and heavy clays of high electrical conductivity, organic deposits such as silt and harbor mud, and sea water; the material rusts at almost incredible rates on the surf beaches in the tropics where it is exposed to continuous spray of sea salts particularly sodium chloride. (Laque, 1975; Cottrell, 1985; Guma et al, 2013a and Guma and Oguchi, 2011). The rate of rusting increases with the salt and moisture contents of air. At a very high salt content of 11.1% and dew point, a rate of 0.95mm/yr was obtained for ingot iron by Ambler and Bain (2012) at 50 yards from the tropical surf beach in Lagos, Nigeria.
  • 2. Experimental assessment of bitumen coat-resistance to impact… www.theijes.com The IJES Page 28 Nigeria’s economy is about 85% petroleum-dependent. The country is a developing nation that is groping for ways to catapult her to the status of an industrialized nation without necessarily preparing for it. No government in Nigeria has yet come to grips with the reality of the devastating effect of corrosion on the country’s economy. The country is endowed with abundant critical and strategic resources that can help her to easily attain the industrial status if managed properly but so far, the utilization of these resources as raw materials is dependent wholly on the industrialized economies. The petroleum industry upon which her economy is so dependent is prone to corrosion ravages. About 80% of her refinery equipment and transmission pipelines are made of carbon steel particularly of the low carbon type. The petroleum products are transported from one location to another through pipelines which pass through the sea, rivers, ground or surface water in urban and rural areas. The deterioration of these pipelines and other aspects of plants due to corrosion is a huge cost to the country in terms of; subsequent oil leakage and spillage, violation of environmental and safety laws, product contaminations, reduction of efficiency of operating plants, loss of production, over design, protection and maintenance, replacements of parts, fire and other general losses. Yet all the materials of construction in the country are imported, an enormous amount of foreign exchange is lost for combating corrosion in the country. These necessitate professional and technological challenges on how best to protect these pipelines with novel approaches (Ali, 1998; Wami, 1998; Yawas, 2006, Guma et al, 2010; 2011a, b and 2013a). There are many approaches to combating corrosion; however, the most economical, versatile, widely and commonly used method is by paints or organic coatings. It is estimated that about 90% of all steel surfaces are protected by paints or organic coatings (Laque, 1975 and Pludek, 1977). Bitumen is an important organic material that has been in use for coat-protection of steelworks in corrosion-preponderant industries such as petroleum or other chemical and water industries and coatings based on it provide excellent resistance to industrial pollution. The grades and service attributes of bitumen obtained from different sources can however vary widely. Nigeria is blessed with abundant reserves of natural bitumen amounting to about 14.46 billion barrels whose quality varies from location to location and capability for synthesizing large quantities of bitumen from petroleum, but there has been no public-available coating codes of practice with her bitumen (Olalere, 1991; Fed. Min. Sol. Mine. Dev; 2006; INTERNET, 2012 and Guma et al, 2013a). Guma et al (2010; 2011a, b and 2013a) undertook a study to evaluate and provide information on suitability levels of various coating treatments of bitumen from the resources as inhibitors of steel corrosion. In that study; coat-resistances to corrosion deterioration of hardness, fatigue, tensile and impact fracture strengths of a low carbon steel by three harvested bitumen samples designated as Ondo S-A, Ondo S-B, and KPB from different critical resource sites in the country were evaluated. Five different coating treatments of working thicknesses in the range of 0.81- 1.46mm were used. The obtained results showed different appreciable inhibition performance levels of practical importance that generally increased with the working thickness within the range of 53.36 to about 97.42%. The experimental processes from which the information were obtained included: procurement of the bitumen samples and low carbon steel rods, analyses of chemical composition and microstructures of the steel rods to ascertain those that were indeed low carbon steel and consistent in structure, analyses of physico-chemical properties to assess grades of bitumen from the sample sources, machine-production of 33 specimens for ASTM E8 tensile; 33 for ASTM E23 (impact); 33 for ASTM 384 (Knoop micro-hardness); and 175 for ASTM E92-82 (fatigue) tests with the rods, polishing the produced specimens to an average surface finish of 25 microns, normalization of the specimens to relieve them of any machining stresses, heating each bitumen sample to a desired temperature and bitumen-coating sets of specimen types to various thicknesses by bath- dipping them in the heated bitumen for a period of 30 seconds, removing the specimens from the bath and allowing the coatings on them to cool to room temperature and statistically determining the working coating thickness for each case of bath coating temperature used, place-exposing the coated specimens continuously to a design-produced acidic and chloride corrosive medium for 50 days to undergo any possible level of corrosion, removing the specimens and subjecting each as well as the others for control to appropriate mechanical tests, collection of the test results and appropriately evaluating the resistance level of each coating thickness of each bitumen sample to corrosion deterioration of each mechanical property, etc. Although these processes were so carried out for each mechanical property and coating thickness, any one or more unknown causes from them might have affected the true inhibition data values from the overall tests. This is because variations in quality characteristic are inevitable, however well a process may be controlled and tests carried out (Holman, 1984). The variation is attributable to two types of causes, namely; i Natural or chance causes. ii Assignable (special) causes.
  • 3. Experimental assessment of bitumen coat-resistance to impact… www.theijes.com The IJES Page 29 Variations due to material or chance causes are inherent in a process. They are due to multitude of causes which are difficult to identify and uneconomical to eliminate. Furthermore, variations due to chance causes consists of many individual causes with any one chance resulting in only a very minute amount of variation; and follow statistical laws. Such causes include; changes in the process over time and time required taking measurements, errors introduced into the measurement by the instrumentation system, lack of perfection in reading instruments, small variation due to aging of machine or equipment. On the contrast, assignable or special causes of variation are generally due to few individual factors which can be identified and eliminated. Assignable causes do not follow statistical laws and any one of them can result in a very large amount of variation in the output from a process. Some typical assignable causes of variations are; batch defective raw materials, faulty set-ups, and new or inexperienced operators (Holman, 1984; Miller and Freund, 1987; Evans and Lindsay, 1996; Jain, 2005; Jain and Aggarwal, 2008). Statistical methods of experimental and production assessments provide the basis for making decisions, determining errors, precision and general validity of measurements; or performance levels. Statistical process control is a methodology which operators, supervisors and managers use control charts to monitor output to identify and to eliminate special cause of variation in a process. It is a proven technique for reducing scrap and rework, thus, increasing productivity. It also provides the basis for determining process capability and predicting yield from a process. In many industries, suppliers are required to provide evidence of statistical process control to their customers. The commonly used methods for statistical quality control include the average (X ) and range (R) charts; also called Shewart charts, fraction defective (p-chart), and chart for defective (c-chart). Where the characteristic under study can be measured along a scale of measurement, the X and R charts have proved to be of greater values and should be used in preference to the p and c charts. Usually 25 to 30 data values per sample and three to ten samples are collected and used for the X and R charts (Evans and Lindsay, 1996; Jain and Aggarwal, 2008 and INTERNET, 2013a, b). The object in this paper is to understand better the levels of variation in qualities of the as-harvested bitumen samples from Nigerian resources and the overall experimental processes used to obtain their various coat-resistance levels to corrosion deterioration of mechanical properties of a low carbon steel by Guma et al (2010; 2011a, b and 2013a); through inferences from Shewart charts’ analyses of a proper test-obtained data size on the levels by the bitumen samples with impact fracture strength and 0.81mm working thickness as a case study. II. EXPERIMENTAL CONCEPT/METHOD Material Sourcing Low carbon steel rods of diameters 8-10mm were purchased from a supplier in the iron and steel market in Lagos, Nigeria, while two natural bitumen samples with identification names Ondo S-A and Ondo S- B, and a synthetic bitumen sample with name KPB were collected in sufficient quantities from critical bitumen sources in Nigeria for the tests. Ondo S-A was collected from a clear bitumen deposit on the ground surface in a waterlogged area in Ondo state on the outskirts of Agbabu village that adjoined Agbabu-Ore road, and Ondo S- B from a rich deposit underground within the village through a standard extraction hole drilled by early explorers of bitumen in Nigeria. KPB was from bitumen manufactured at Kaduna Refining and Petrochemical Company (KRPC) with the blend of the Nigerian and Iran’s Basara crudes as feedstock (Guma et al, 2010; 2011a, b; 2013a). Test Procedures The elemental average weight composition of each procured rod was determined by the energy dispersive X-ray fluorescence analysis and a chromatographic technique. The obtained composition together with analyses of revealed microstructures of the rods at an optical magnification of 200 confirmed rods that were similar low carbon steel. The obtained composition and microstructure had previously been presented by Guma et al (2010; 2011a, b and 2013a). The confirmed rods were used to machine-produce 26 three-set impact specimens at different occasions according to ASTM E23 test procedure. The sets were designated numbers. 1-26. The number (No.) 1 set was first produced and each specimen of the set similarly machine-polished with various grades of polishing paper, starting with the 250-grade and finishing with the 400 at a profilometer-ascertained average surface finish of 25 microns. Differences in machining parameters can exist and result in various residual stresses among the same type of specimens and have different effects on corrosion and impact strength values of the specimens and cause difficulty and inaccuracy in analysis of true effects of the test corrosion per se on the specimens. The polished specimens were thus normalized to relieve them of any such stresses by heating them in a tubular heat treatment furnace to a temperature of 8500C, holding them there for enough time of two hours, and removing and cooling
  • 4. Experimental assessment of bitumen coat-resistance to impact… www.theijes.com The IJES Page 30 them in air at room-temperature in accordance to Cottrell (1985), Rajan et al (1990), Guma et al ( 2010; 2011a ,b and 2013a, b), and Guma and Oguchi (2011). The normalized specimens were coated by dipping them in the bitumen bath at 2300C. The temperature was chosen within the range of 150-250OC for heating and coat-applying most bitumen (Pain. Dec. Con., 1995; Guma et al, 2010; 2011a, b and 2013a, b). A 20-kg gas-fired heating unit was used to heat a portion of Ondo S- A in a steel container to 2300C. The temperature was monitored by a 0-360oC mercury-in-glass thermometer. A specimen was held on its head with a thin-lip crucible tong and dipped into the bitumen for 30 seconds. This was repeated with a different specimen and portion of Ondo S-B and likewise KPB. This produced a statistically determined overall working coating thickness of 0.81mm with the bitumen samples after the coatings had cooled to room temperature, in accordance with Guma et al ( 2010; 2011a, b and 2013a, b). The coated specimens were fully exposed to a corrosive medium that was design-prepared with a very high factor of aggressiveness in accordance with the principle for laboratory corrosion testing, using Armfield corrosion studies kit. 11.538g of NaCl and 2.308g of concentrated sulphuric acid (H2SO4) were determined with a very accurate digital weighing scale and mixed thoroughly in 1000cm3 of water to get the corrosive medium composed of 30% NaCl + 5% con. H2SO4 + 65% water by mass. The medium was poured to about 70% of the volume capacity of a flat-based 250-ml plastic container in which the specimens had been carefully placed in vertical positions with due consideration to identity of each as-coated with the bitumen samples. Air from the compressor part of the kit was released at a pressure of 0.015 bars in excess of one atmosphere via a 4mm- diameter plastic hose that had its open end immersed to the bottom of the corrosive medium in the container.. This aerated the medium and made it to circulate in an up and down fashion over the specimens at the prevailing room temperature to simulate with a reasonable higher aggressive factors, the specimens’ field exposure to one of the worst natural corrosive environments-the tropical surf beach atmosphere of 100% relative humidity. In that way, the specimens were left continuously exposed to the medium for 50 days at ambient room temperature in the laboratory to undergo any possible level of corrosion (Guma et al, 2010; 2011a, b and 2013b). At the end of the exposure time, the specimens were all removed and tested within two hours of their impact fracture strengths in accordance with ASTM E23 procedures (Choudary, 2003 and Guma et al, 2011b) using the Hounsfield balanced impact strength machine. Each specimen was properly held in the vise of the machine and struck at the position of its notch with two similar pendulums each of mass 2.443kg travelling at a calibrated speed of 5m/s in opposite directions with a kinetic energy of 149.25 Joules from its calibrated standard height to fracture the specimen. The energy remaining after fracture was determined in each case from the height rise of the pendulums and their weights. The difference between the energy input and energy remaining represented the energy absorbed by the specimen. In that way three different data values were collected from the test. The percentage inhibition performance (Xi) on deterioration of the strength with the coating thickness for each case of bitumen sample was evaluated as (Guma et al, 2011b): Xi = (ΔTi /ΔUi) 100……..1 Where ΔTi is the change in the impact fracture energy between the un-coated but corroded (UC) specimens of the steel in the same test corrosive medium as was test-obtained and the coated and corroded steel specimen in the medium. ΔUi is the change in the impact fracture energy between the un-coated and un- corroded (UU) and the UC specimens (Guma et al 2011b). The impact energy values of 87.1 and 93.63 Joules for the UC and UU specimens respectively determined by Guma et al (2011b) were used to evaluate ΔTi and ΔUi. The above process from the machine-production of No. 1 set of specimen to evaluation of Xi from equation 1 was repeated with each of No. 2 to No. 26 three-set specimen at different occasions in accordance with the same test procedure used by Guma et al (2011b). The overall test obtained coat-resistance or inhibition data was tabulated. Evaluation of Requisite Parameters of the Coat-Resistance Performance data for Shewart Charts The average (X ) and range (R) values were evaluated from the test-obtained data on all the steel specimens of sets No. 1- 26 presented in Tables 1a and 1b. For each set (Ni), the average value (푋 푁) for the set was evaluated as (Miller and Freund, 1987):
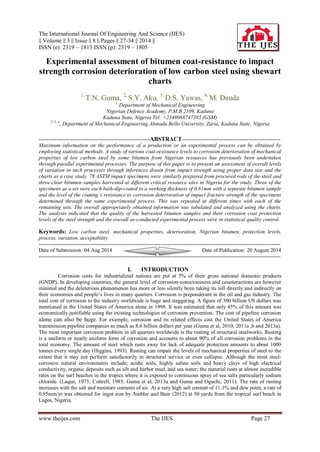
  • 5. Experimental assessment of bitumen coat-resistance to impact… www.theijes.com The IJES Page 31 푋 푁= 푋푖 푖=3 푖=1 13 ………………………………………………..(2) Where, Xi is as obtained from equation 1 for a specimen The corresponding range (Ri) for the set was evaluated as ( Grant and Leavenworth, 1996): Ri = Xi max - Xi min --------------------------- (3) Xi max, Xi min are the least and highest coat-resistance values respectively in each case with a three-set specimen. The average of the average values (푋 ) for the 26 three-set specimen was evaluated as (Miller and Freund, 1987): X = X 푁 푁=26 푁=1 126=47.8846% ………………………..(4) The average (R ) of the ranges (Ri) for the 26 three-set specimens was evaluated as (Jain and Aggarwal, 2008): R = 푅푖 푁=26 푁=1 126=26.846154% ………………………..(5) Where, N is the total number three-set specimen used (N = 26). From these, the upper control limits (UCL), and lower control limits (LCL) for the R and X charts were appropriately evaluated according to Evans and Lindsay (1996), and Grant and Leavenworth (1996) as follows; The upper control limit for the range (R) chart (UCLR) was set as: UCLR = D1R = 2.574(26.846154) = 69.102% -------------------------------- (6a) The lower control limit for the R chart (LCLR) was set as: LC LR = D2R = 0.0 --------------------------------- (6b) The upper control limit for the X chart (UCLX) was set as: UCLX = X + A R = X + 3σ = 47.8846 + 1.023(26.846154) = 75.348216% ------------------ (7a) The lower control limit for the X chart (LCLX) was set as: LCLX = X - A R = X – 3σ = 47.8846 – 1.023(26.846154) = 20.420984% ----------------- (7b) Where; D1, D2, and A are parameters that depend on the sample size (n) for the 푋 and R control charts, and σ is the population standard deviation of the average values for all the three-set specimens and was determined from an equation given by Miller and Freund (1987) and Jain (2005) as: σ= 푋 − 푋 푁 푁=26 푁=1 126=10.459912% ………………………..(8) For the three-set size used, that is n = 3; D1, D2, and A were obtained from data table for X and R charts given by Evans and Lindsay (1996) and Grant and Leavenworth (1996) as; 1.023, 2.574, and 0 respectively. The obtained parameters from equations 1-5, 6a, 6b, 7a and 7b were used to plot the X and R charts of the obtained corrosion coat-resistance data with the bitumen samples. III. RESULTS AND DISCUSSION Results Results of corrosion coat-resistance levels to impact strength deterioration of a low carbon steel specimens by Ondo S-A, Ondo S-B and KPB as were appropriately obtained from a laboratory test process with a more or less working coating thickness of 0.81mm are shown in Table 1a while the appropriately evaluated parameters for the X and R charts using results in Table 1a, are shown in Table 1b. The drawn X and R charts using information presented in Table 1b are shown in Figures 1 and 2 respectively. The upper control limit for the X chart is set at an inhibition performance value of 75.348316% and the lower limit at 20.420984%, while those for the R chart are 69.102 and 0.0% respectively. The average (X ) values vary from the least value of 26% to the highest value of 62%, while the range (R) values from the least value of 5% to the highest value of 52%
  • 6. Experimental assessment of bitumen coat-resistance to impact… www.theijes.com The IJES Page 32 as can be seen from Table 1b and Figures 1 and 2. The centre line (CL) for the X chart is at 47.8864% and R chart at 26.85%. Discussion of Results From the drawn Shewart charts with the bitumen coat-protection levels of corrosion deterioration of impact fracture strength of a low carbon steel shown in Figures 1 and 2, it can be observed that for each chart no point is outside its control limits, the number of points above and below the centre line of each control chart are about the same. The points seem to fall randomly above and below the centre line of each chart and most points are near the centre line with only few close to the control limits. All the obtained data values of each chart fall within its lower and upper control limits and fluctuate randomly without any recognizable pattern as can be observed from Figures 1 and 2. This indicates that the overall experimental process was quite in statistical quality control, so that there was no special cause of variation to be eliminated in the quality of the test bitumen samples, low carbon steel, facilities and the overall conduction of the experimental process. IV. SUMMARY AND CONCLUSION An experimental or production process will always exhibit some variations in outputs or levels of performance when repeated a number of times in the same process with even precise and accurate facilities using similar materials, samples or specimens. This variability can be due to multitude of natural or chance causes which are difficult to identify and uneconomical to eliminate or assignable (special) causes due to a few individual factors which can be identified and eliminated. The data obtained from such a process may therefore be an assembly of readings but not an exact and reliable result. The data is however considered acceptable or reliable if its individual values are found to all fall within a permissible range of variation. Maximum information for acceptability or reliability of such assembly can be extracted by employing statistical methods. Shewart-charts’ analyses of overall results from a meticulously conducted laboratory test process of evaluating coat-resistance levels of impact strength corrosion deterioration of a low carbon steel by three harvested bitumen samples from some critical bitumen sources in Nigeria with a working coating thickness of 0.81mm has been presented. The analyses indicate that variation in the obtained data values and hence qualities of the test bitumen samples, steel, facilities and the overall conducted test process are all in statistical quality control (acceptable range of variation), so there was no special cause of variation to be eliminated in the process. The analyses also give an indication of acceptability of results for the cases of other coating thicknesses previously obtained by Guma et al (2011b) with other coating thicknesses using the same test process and results with parallel test processes for cases of other mechanical properties of the steel by Guma et al (2010, 2011a and 2013b). V. RECOMMENDATIONS Clear natural bitumen around the region of Agbabu, in Ondo State and the KRPC-synthesized type in Nigeria are recommended to be harvesting and exploiting as economical materials of more or less consistent quality for desired corrosion coat-protection levels with various coating thicknesses. The bitumen should be used for protection of steelworks in the country’s corrosion-preponderant industries with due consideration to existing coating codes of practice with bitumen and coat-inhibition information presented in this paper and previously by Guma et al (2010; 2011a, b and 2013a). REFERENCES [1]. Jain, K.C and Aggarwal, L.N. (2008). Production Planning Control and Industrial Managementp, Khanna Publishers Delhi, India, pp: 846-876 [2]. Jain, R.K. (2005), Engineering Metrology, Khanna Publishers, Delhi, India, pp:. 896 – 897 [3]. Evans, J.R. and Lindsay, W.L. (1996). The Management and Control of Quality, 3rd Edn. West Publishing Company, NewYork, pp:. 638-669 [4]. Grant, E.L. and Leavenworth, R.S. (1996). Statistical Quality Control. Tata McGraw-Hill Publishing Co. Ltd. New Delhi, pp: 37- 70 [5]. Olalere, A. (1991). Asphalt/Bitumen Production from Nigerian Crude. A HND Research Project, Unpublished, Department of Chemical Engineering, Kaduna Polytechnic, Nigeria [6]. Fed.Min. Sol. Mine. Dev. (2006). Technical Overview in Nigeria’s Bitumen Belt and Development Potential Report, Federal Ministry of Solid Minerals Development, Abuja, Nigeria, March [7]. Ambler and Bain: (2012). In: Atmospheric corrosion by G.O. Llyod. Extracted from http://www.npl.co.uk/upload/pdf/atmospheric_corrosion.pdf (20/10/2012) [8]. Ali, J.A. (1998). Social-Economic Costs of Corrosion, the Nigerian Situation and Policy Suggestions. J. Constr. Mat. Techn., 1(!), Nigerian Building and Road Research Institute (NBRRI), pp:. 30 – 39 [9]. Wami, E.N. (1998). Investigation of Underground Corrosion of Mild Steel and High Carbon Steels. Nig. J. Tech. Edn. 15(!), National. Board for Technical Education, Nigeria. [10]. Yawas, D.S. (2006). Corrosion Characteristics of Mild Steel and Ductile Iron Exposed to Different Media. NSE Technical Transaction, Lagos, 41(3)
  • 7. Experimental assessment of bitumen coat-resistance to impact… www.theijes.com The IJES Page 33 [11]. Higgins, R.A. (1993). Engineering Metallurgy-Applied Physical Metallurgy, 6th Edn.. Arnold, Hodder Headline Group, London pp:. 507-537. [12]. Laque, F.I. (1975). Marine Corrosion. A Wiley-Interscience Publication, New York, pp:. 12-317 [13]. Pain. Dec. Con. (1995). Painting and Decorating Craftman’s Manual and Textbook, 8th, Edn. Published by Painting and Decorating Contractors of America, Fairfax Va, pp: 7-15 [14]. Pludek, V.R. (1977). Design and Corrosion Control. The Macmillan Press Limited, London. pp.: 36-390 [15]. Guma T.N; Madakson P.B; Yawas, D.S; and Aku, S.Y, (2010), Effects of Some Bitumen Coating Treatments on the Hardness Corrosion of Low Carbon Steel. Int. Res. J. Eng. Sc. & Tech.7(!), Edna-Ben Publishers, Owerri, Nigeria [16]. Guma T.N; Madakson P.B; Yawas, D.S; and Aku, S.Y, (2011a), Assessment of Capability Levels of Bitumen from Some Nigerian Sources to Coat-inhibit Tensile Strength Corrosion of Low Carbon Steel. Int. J Eng. Sc. 3(1), Pan-African Book Company, Accra, Ghana [17]. Guma T.N; Madakson P.B; Yawas, D.S; and Aku, S.Y, (2011b). Assessment of Capability Levels of Bitumen from Some Nigerian Sources to Coat-inhibit Impact Strength Corrosion of Low Carbon Steel. Int. J. Mech. Eng., 3(1), Blackwell Academic Journals Lagos, Nigeria [18]. Guma T.N; Madakson P.B; Yawas, D.S; and Aku, S.Y, (2013a). Effects of Some Bitumen Coating Treatments on the Corrosion Fatigue Strength of Low Carbon Steel. Research Desk-Int. J. Sc. & Tech. 2(1) [19]. Guma T.N; Madakson P.B; Yawas, D.S; and Aku, S.Y, (2013b). Characterization of Working Thicknesses of some Bath-Dip- Produced Corrosion-Protective Bitumen Coatings on Polish-Prepared Low Carbon Steel. Int. J. Eng. Res. & Dev. 6(12) [20]. Guma T.N. and Oguchi C.I.C. (2011). Field Test Assessment of Corrosivity of River Kaduna to Mild Steel. PeCop J. Sci. Eng. & Tech. 4 (1&2). PeCop Res. Nig. Ltd. Bauchi, Nigeria. [21]. Holman J.P. (1984). Experimental Methods for Engineers, 4th Edn. J.P. Holman & W.J Gajda-Singapore McGraw Hill Co. pp: 15-40 [22]. Miller, I. and Freund, J.E. (1987). Probability and Statistics for Engineers. Prentice Hall of India Private Ltd. New Delhi, India, pp: 153-160 [23]. INTERNET {2012): Nigerian bitumen. http://farriconsulting.blogspot.com/2011/02/bitumen-exploitation-and-exploration-in. htme (7/10/2012) [24]. Barton, K. (1976). Protection against Atmospheric Corrosion: Theories and Methods. John Wiley and Sons Limited London, England, pp: 1-182 [25]. ASM (1975). Metals Handbook Vol. 10: Analysis and Prevention. Published by the ASM Handbook Committee, American Society for Metals, Metals Park Ohio, USA pp: 168 -227 [26]. Cottrell, A. (1985). An Introduction to Metallurgy, 2nd Edition, Edward Arnold Limited, London, England, Pp. 451-523 [27]. INTERNET (2013a). The Shewart Procedure: Characteristic of Shewart [28]. Charts.http://support.sas.com/documentation/cdl/en/qcug/63922/HTML/defau lt (15/12/2013) [29]. INTERNET (2013b). What is Quality Control and Control Charts http://www.statoff.com/text/quality.control.charts/ (21/12/2013)
  • 8. Experimental assessment of bitumen coat-resistance to impact… www.theijes.com The IJES Page 34 Fig. 1: 퐗 Chart for the Impact Strength Coat-inhibition values Fig. 2: R Chart for the Impact Strength Coat-inhibition values