1. Situational Awareness for Smart Health Applications
ABSTRACT
With sensors and sensing applications proliferating in the modern world, traditional data
silos becoming available through service-oriented architecture (SOA), and new social data
becoming accessible through apps, we now have the ability to consolidate large volumes of
data to better comprehend and analyze the environment around us. By consolidating and
integrating this data in real time, we have opportunities to develop new suites of smart
applications that can change the way we manage our health, drive our cars, track inventory
—the possibilities are endless.
These “smart” applications will need to be more aware of their environment; they will need
attributes of what is commonly called situational awareness (SA). This article begins by
describing some common attributes of situational awareness. Next, we will introduce the
concept of a data-centric architecture and discuss why it is essential for building SA
applications. The article will discuss some complimentary technologies required to build
such a system. To narrate the concepts, we will use examples from how new applications in
health care (Smart Health) plan to change the way we care for chronic diseases and manage
our health.
What is Situational Awareness?
Situational awareness (SA) refers to a system being aware of its surroundings, its users and
their working context, with the ability to show relevant information that will assist users in
decision making. SA creates a model that captures the system state and provides an
understanding of how events affect that state. A good SA model integrates relevant
information from multiple sources, determines the relative importance of different events,
and projects the state of the system based on events. To build a system that is situationally
aware, the model must be accurate and must update quickly to reflect current events.
SA systems are not the same as systems that do multi-sensor data fusion. Multi-sensor data
fusion techniques combine data from multiple sensors, providing more accurate
measurements of the environment. However, a multi-sensor system does not understand
the context of the user or the state of the system, and has little intelligence to process the
data. Consider for example a device that measures body temperature from multiple places
on the body. The device may use sensor fusion techniques to eliminate faulty readings and
provide the most accurate body temperature reading based on its sensor-fusion
algorithms. A SA system, by realizing that one particular sensor always returns an outlying
reading, may recommend the user to check if it is working or properly connected.
An SA system by itself does not provide value. It is entirely possible for an operator to have
an excellent SA system and still make an incorrect decision. This could be due to poor
strategies, poor training, or poor interpretation, among other reasons. Where possible, an
SA system needs to take the next step: it needs to recognize patterns and either take
autonomous action or proactively direct operator attention. Pattern-matching technology
or machine-learning techniques can recognize correlated events and assist with delivering
2. awareness to the operator. With experience, the pattern-recognition/action-selection
sequence can become automated and reduce demands on the operator.
As an example, in health care, practitioners of bio-informatics have recognized the value of
providing situational awareness in their sensing applications. By correlating – in real time--
sensor data for ECG, blood oxygen, blood pressure, respiration or pulse, and applying
patterns to monitor events of interest, we can build systems that can be used to manage
patients with chronic conditions (such as heart diseases or diabetes) and alert the patient
or the medical provider for anomalous events.
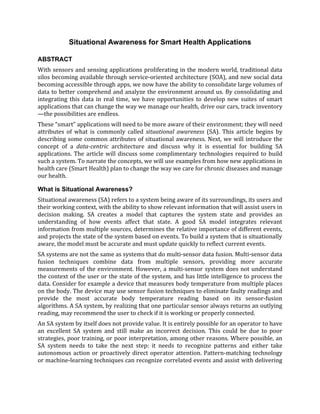
Figure 1. This proposed iPad® Smart Health application integrates sensor information with
operator input and knowledge-base data to provide SA for tracking blood sugar levels (see
http://www.fastcompany.com/article/wireless-technology-for-global-health-leslie-saxon-md).
The specific techniques used by each application to provide SA will vary. However, to
deliver such awareness of the environment to real-time systems, application architects and
system developers must follow the guidelines described below.
True SA Requires Integrating and Interpreting Information
With the informational deluge, there is a gap between the large volume of sensing data
produced and a human’s ability to process the information. Ironically, overwhelmed or
under-trained operators may be even less informed with numerous, highly capable sensing
devices than with fewer, simpler ones. For the information to be processed correctly, it
must be integrated and interpreted correctly. For example, if a home-based monitoring
system were to be developed for managing cardiac patients, it will not be possible to be
continually watching for ECG, pulse, or blood pressure reading and trying to detect events
of interest – the system will not be usable or valuable. What is required is a system that
integrates and correlates data from different medical devices in real time.
2
3. Figure 2. A screenshot from Google Health (google.com/health) for a fictional user, “Jane.”
By aggregating information for diverse sources, Jane can track how exercise and medication
help improve her cholesterol and blood pressure. Notice that the information required to
derive SA comes from multiple sources (pathology tests, pedometer sensors, and user input).
However, integrating information from distributed sensor systems such as these medical
devices is more complicated than integrating data in traditional enterprise systems.
• Integration of heterogeneous architectures: Unlike traditional enterprise systems,
embedded and RTOS markets for operating systems are heavily fragmented; typical
sensing systems use a range of operating systems (INTEGRITY, VxWorks, LynxOS,
TinyOS, …), devices and network protocols (UDP, TCP, Bluetooth, Infiniband, wireless,
radio, …) and middleware protocols (JMS, HTTP, DDS, ...). Often, no single sensing
system can provide a comprehensive event-detection or monitoring system. Instead, a
combination of best-of-breed components—each designed for a specific purpose,
operating system, and network protocol—must together provide a comprehensive
solution. Data from multiple sources must be organized and prioritized to support
distributed, cooperative decision-making.
• Dynamic, evolvable, and type-safe data representation and encapsulation: These SA
models must allow for the collection of a variety of data types from sensor probes. To
3
4. address the various data types and characteristics of information collected, as well as
possible schema evolution, the SA model must provide an approach for having self-
describing data or a similar mechanism that allows clients to discover and process the
schema dynamically. What this means is that a SA system cannot define a unified and
complete data structure upfront, which all the medical devices use. What is required is a
methodology where different devices/sensors can still use different data types, and can
still be integrated without complex code.
• Event correlation and aggregation: SA is about inferring activity of interest—events—
either by monitoring for known abnormalities or intelligently adapting to the
environment to infer abnormal events. To do so, events from different sensors must be
correlated and aggregated. For example, some events are immediately recognizable
(such as systolic blood pressure > 200). Other events are characterized by intermittent
activity spanning a much longer timeframe (hours, days, or even weeks) and may not
even be identified as an event until a vast collection of records are considered in
aggregate (for example, systolic blood pressure = 160 but has been steadily rising for
the last week). Thus, while every event has a definitive beginning, this starting point is
not always discernible at the time of occurrence. Neither is the time it takes for such an
event to unfold or its ultimate duration predictable. Event-detection tools are needed to
normalize events from different sources and correlate them by time or distance to
identify possible information of interest.
A Data-Centric Architecture is Key to Building an SA System
The architecture for connecting sensors and distributing their data can either follow a
message-centric or data-centric design pattern. In a message-centric model, the
infrastructure does not understand your data. The infrastructure carries “opaque” content
that varies in structure from message to message. Because the messages have no identity,
they are indistinguishable to the infrastructure. They also lack lifecycle management. Often
used for Enterprise Service Bus (ESB) messaging, the Java Message Service (JMS) API and
Advanced Message Queuing Protocol (AMQP) are examples of such message-centric
technologies. For these technologies, there is no need for a semantic understanding of the
data.
A data-centric architecture uses the principles of a global data-space. It resembles a virtual,
centralized database. From the operator’s viewpoint, the data collected from different
sources appears as if it is from a single source. The operator does not have to worry about
accessing the data source from each sensor, normalizing the data, etc. All sensors
contribute their data to the global data-space. Applications access this data, similar to a
database, with no concern for the distributed nature of the system.
4
5. Figure 2. In this conceptual representation of a data-centric model, applications read and
write data without requiring any information on the location of the data, transport protocol,
operating system, and so on.
With a data-centric design (see Figure 2), developers specify only the data requirements—
inputs and outputs—of each subsystem. Applications focus only on the data they intend to
consume or produce and leave the mechanism to procure, normalize, filter, and enrich the
data to a data bus. What this implies is that while developing applications for providing
situation awareness, say tracking cardiac health, we do not need to worry about how to
connect to the medical device, how to do endian conversion, how to transform data types,
how to poll for the next sample, how to demarshall messages on the socket to a data
structure – the data centric middleware should be able to manage all these operations.
In a data-centric model, the infrastructure does understand your data. In particular, it
understands:
• What data schemas will be used
• Which data items are distinct from which others
• The lifecycles for the data items
• How to attach behavior (e.g., filters and Quality of Service) to individual data items
A data-centric architecture removes the tight coupling between the data producer and
consumer, thus making the design scalable and evolvable. Examples of data-centric design
technologies include the Data Distribution Service (DDS) for Real-Time Systems standard
and the Real-Time Publish-Subscribe (RTPS) wire protocol, both from the Object
Management Group (OMG).
This requirement is critical for building a situational aware system, which becomes more
aware as it senses more sources and analyzes them in real time. With a data-centric
architecture, the middleware understands the data; only the relevant data is put on the
wire, avoiding performance bottlenecks. As an example, while the sensor may be making
temperature readings at 5 Hz, we can use the middleware to only send the information at 1
Hz or when the temperature exceeds 99 F. This capability is not conveniently possible
without having a data-centric architecture.
5
6. SA Systems Often Need to Analyze Data in Real Time
To provide situational awareness, systems need to aggregate, correlate, cleanse, and
process sensor data in real time.
New technologies such as Complex Event Processing (CEP) allow users to perform
traditional database and data-mining tasks like data validation, cleaning, enrichment, and
analysis without first persisting the data. By using CEP, application developers can query,
filter, and transform data from multiple sensors for event detection in real time. With the
ability to automate pattern monitoring in real time through CEP, operators can develop
autonomic event-response mechanisms and get critical information for isolating events.
For example, sticking with the cardiac tracking application, we can have a system that
integrates data from medical devices measuring ECG, temperature, pulse. By using CEP, we
can define watching for events with patterns of interest: temperature < 97 AND pulse > 110
SA systems often need to add new queries in a monitoring system without recompiling
code or restarting the system. With CEP, operators can develop new pattern filters without
recompiling the code. This feature becomes very critical in use-cases where the situation is
dynamic, for example, in agent monitoring or the clinician adding new patterns for
monitoring.
Visualization Frameworks Need to Adapt for SA
With the avalanche of sensing information, to have as complete an SA model as possible, it
is imperative for the operator to address risks with the highest importance and have access
to all the data. This system must evaluate, prioritize, and present time-sensitive data to
users in an understandable format.
The visualization technology should provide a layered view of the data so the operator has
a comprehensive perspective of the environment, with the option to observe events of
interest in greater detail (i.e., zoom in, zoom out). A layered view will also allow data to be
aggregated across many dimensions: time, network components, hosts, and applications.
The ease of browsing such state information can be provided through heat maps that can
immediately convey the visual message. The information processed by the heat maps must
be measurable and segmented so it can provide different status levels.
Visualization is a very powerful way to provide a sensing system’s status to an operator.
However, a visualization framework should be extendable to include new types of sensors
and it must provide interoperability. A visualization framework needs to use a layered view
of the data so operators can get high-level information about the system as well as detailed
information.
6
7. Figure 3. Snapshot from a research application that integrates information from pathology,
doctor and ER notes to provide situational awareness to improve patient care in an intensive
care unit (see http://graphics.cs.columbia.edu/projects/activeNotes/pap0331-Wilcox.pdf).
The visualization framework for an SA system should have the ability to provide negative
reasoning for diagnosis. In this approach, the operator seeks evidence that will disprove a
hypothesis. That is, unlike monitoring data for events of interest, the system monitors data
to perform negative reasoning. This kind of diagnosis becomes very important in use cases
such as medical pathology. In addition, an SA system should understand the context of the
user and the state of the system so it can prioritize information and help the operator focus
on information and events of interest.
SA Systems Should Address Privacy and Security Concerns
Correlating information from multiple sensors and historical data implies that the thorny
issues of access control and privacy have been addressed. Privacy defines policies and
procedures for sharing information correctly. Access control is the mechanism to
implement privacy.
Often requiring a cultural and legal context, privacy is about controlling how information
flows. For example, while there have been many implementations of access-control
mechanisms for enterprise applications, there is no compelling implementation that
addresses compliance for the Health Insurance Portability and Accountability Act (HIPAA)
privacy law. Privacy implications for sharing information will obviously vary among
industries and use cases, but an SA system that is built on a content-aware infrastructure
7
8. and middleware will be better able to control and monitor the flow of information, making
it easier to design compliance to privacy rules for the application.
Figure 4. HIPAA Compliance Checker, a project by Professor John Mitchell, provides HIPAA
privacy compliance to messaging by understanding user and message contexts (see
http://crypto.stanford.edu/privacy/HIPAA/).
SA systems that collect data from multiple sensors are inherently distributed. Each “remote
sensor node” represents a potential point of attack from intruders. The network may be
dispersed over a large area, further exposing it to attackers who may capture and
reprogram individual sensor nodes. Since it may not be possible to guarantee security for
all remote sensor sources, the SA system must be vigilant in monitoring for intrusions.
Putting it Together
Consider, for the sake of illustrating the principles, an in-home cardiac monitoring device
that consists of (minimally obtrusive) sensors that measure blood oxygen, pulse,
respiration rate, and body temperature. The sensor readings for a healthy individual
usually show 97%-99% Oxygen saturation, 14-20 breaths per minute, a pulse rate of 60-80
per minute, and an oral body temperature of 98.6 F.
There are considerable challenges in providing effective monitoring if all these devices
provide readings to the caregiver or the patient in isolation. Instead of documenting all the
limitations, let us discuss how a situational-aware system built on data-centric principles
provided by Data Distribution Service (DDS) can enable new use cases.
By using a data-centric middleware, all the sensing devices are updating the information, in
real time, to the common global data space. To better understand, consider the Oxygen
meter updating data instances with attributes {DEVICE_ID, TIME, PERCENTAGE_OXYGEN}.
Similarly, the pulse sensor is publishing {DEVICE_ID, TIME, PULSE_PER_MINUTE}, and the
8
9. respiration monitor {DEVICE_ID, TIME, RESPIRATION_RATE_PER_MINUTE}. By using DDS,
and by having these sensor feeds updating information in real-time, we have a virtual
database that can be analyzed very efficiently.
For this simple use case, the monitoring application does not need to integrate and parse
messages from each sensor to update and correlate the application data structures. But
there are many other advantages to using a data-centric, publish-subscribe middleware: by
defining the quality of service (QoS) contracts for each publishing sensor, we can make the
monitoring device more efficient. For example, while we may be interested in getting pulse
measurements every second, getting temperature readings at five-minute intervals may be
more relevant, saving traffic on the wire and reducing load on the system. Such contracts
can be easily defined without updating the sensors or the application code. The Object
Management Group (OMG) DDS specification provides a rich library of real-time
networking behavior that can be availed simply by turning on an XML parameter— without
writing complex code.
Once the data is acquired, we can use a Complex Event Processing (CEP) engine to perform
real-time analysis and set alerts. For example, by using the CCL scripting language
described in previous sections, we can develop alerts such as: “when WITHIN five minutes
the BASELINE (average) respiration increases by 10% and BASELINE Oxygen falls by 3%.”
Keep in mind that the CEP engine would not process sensor readings in real-time if the
stream had not first been normalized into data structures, which a data-centric middleware
like DDS so efficiently enables.
More interestingly, we can analyze real-time trends with CEP and provide more instructive
monitoring and care. With CEP’s real-time data-mining capabilities, for example, we could
detect that a patient’s respiration rate significantly increases a few minutes after a
temperature spike, risking the heart. In that case, care may be directed (depending on the
medical specifics of the case, of course) towards managing the fever rather than medicating
to calm the heart.
In addition, with an intelligently built visualization interface, the system can continually
receive patient feedback to establish baseline trends and detect correlations in anomalies
(example: patient reports pain each time the sensor is reading an increase in pulse, but
only between 2-4 am).
Obviously, there are many challenges in building such a system. Perhaps the first
generation of such technologies would only provide information for the eventual doctor
visit, where the patient (traditionally) could not either recall the specific anomalies or did
not have all the data. By providing such richness in information, enabled by a new
generation of sensing devices, real-time networking technologies such as DDS, and real-
time stream processing, we could change the way we provide care.
Conclusion
A system with SA capabilities can only provide true situational awareness if the operators
are trained correctly, the relevant data sources are integrated, and the system is flexible
9
10. enough to adapt to new events and new sensors. Effective systems are never built by
merely aggregating compelling features, as that technique does not deliver value to the
operator. By focusing on the operators and their need to comprehend and act on the data,
we can deliver true SA applications using multi-sensor systems.
We are on the cusp of another information revolution, where real-world data will help us
better understand and react to the world around us. This revolution will come from
integrating, in real time, information that traditionally resides in application silos and by
applying multi-sensor data fusion to provide true situational awareness to the application
user. By converting the data deluge into actionable intelligence, we can change how we
deliver patient care, drive our automobiles, manage our assets, and much more.
10