Downloaded 1,051 times


![{
"checks": {
"chef_client": {
"command": "check-chef-client.rb",
"subscribers": [
"production" ],
"interval": 60,
"handlers": [
"pagerduty",
"irc"
]
}
}
}
Only on the server](https://image.slidesharecdn.com/stop-using-nagios-140213072451-phpapp01/75/Stop-using-Nagios-so-it-can-die-peacefully-22-2048.jpg)


The document critiques Nagios as a monitoring tool, highlighting its simplicity and existing plugin support while pointing out its major shortcomings such as poor scalability, configuration complexity, and inadequate API integration. It suggests leveraging the strengths of Nagios alongside more modern and scalable tools like Sensu, and advocates for creating a comprehensive monitoring solution by combining various best-in-class technologies. The author calls for community engagement to develop a superior monitoring system that avoids the pitfalls of Nagios while maintaining its reliable traits.
Introduction questioning Nagios, its selection, and challenges faced by users.
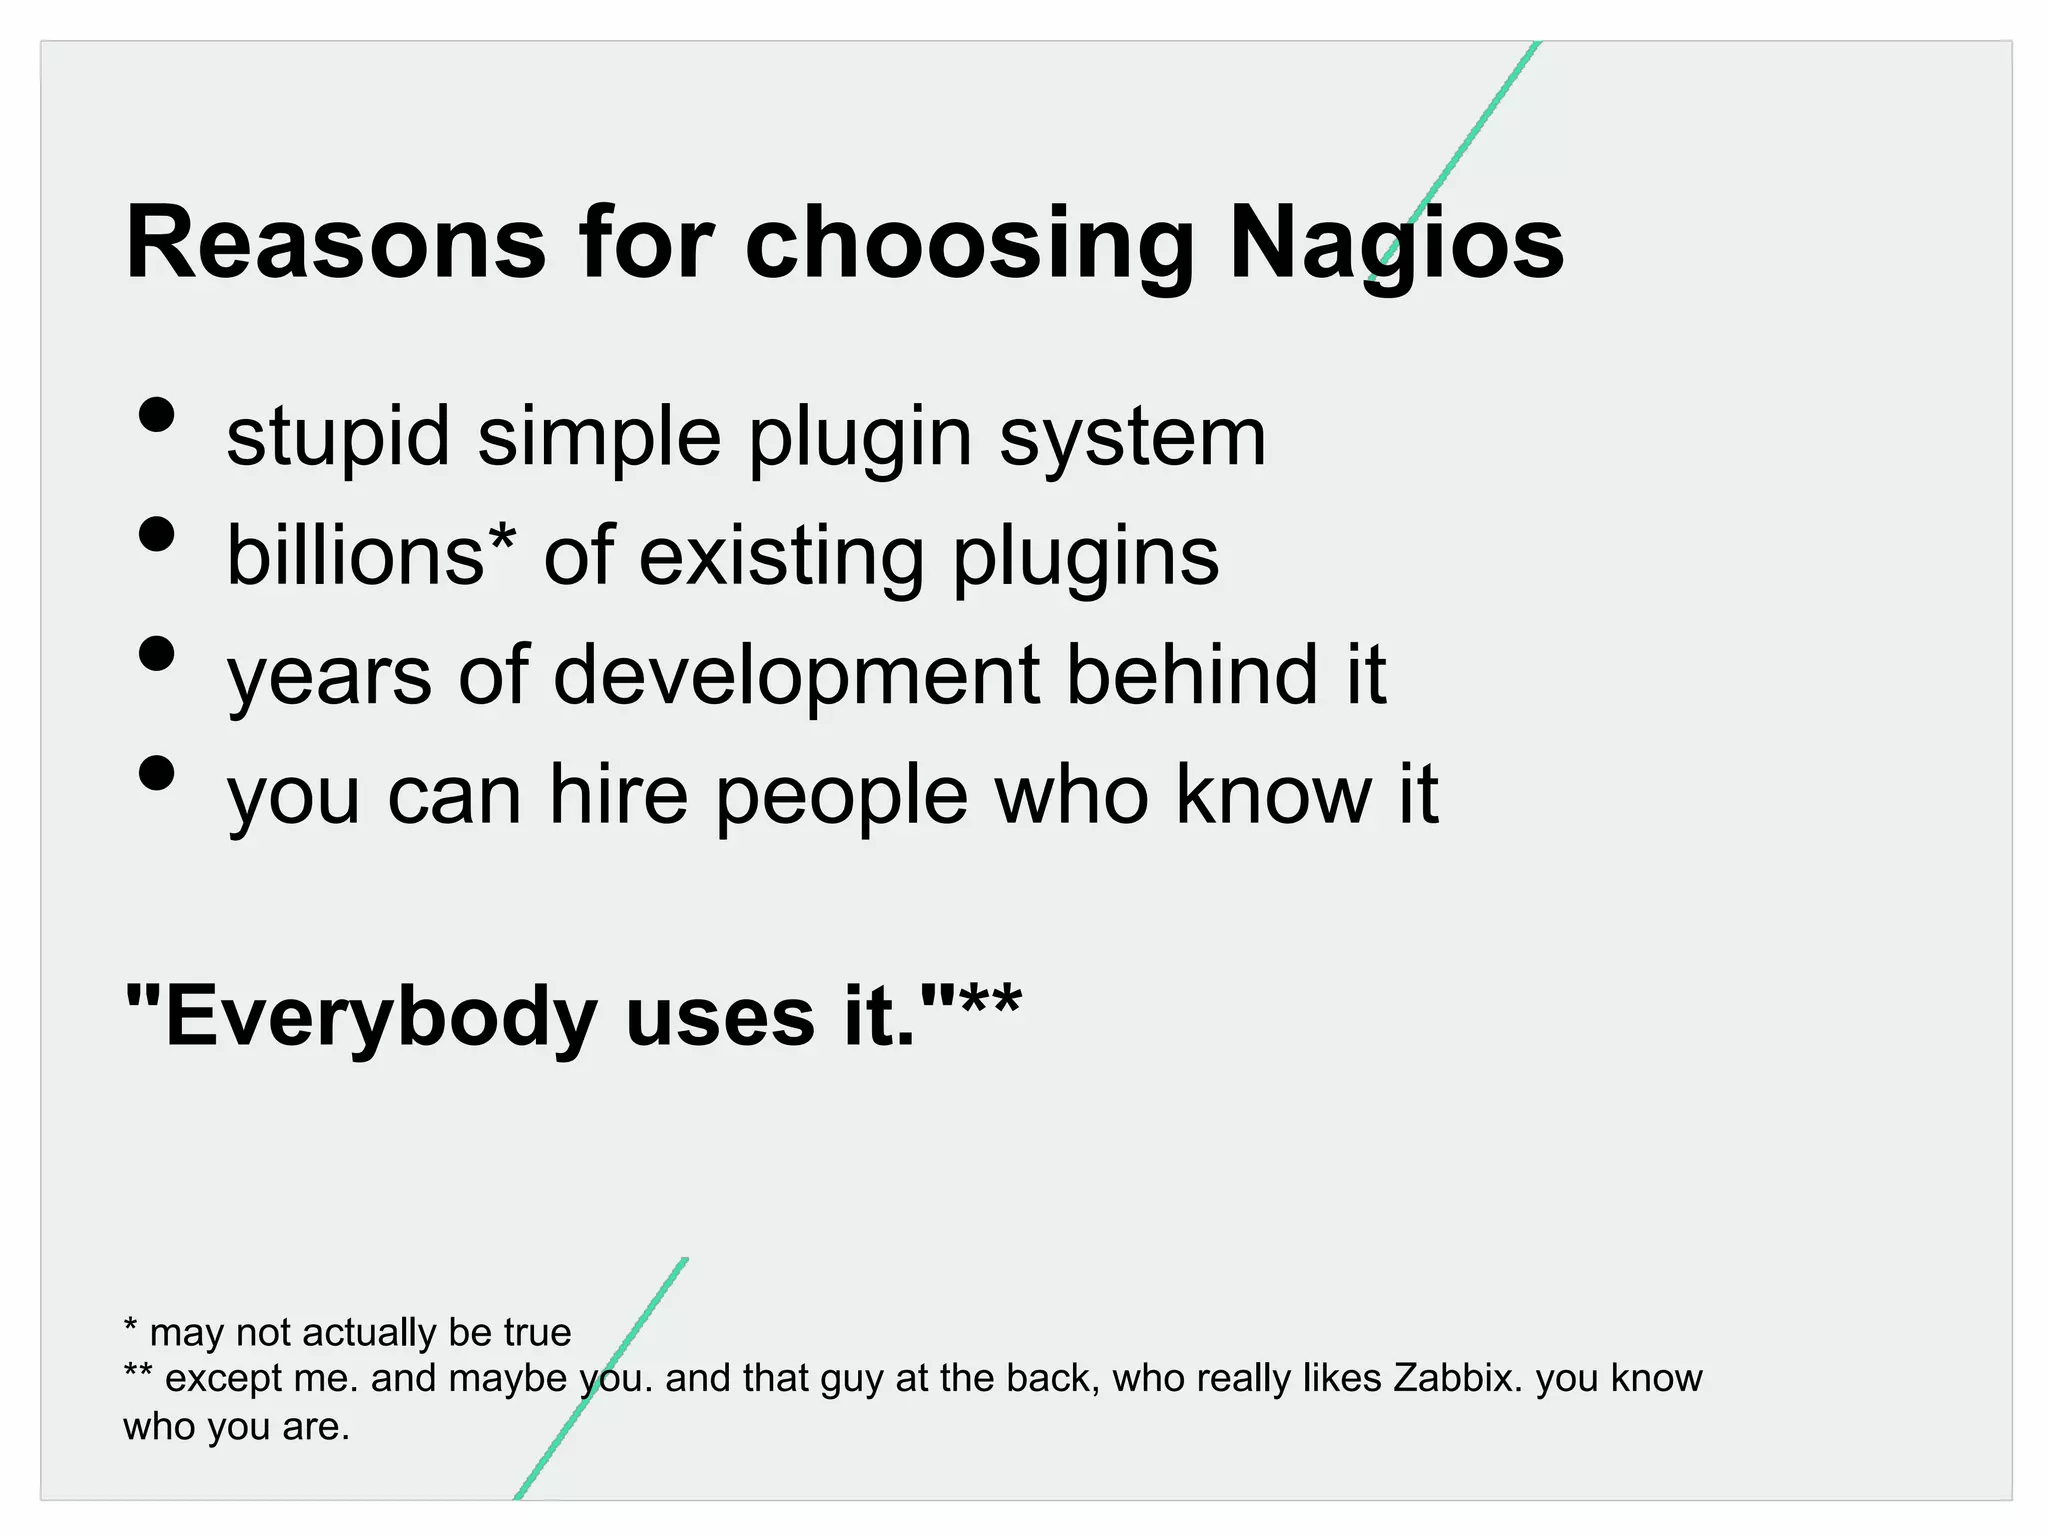
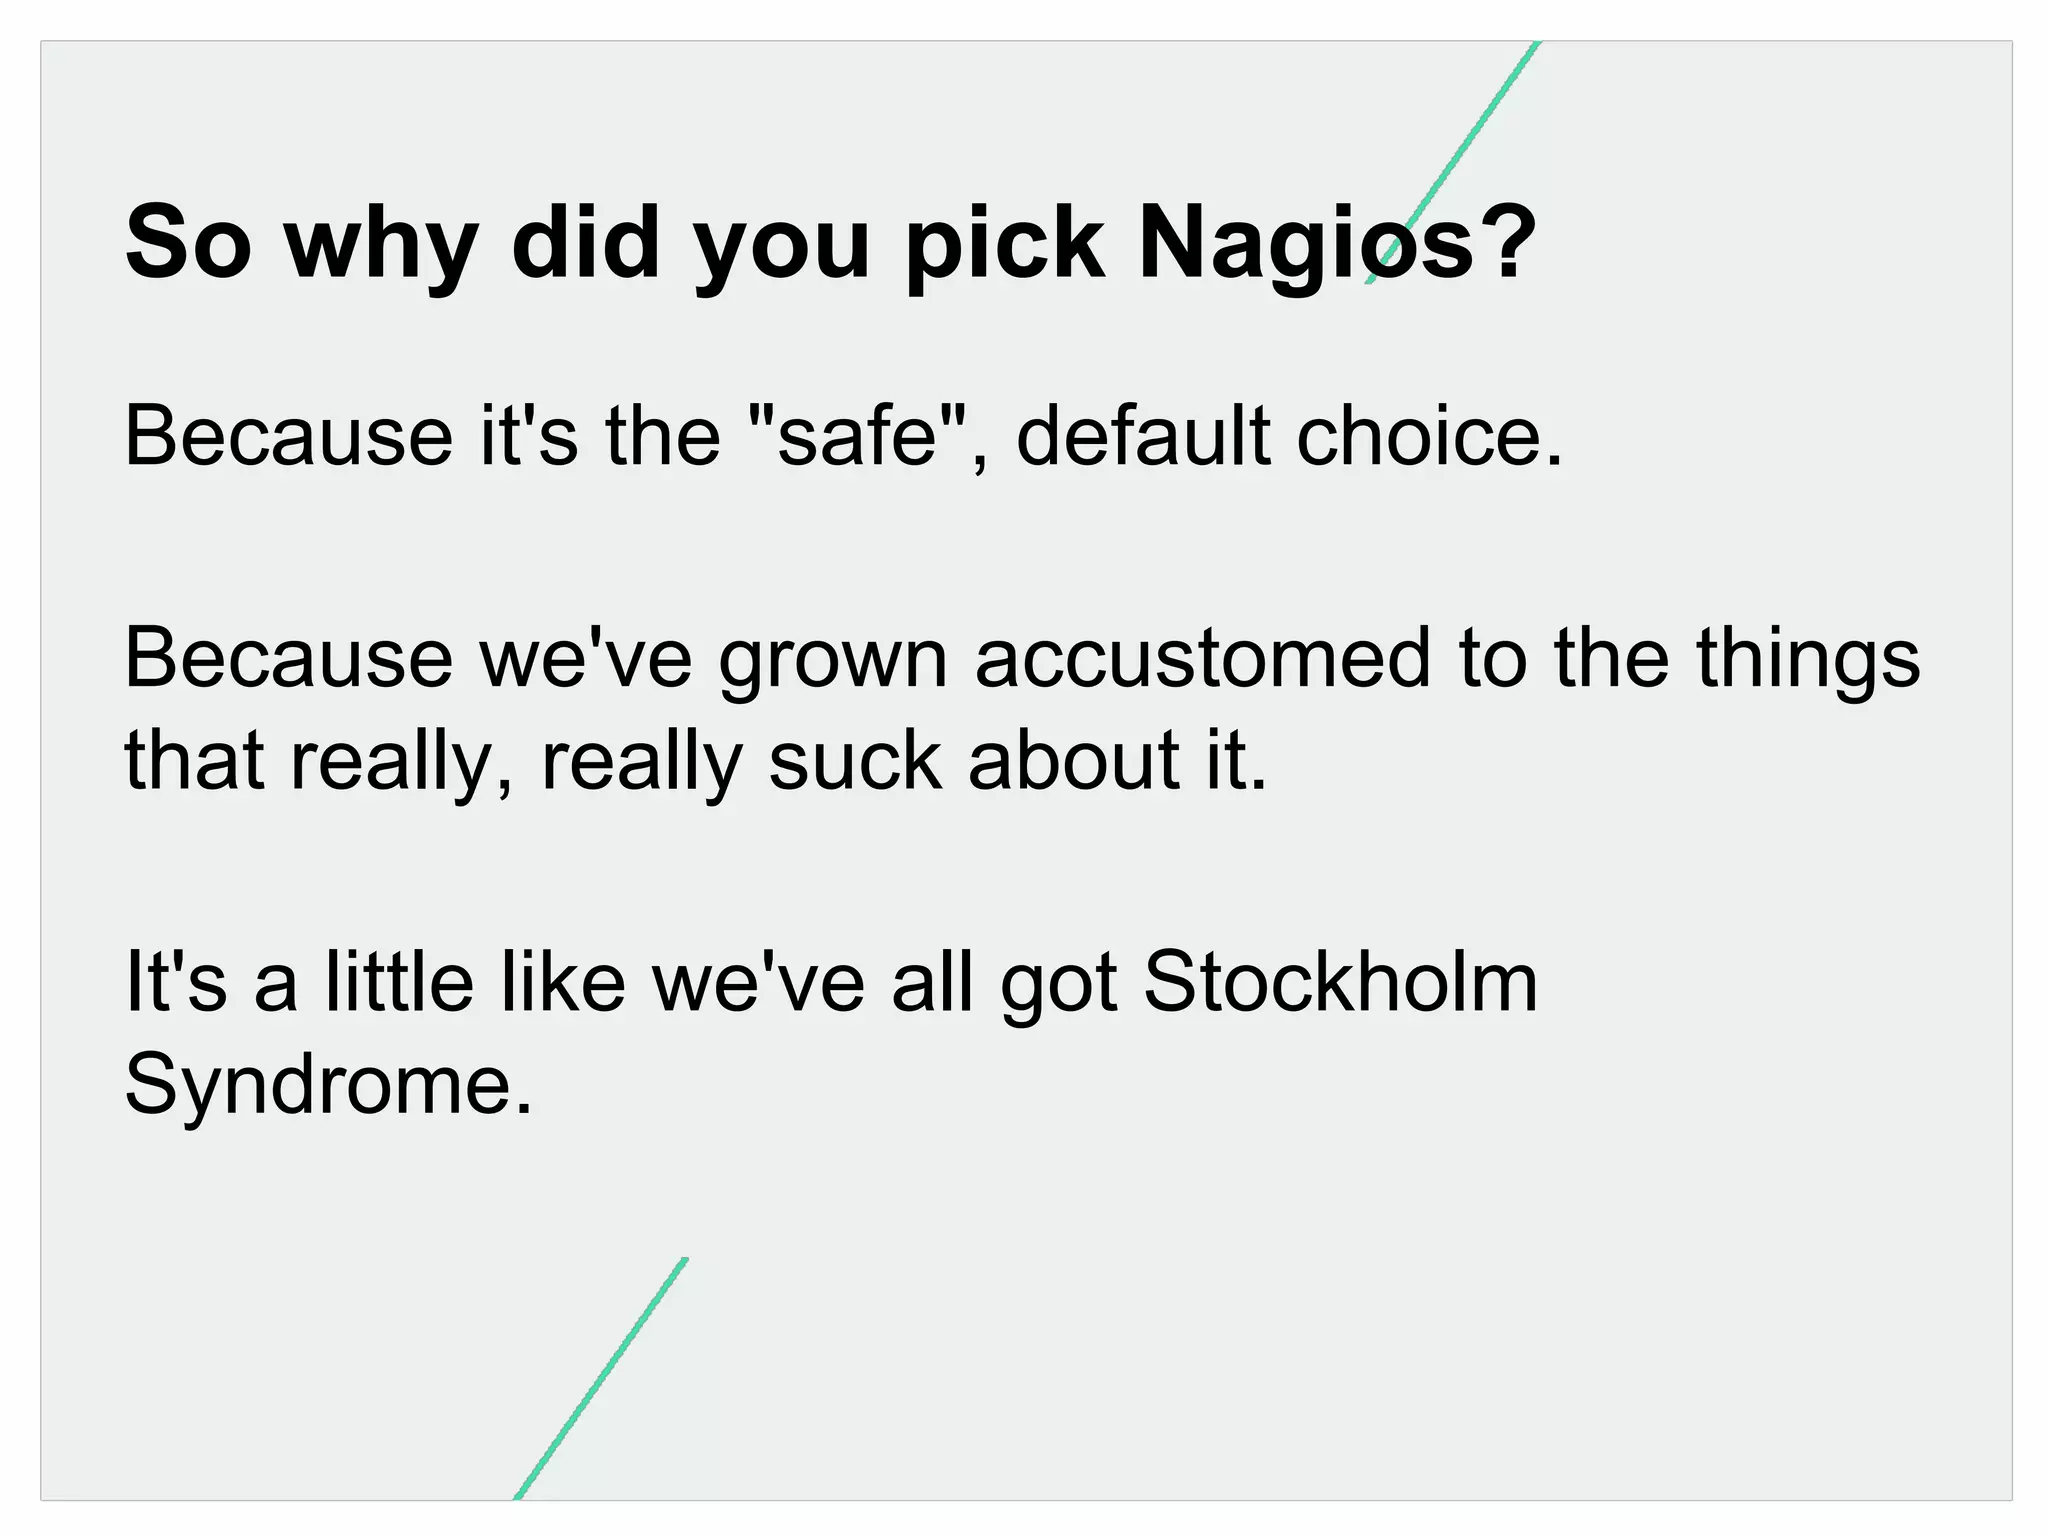
Discusses reasons for choosing Nagios: simplicity, many plugins, easy hiring; acknowledges its default choice status.
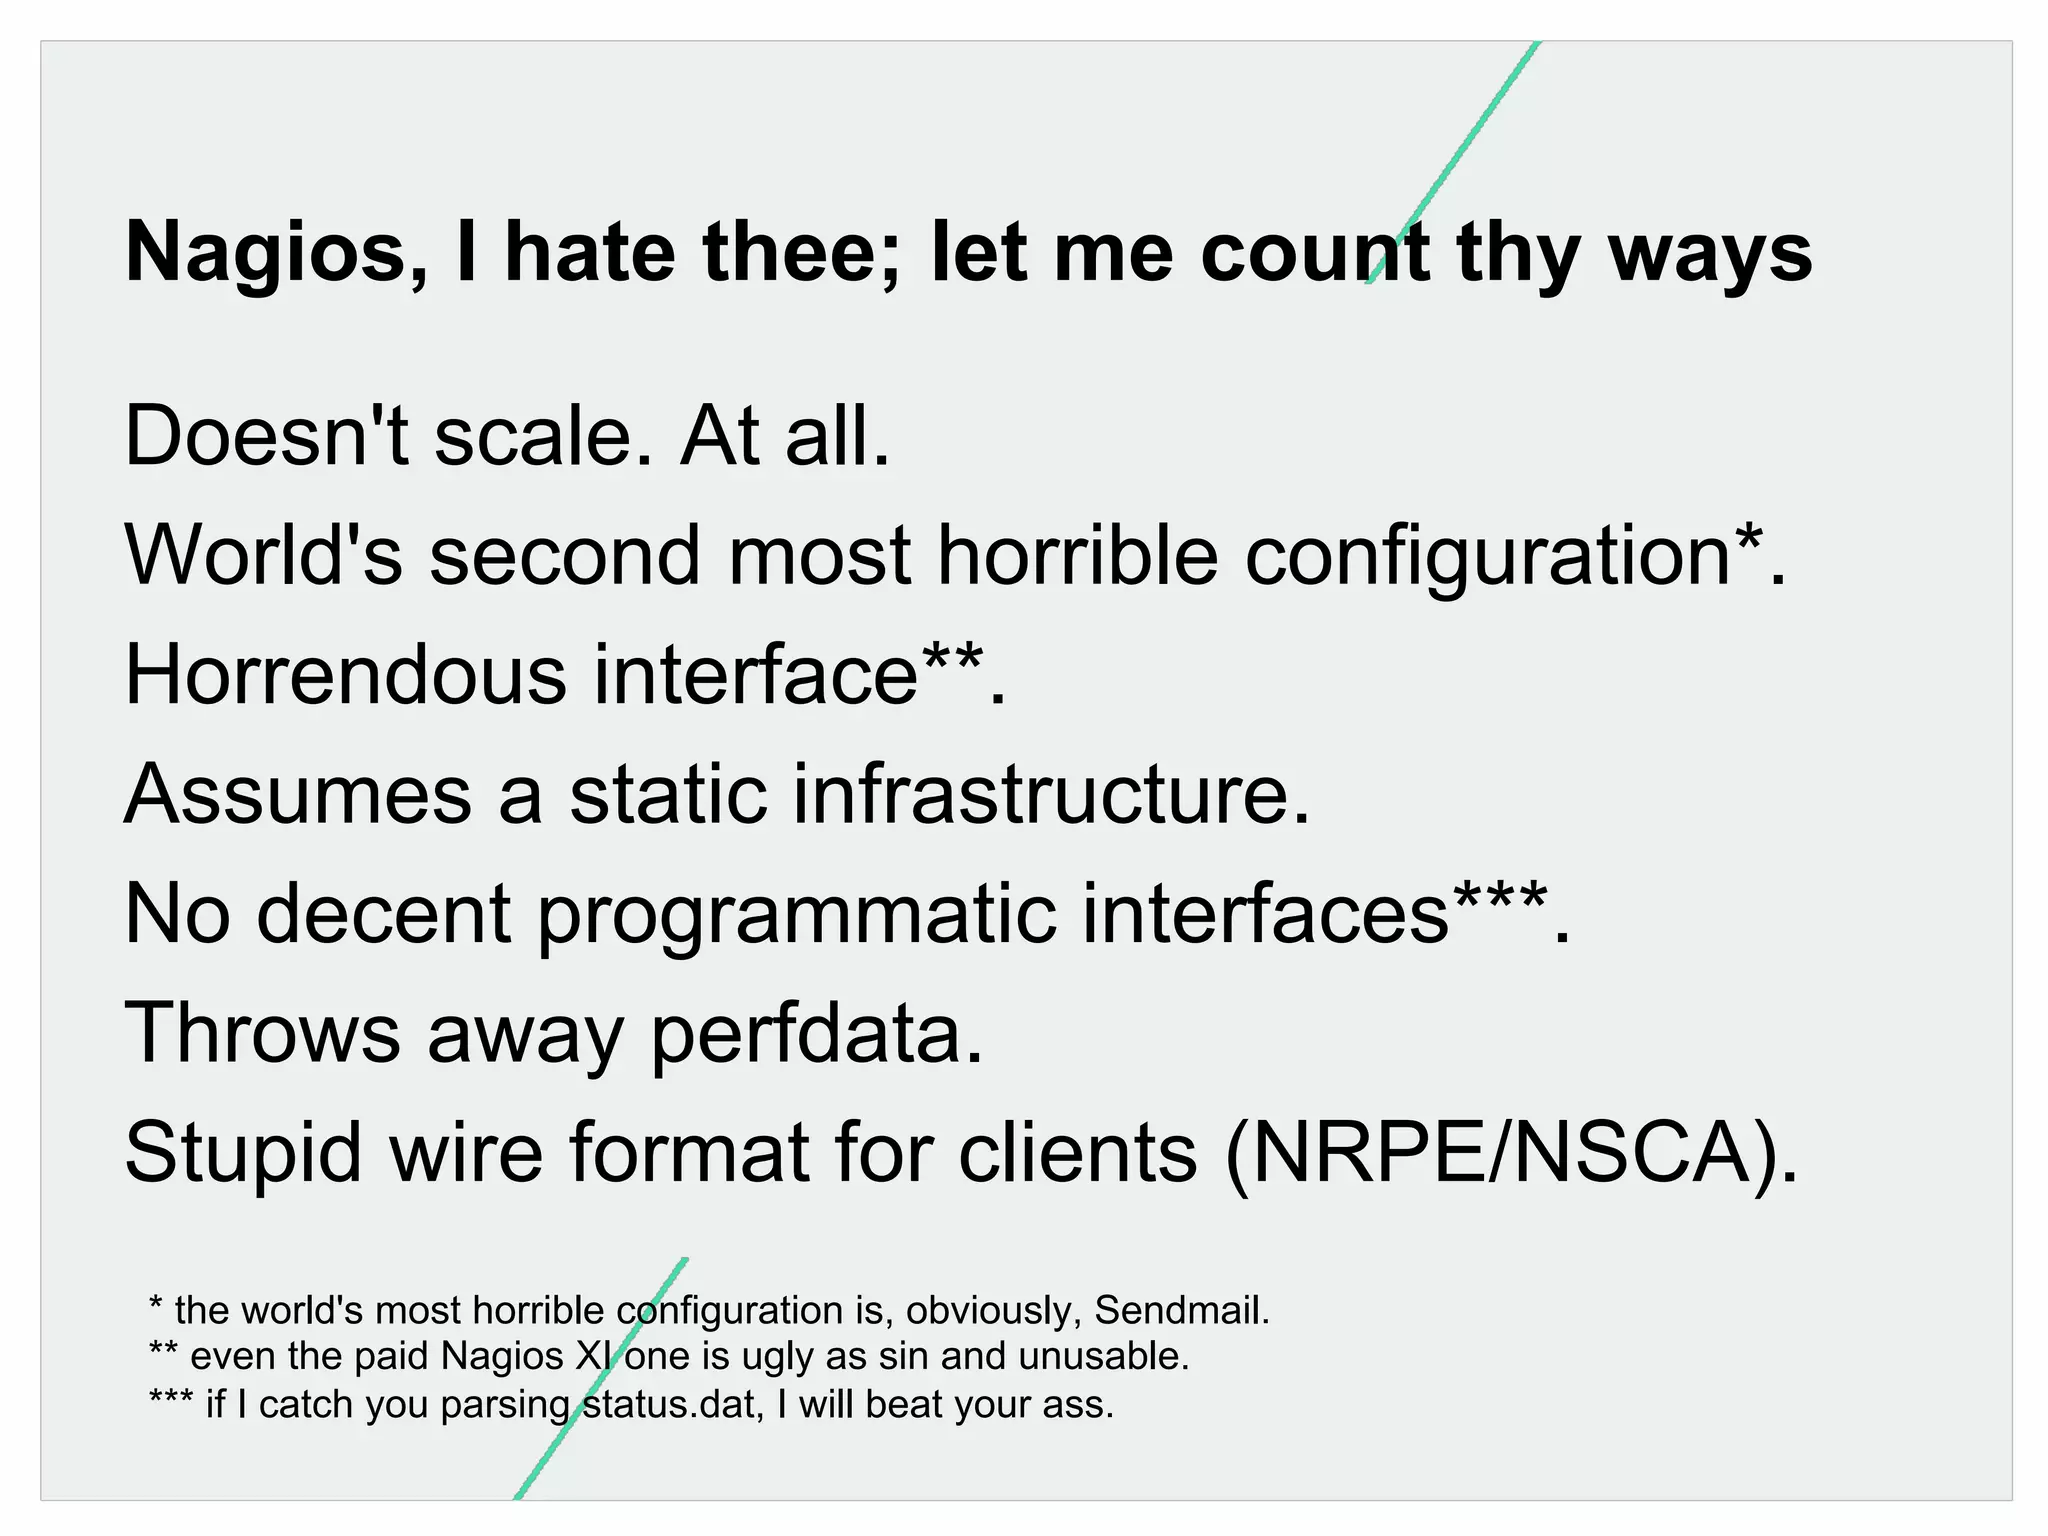
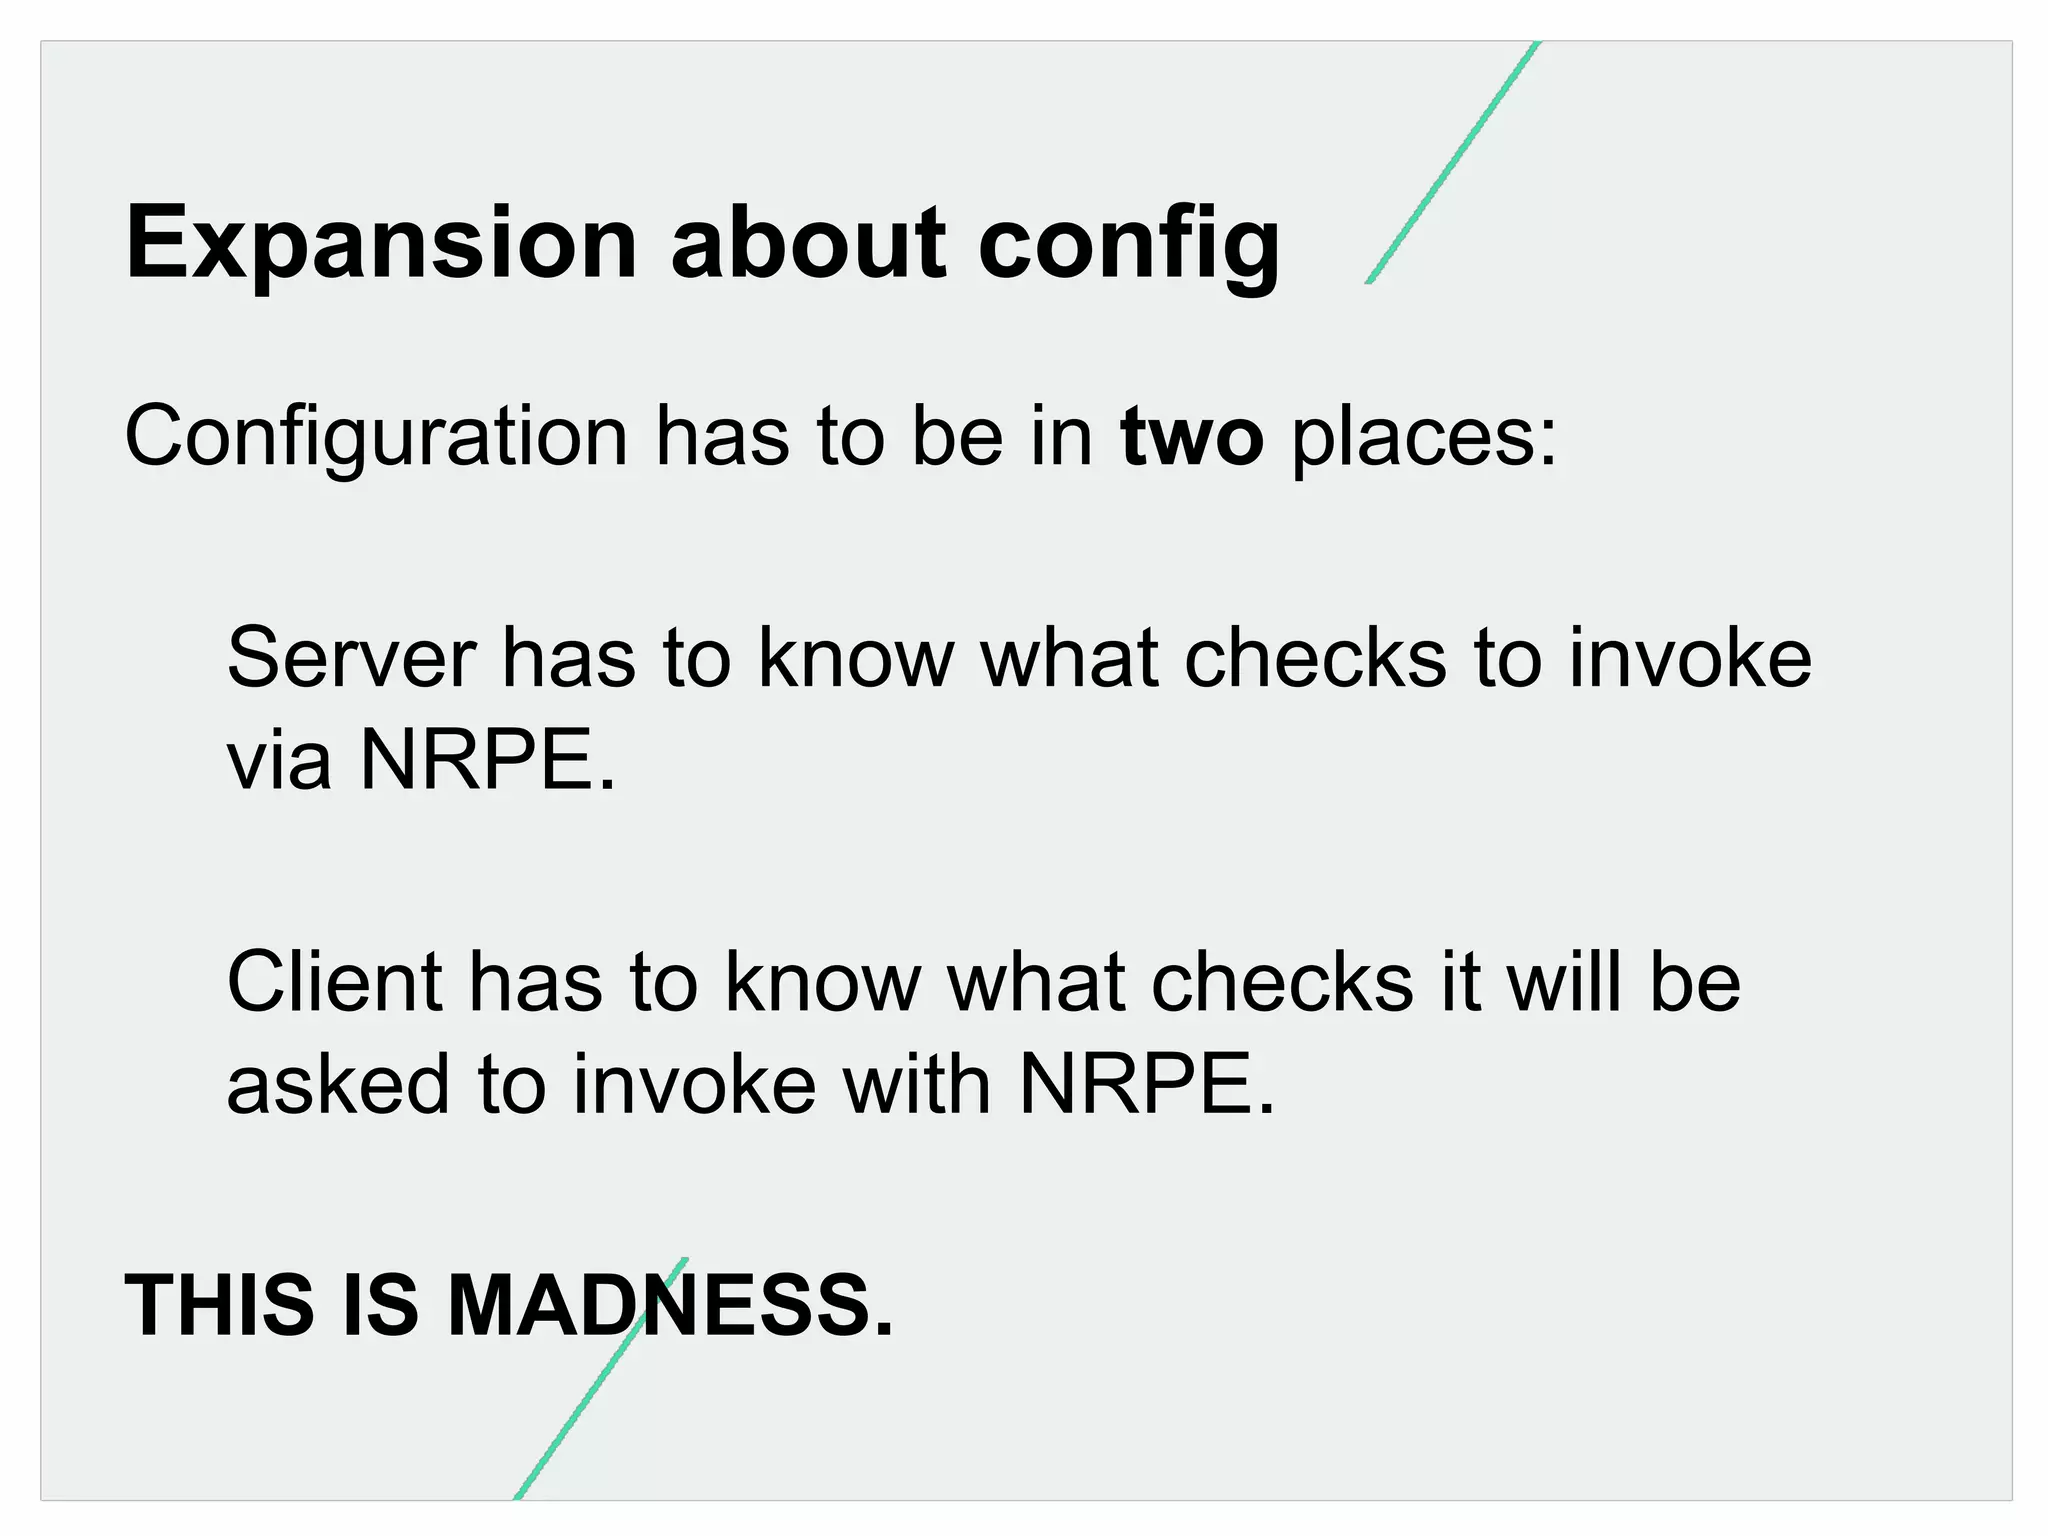
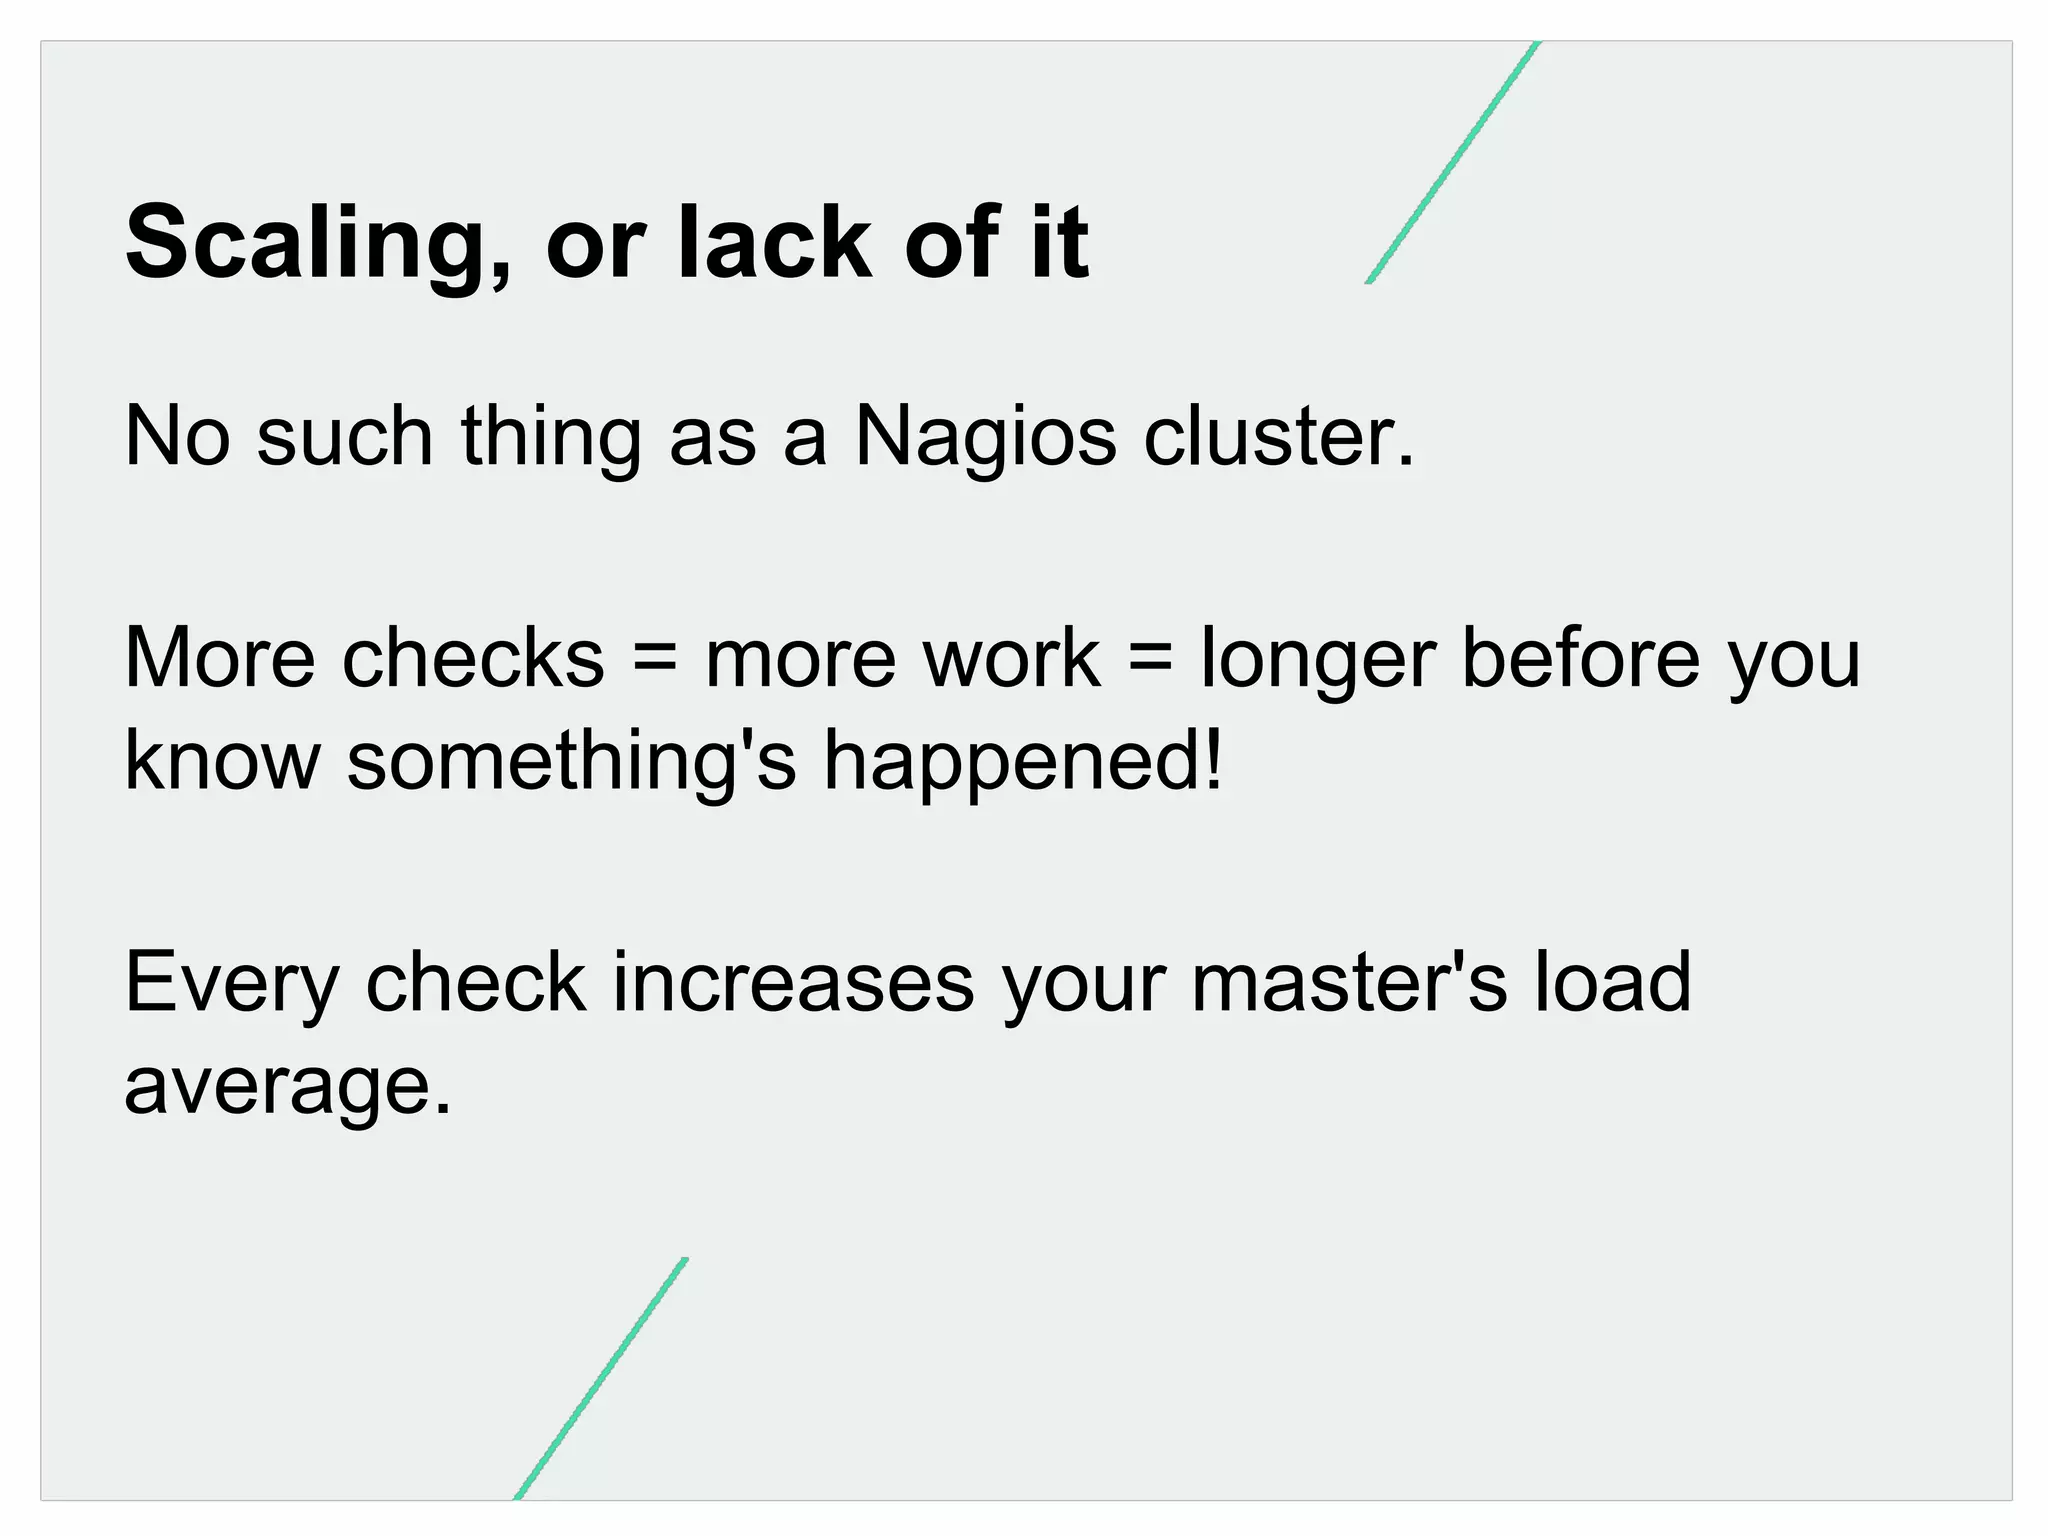
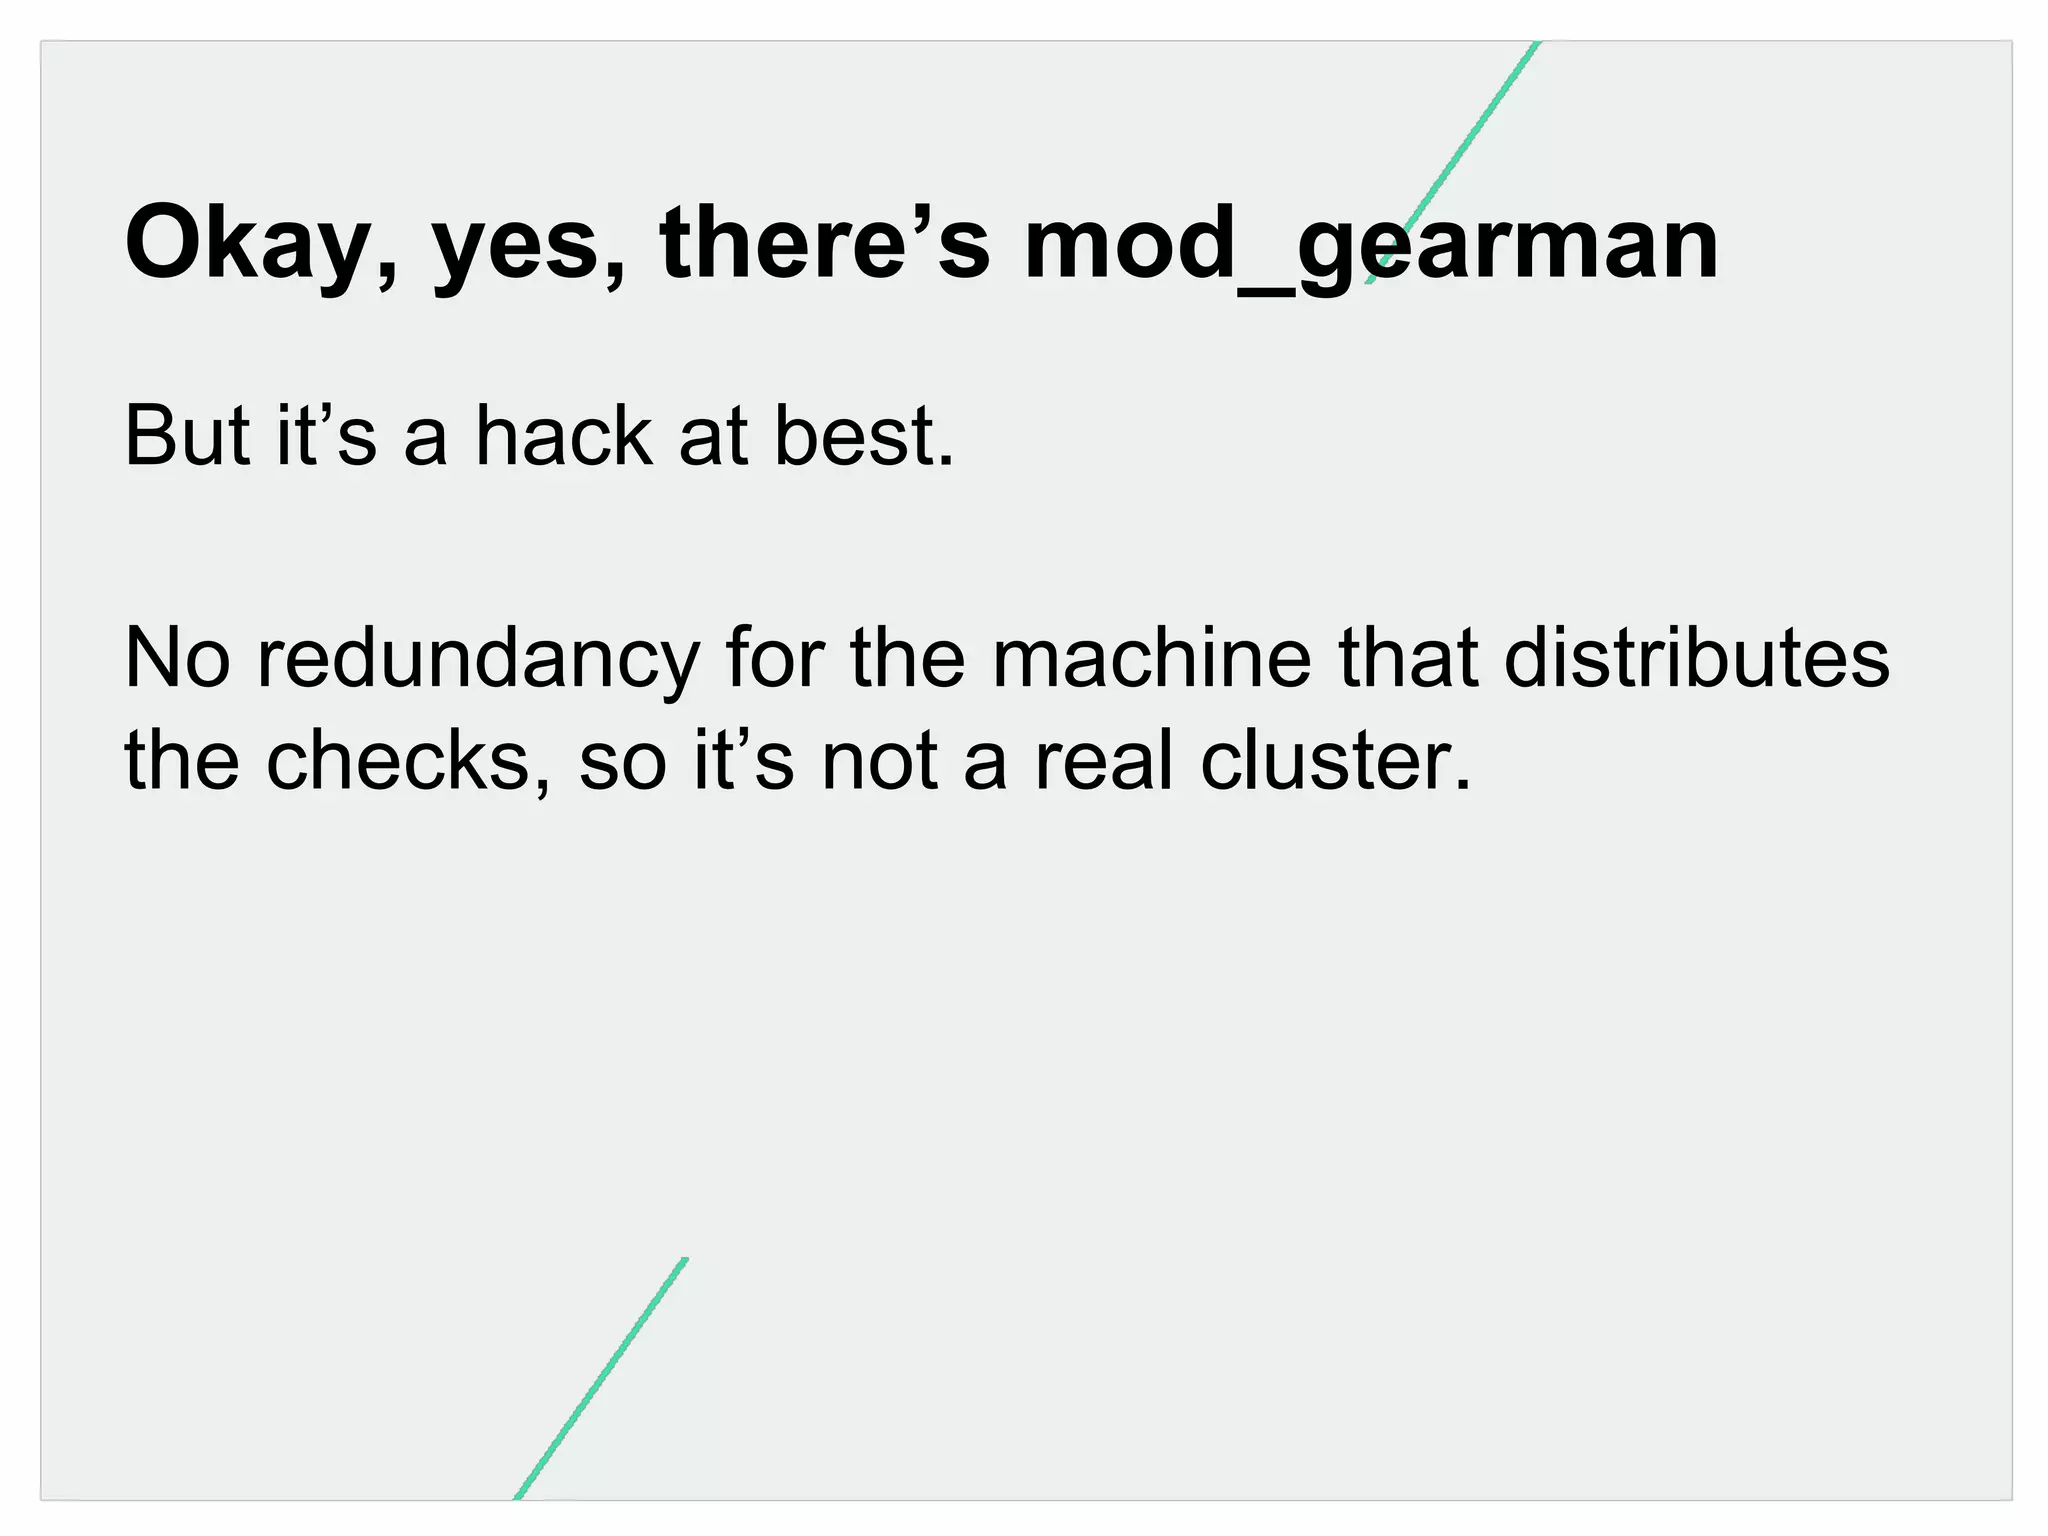
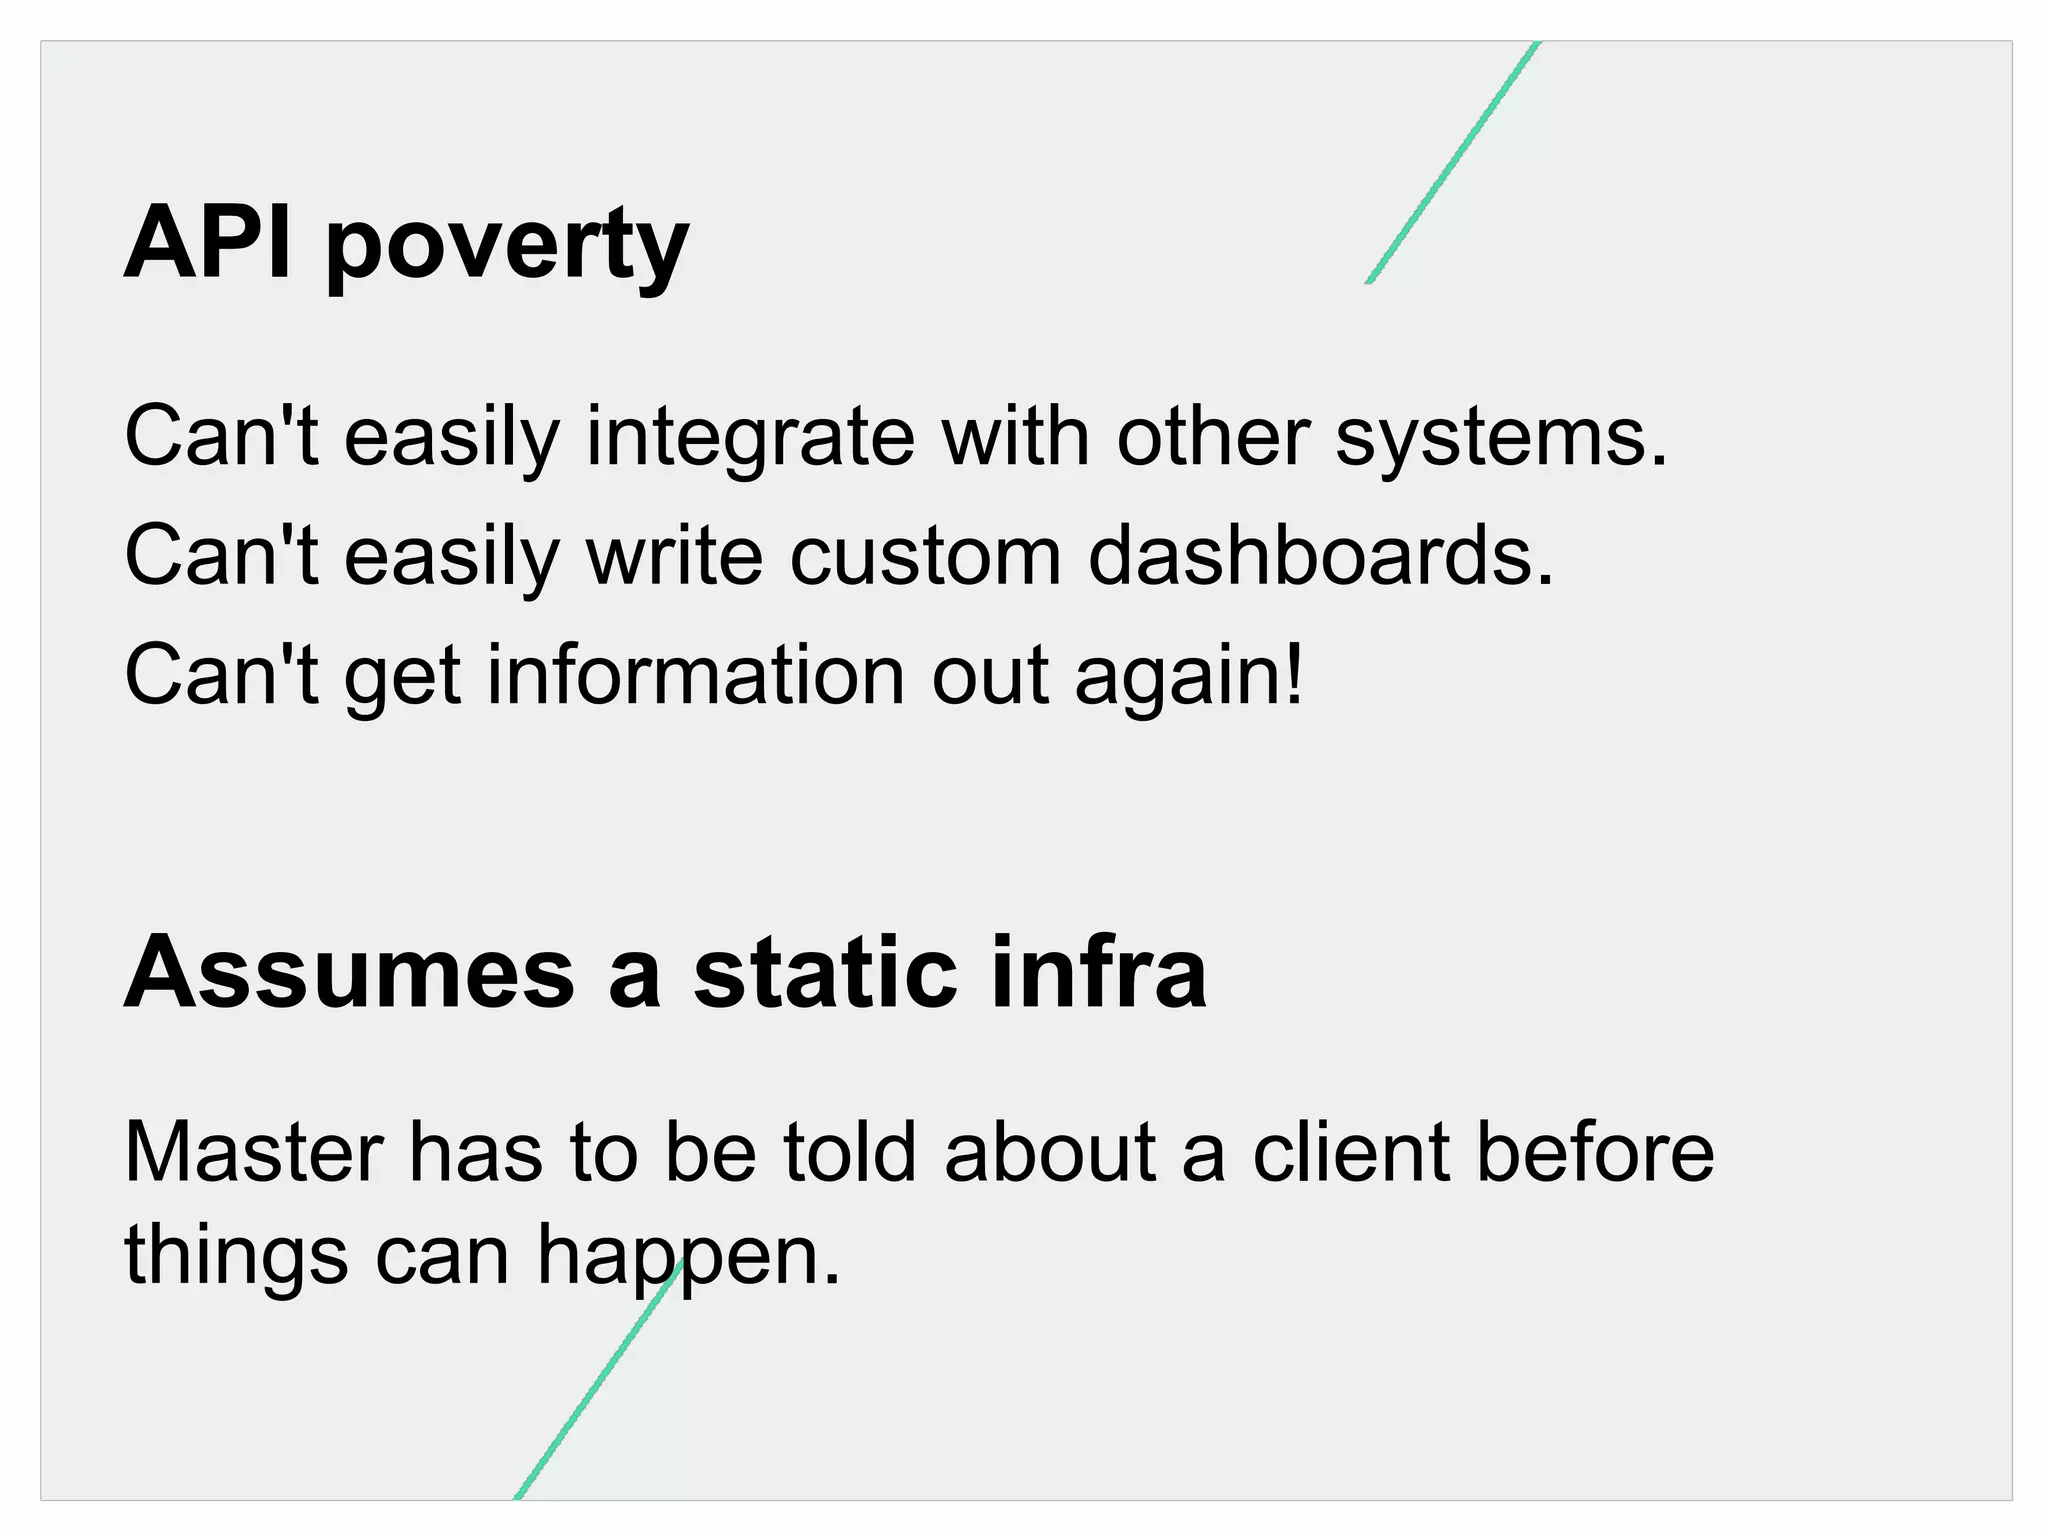
Identifies Nagios' flaws: poor scalability, bad interface, config issues, and limited integration capabilities.
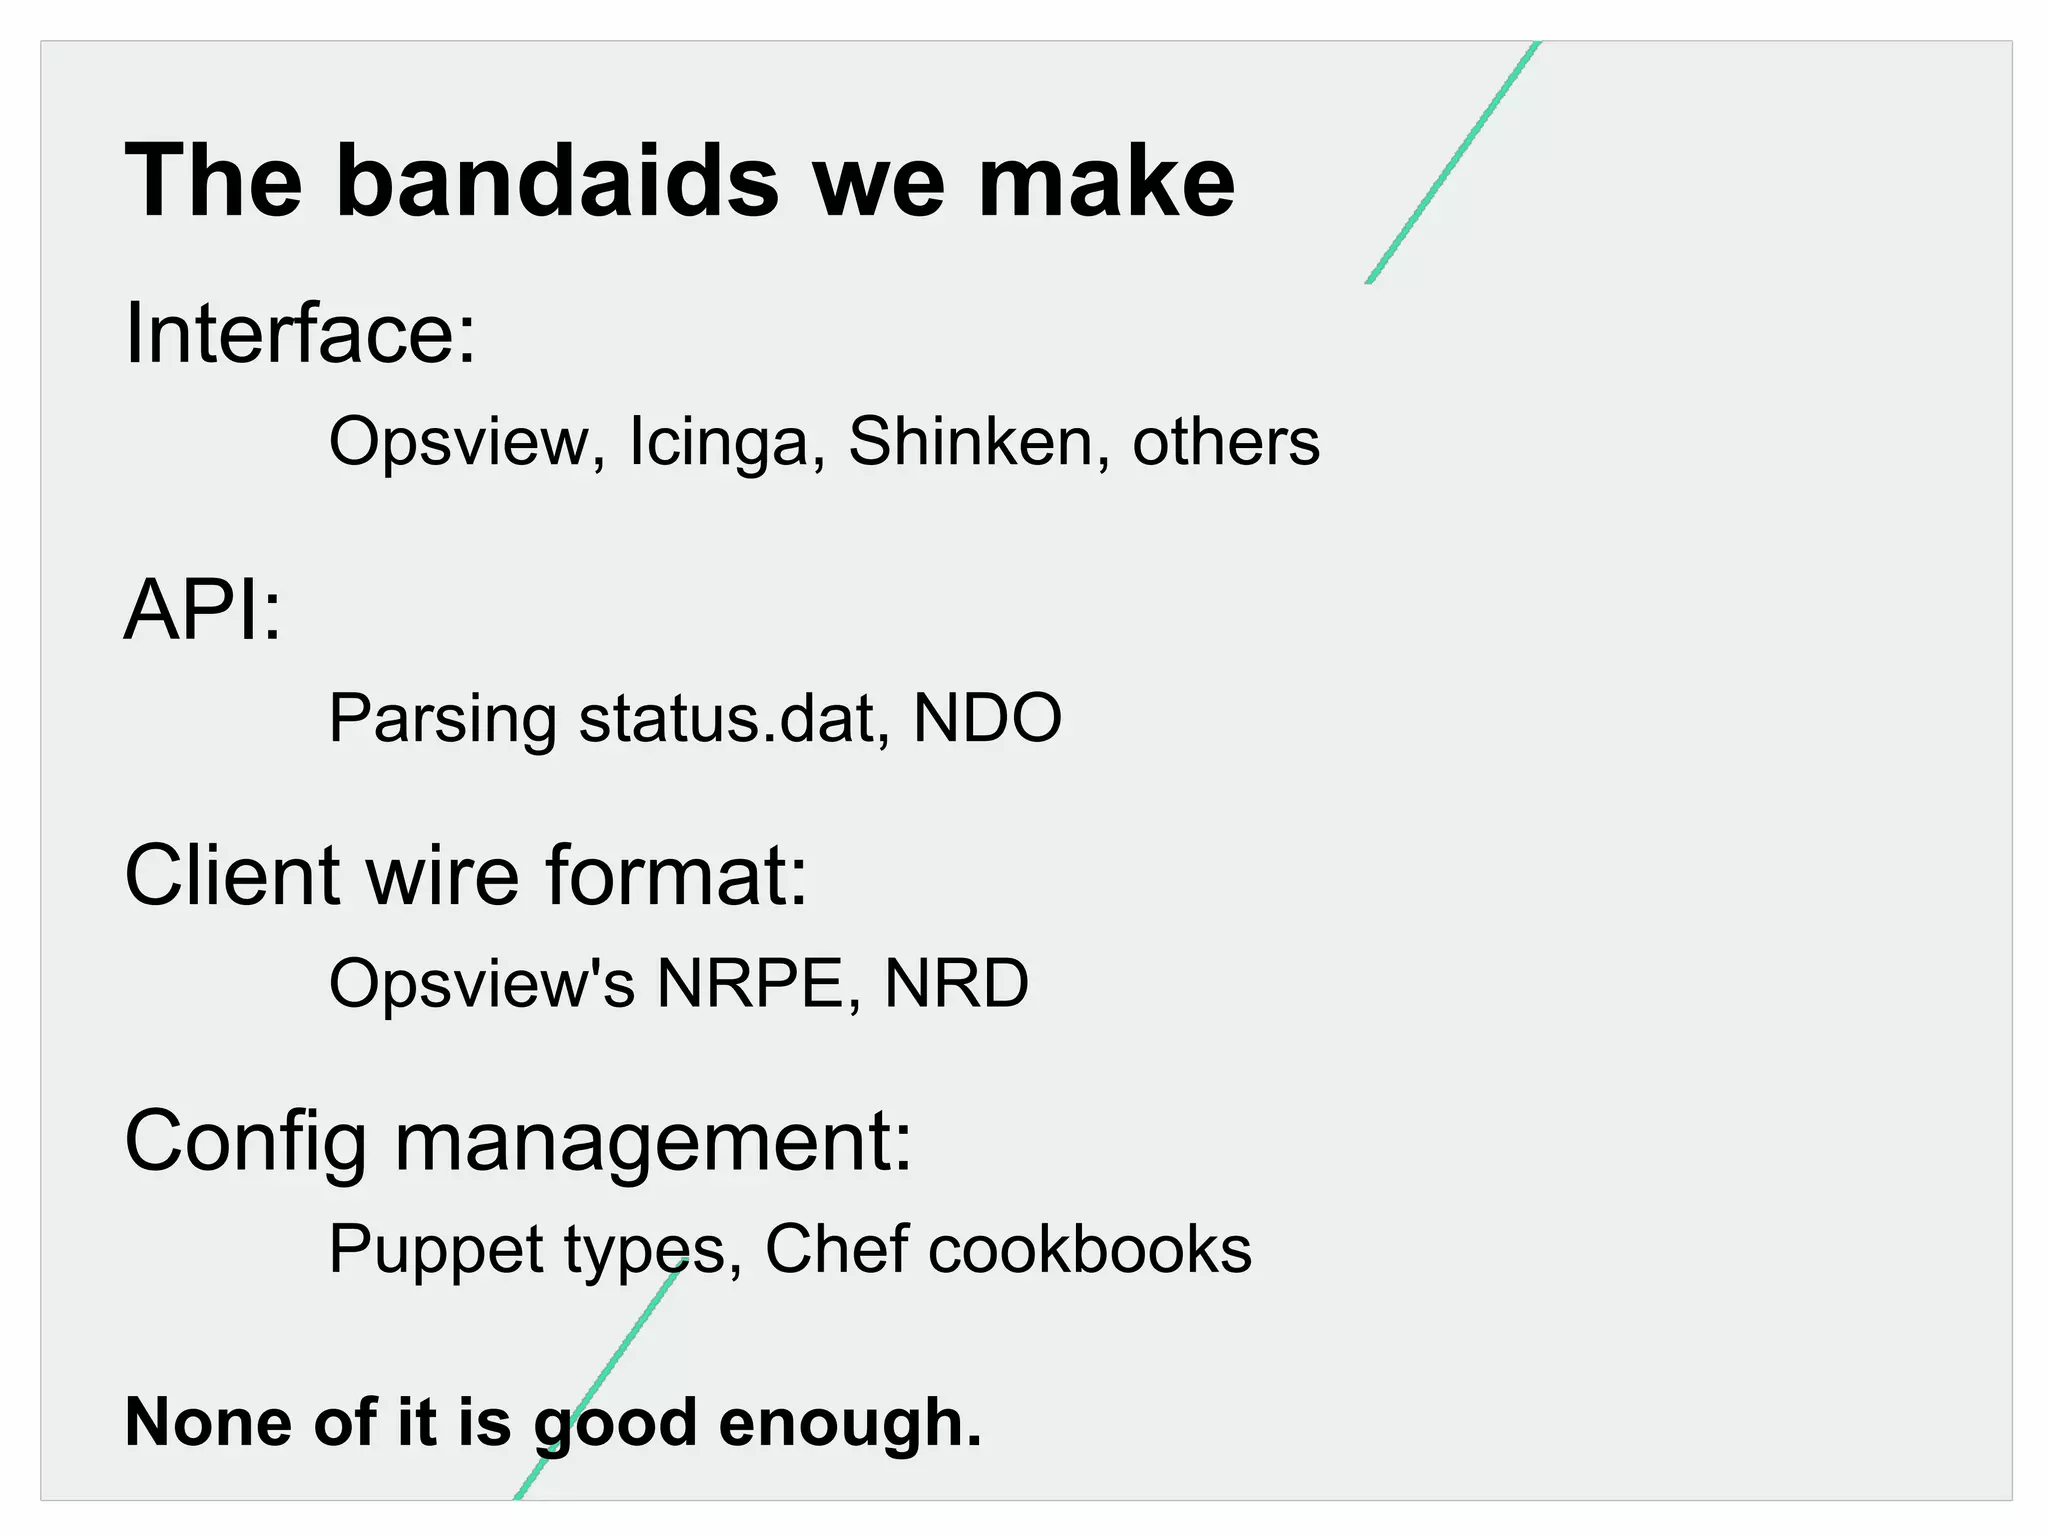
Mentions tools to fix Nagios' shortcomings and stresses the need for better monitoring solutions.
Suggestions to build better systems using strengths of Nagios; discussion on existing tools and options.
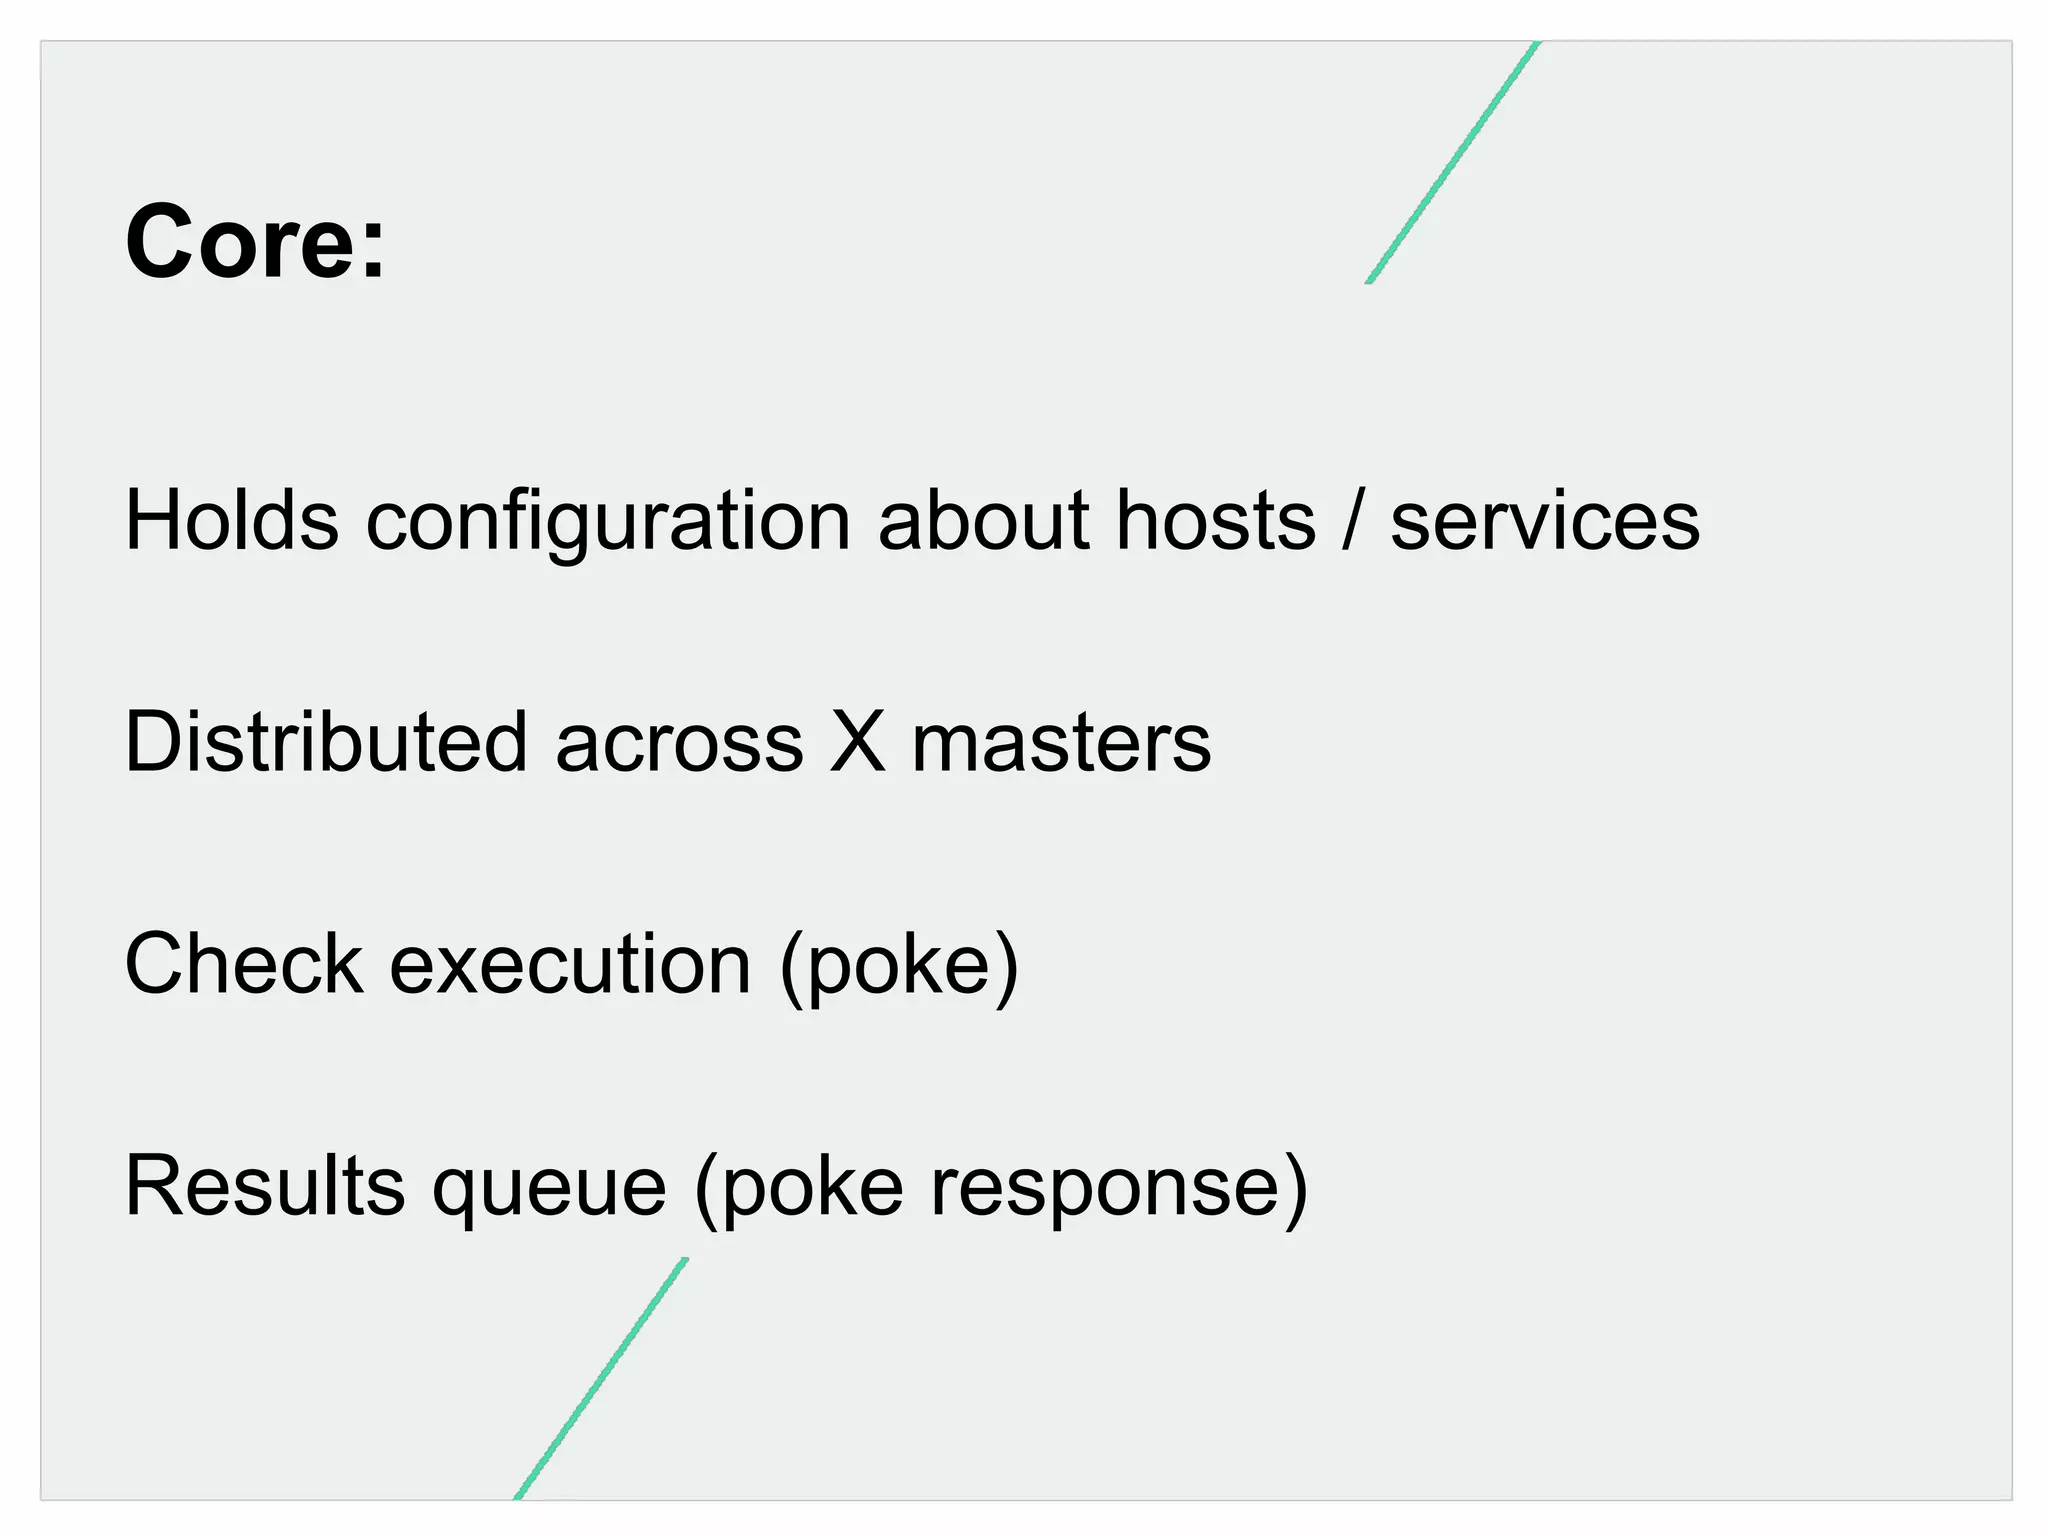
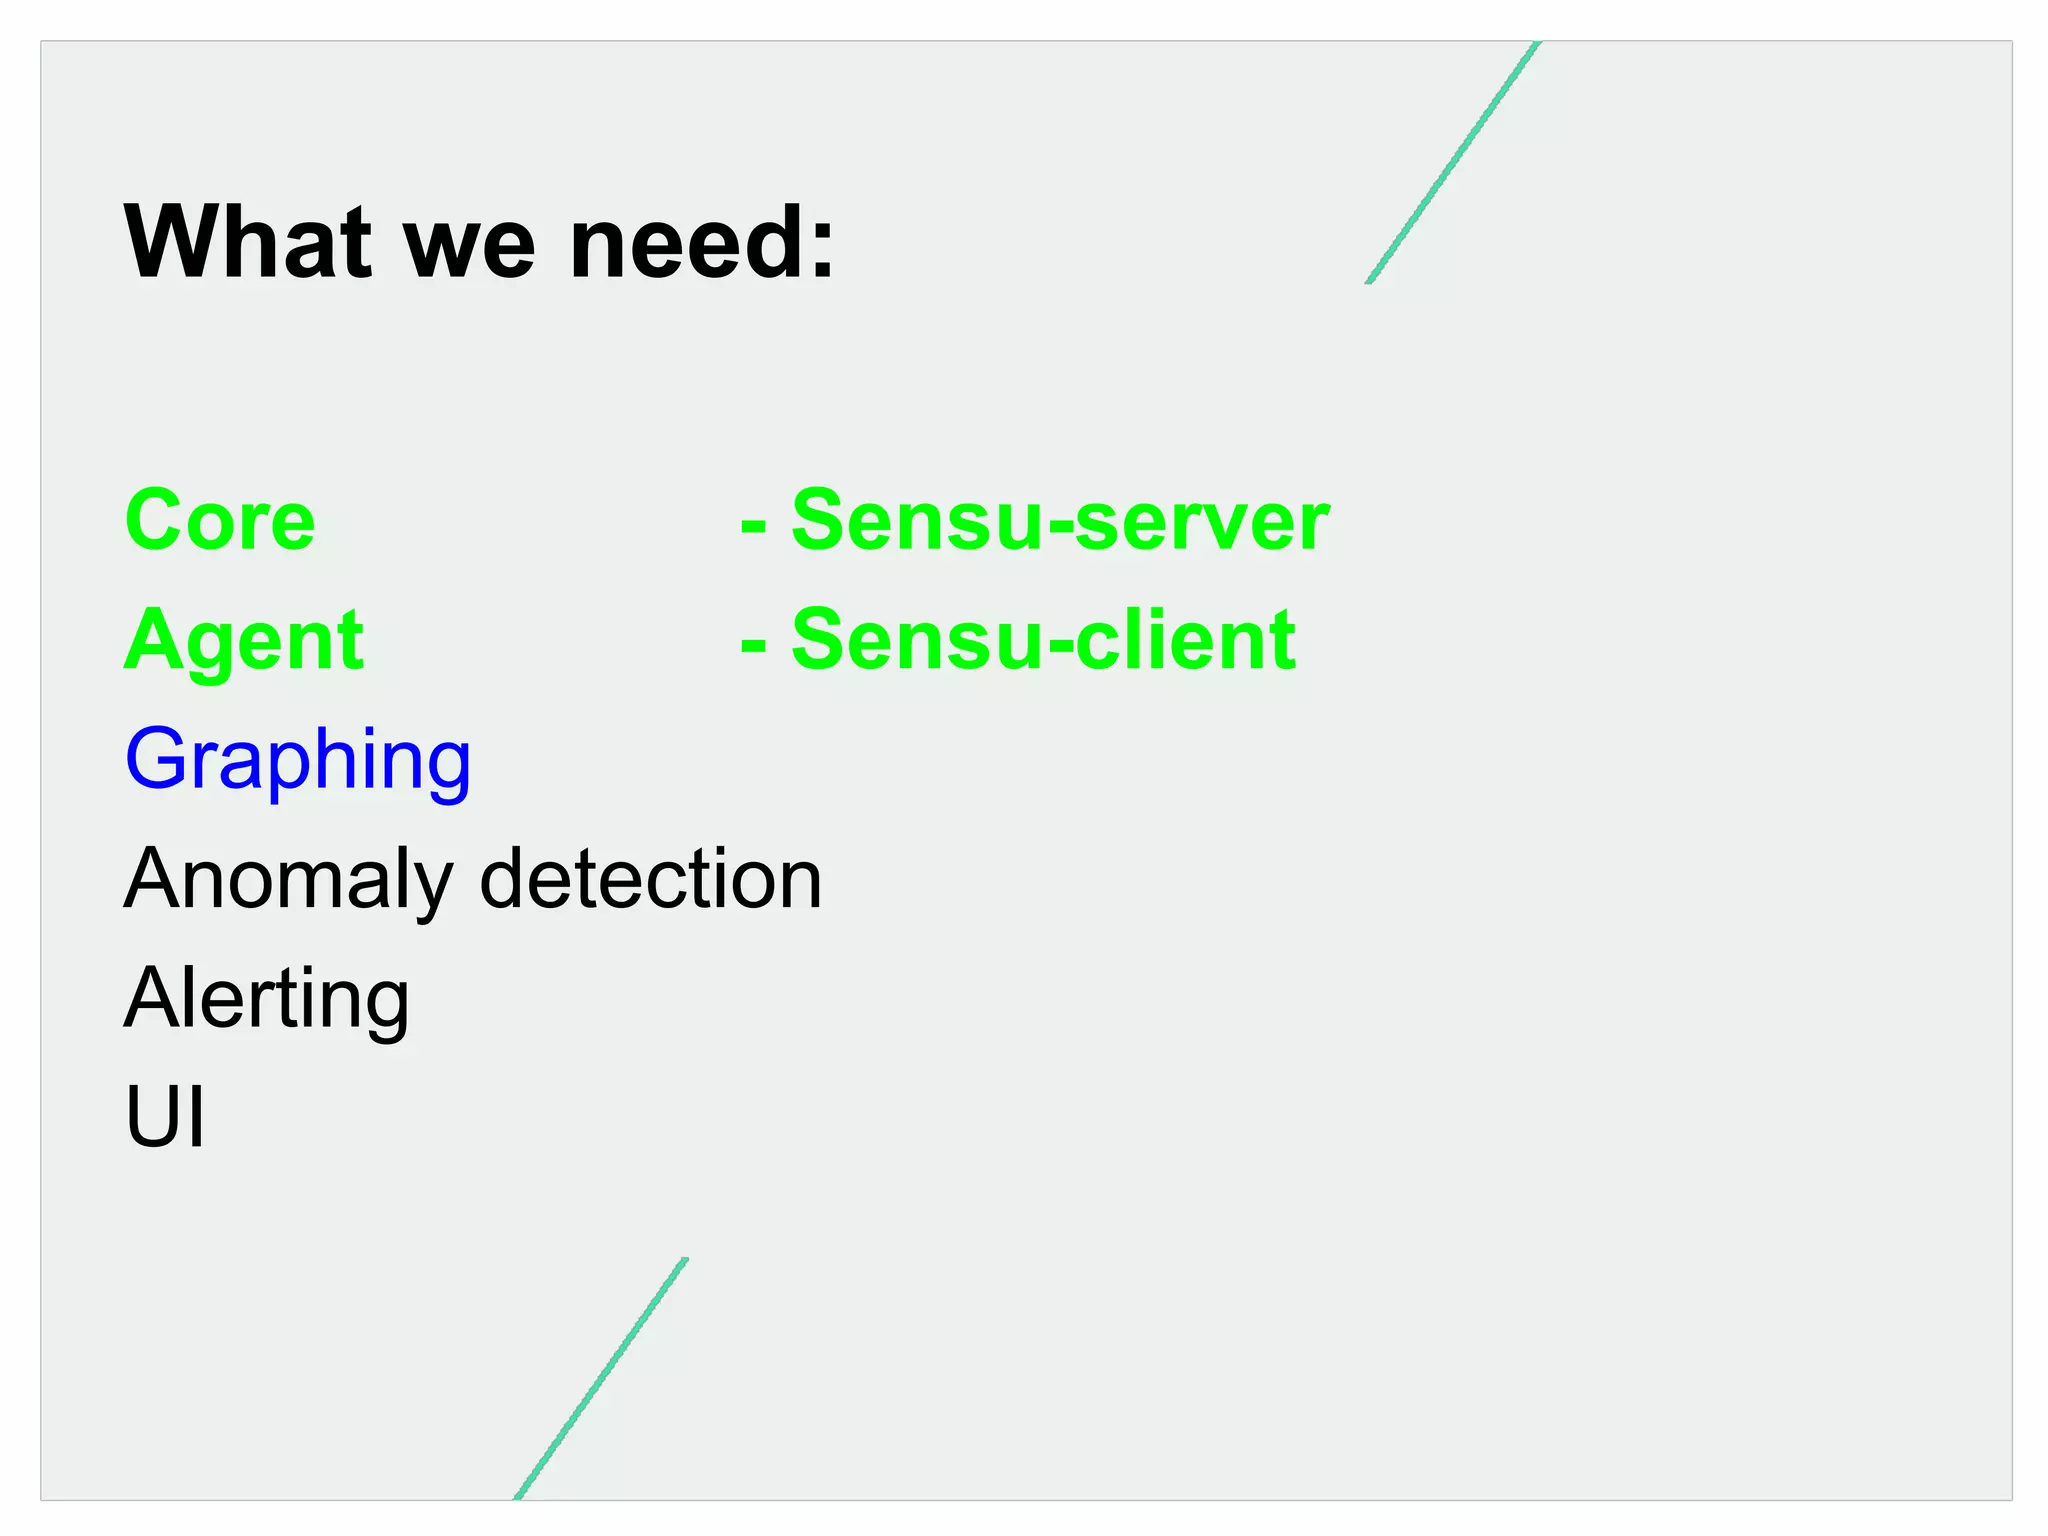
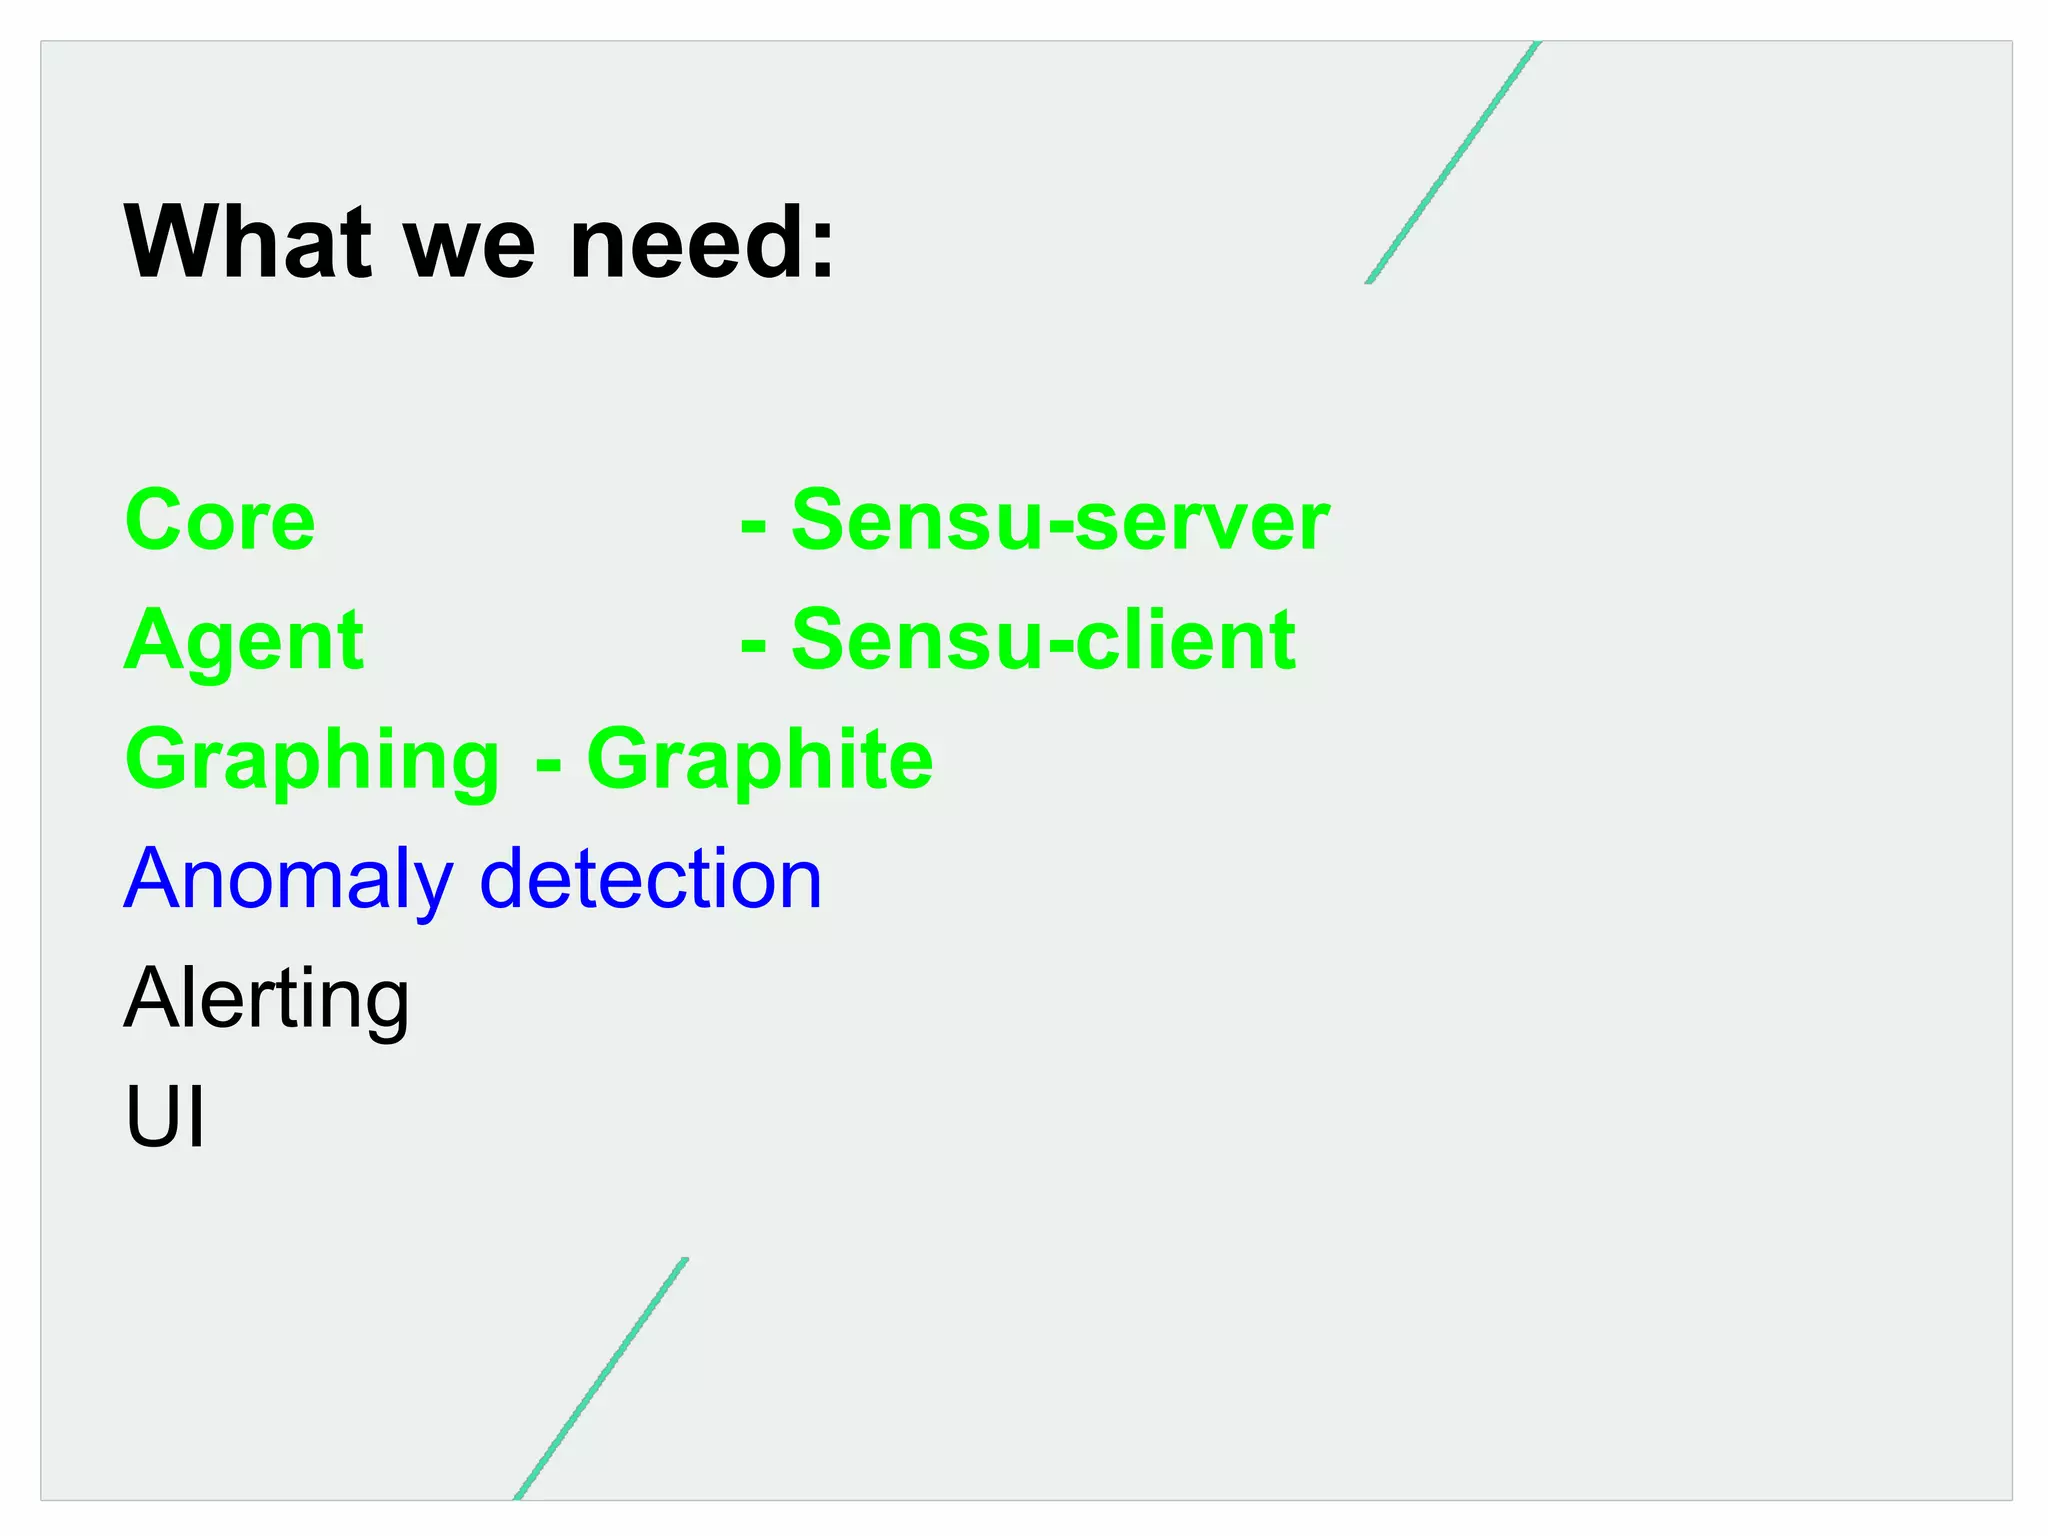
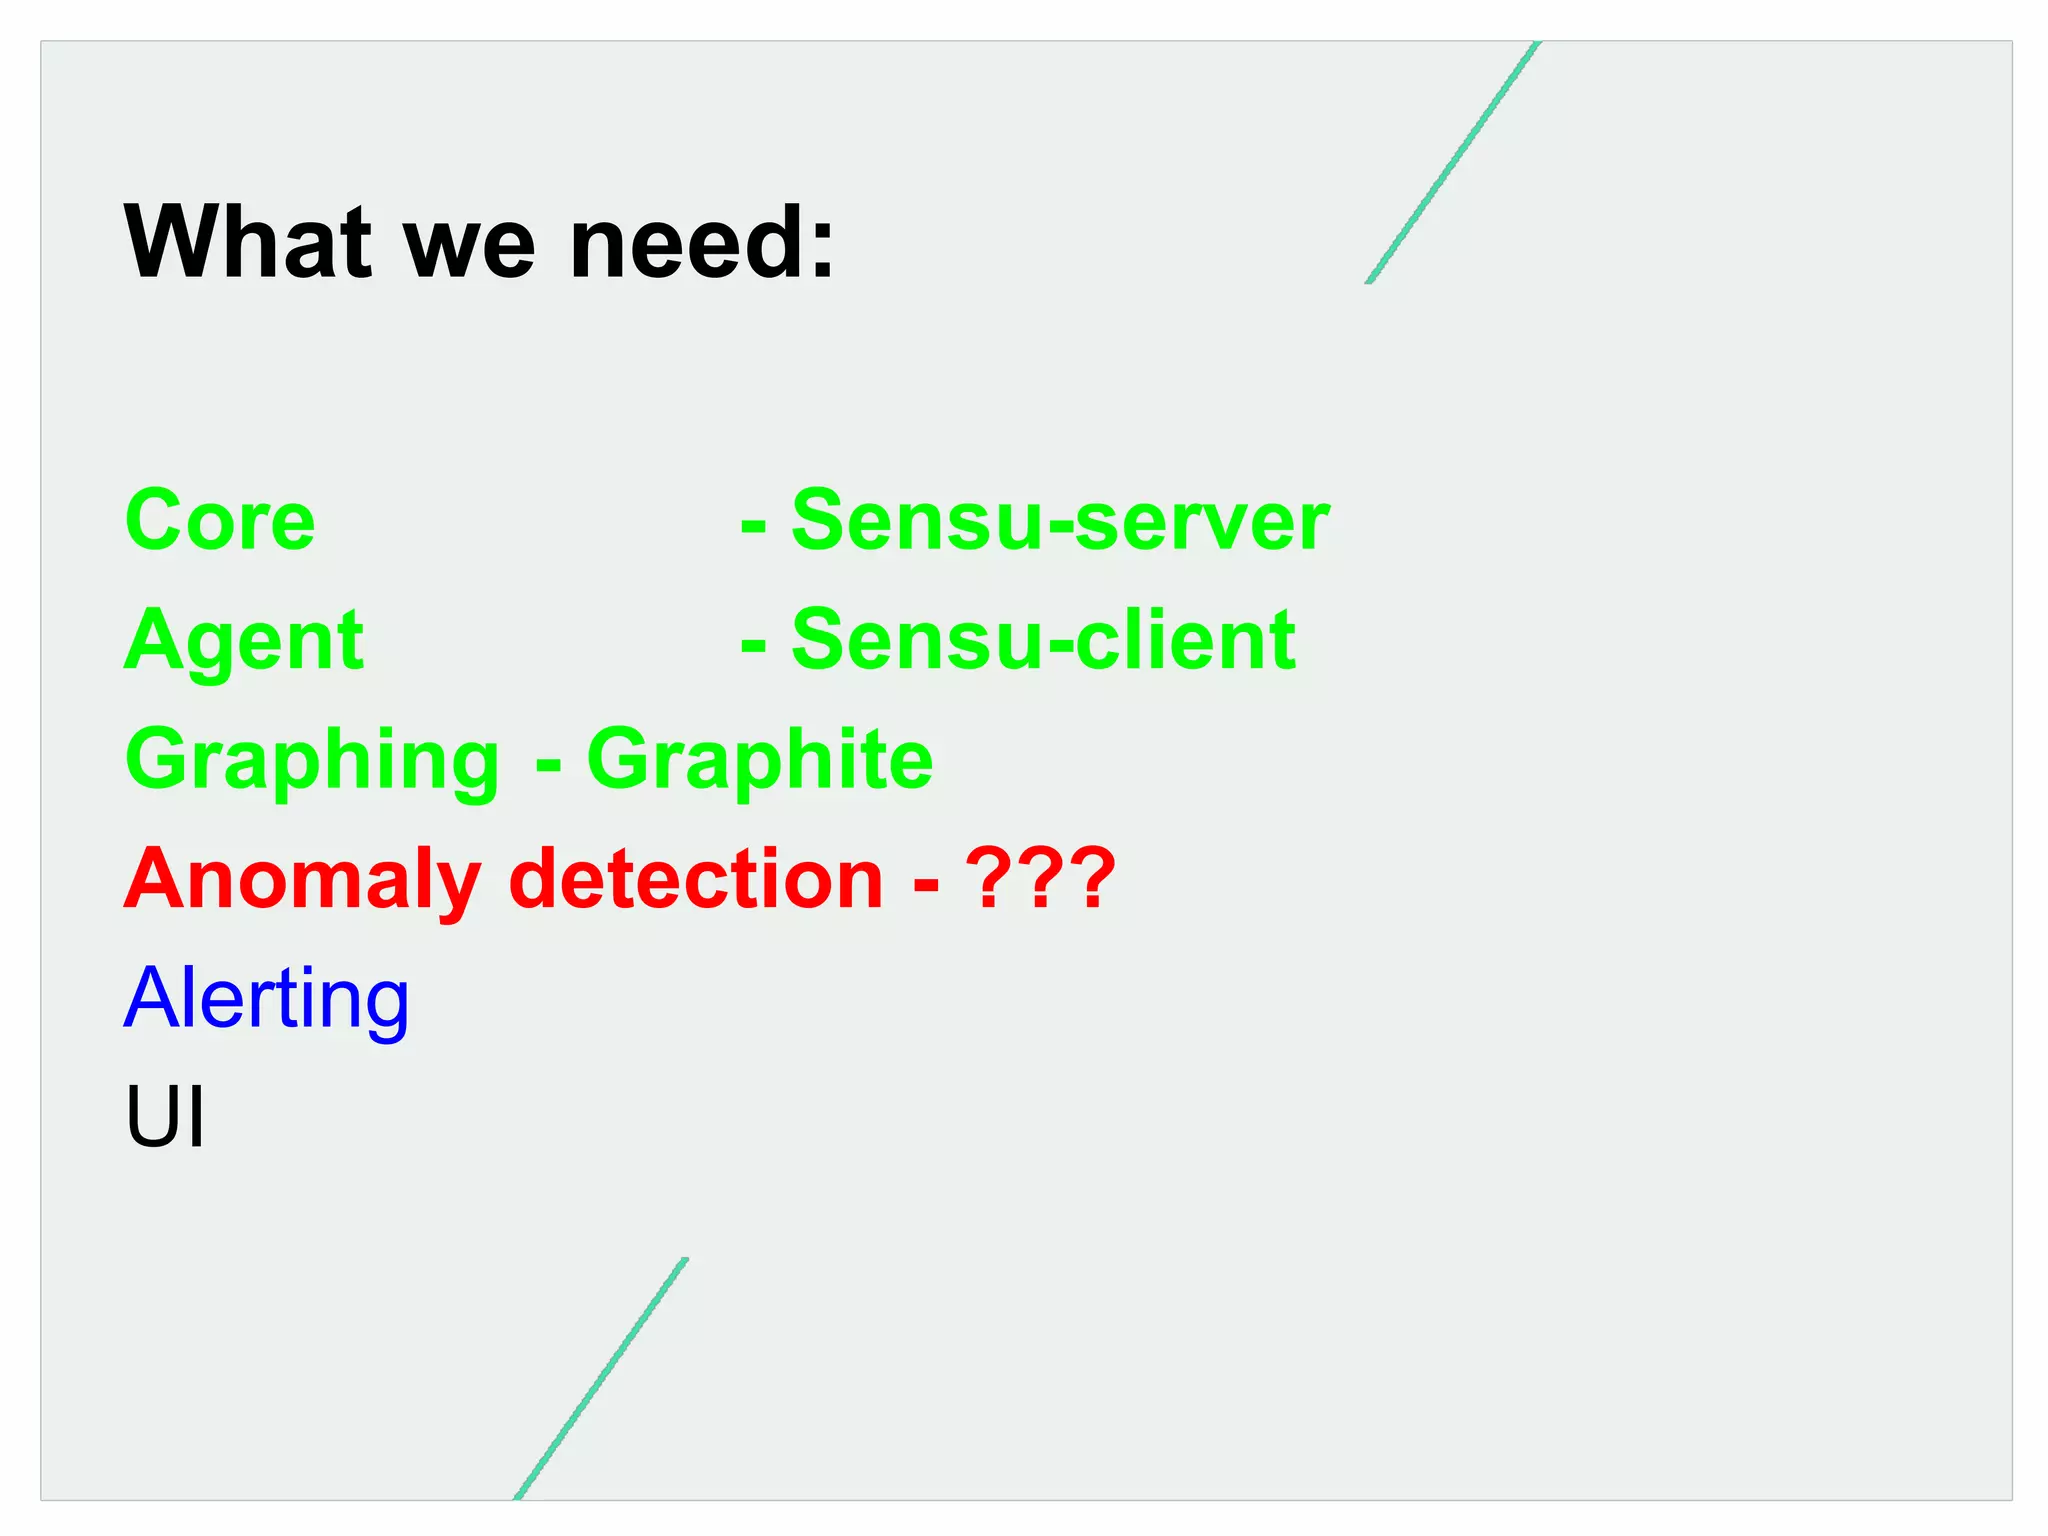
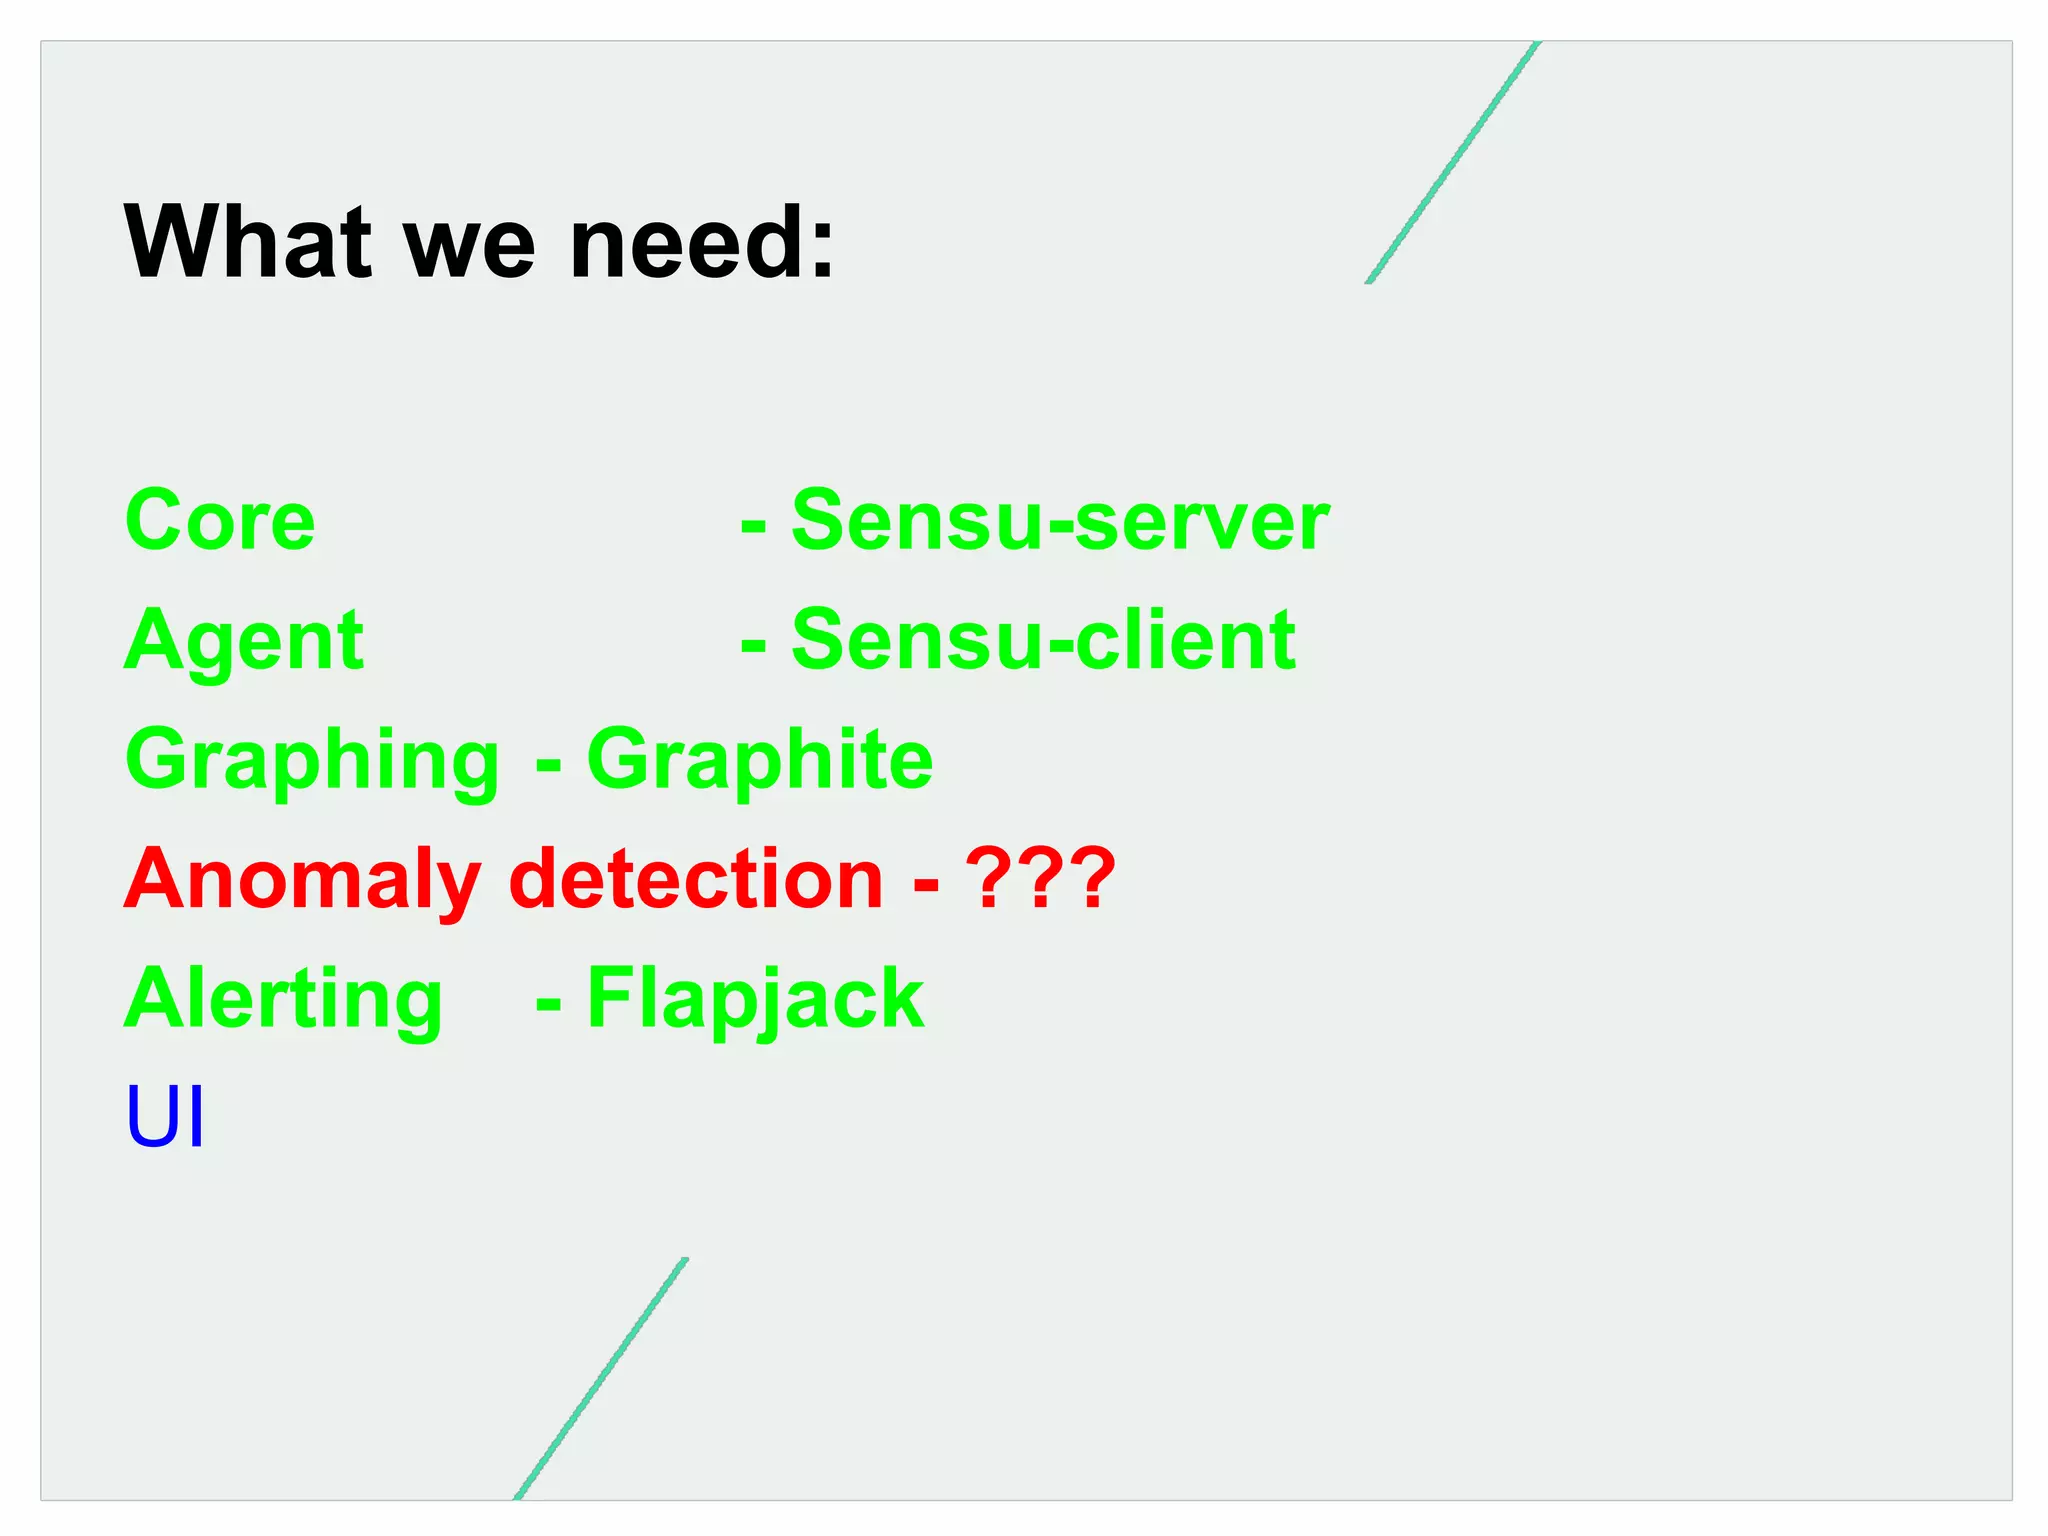
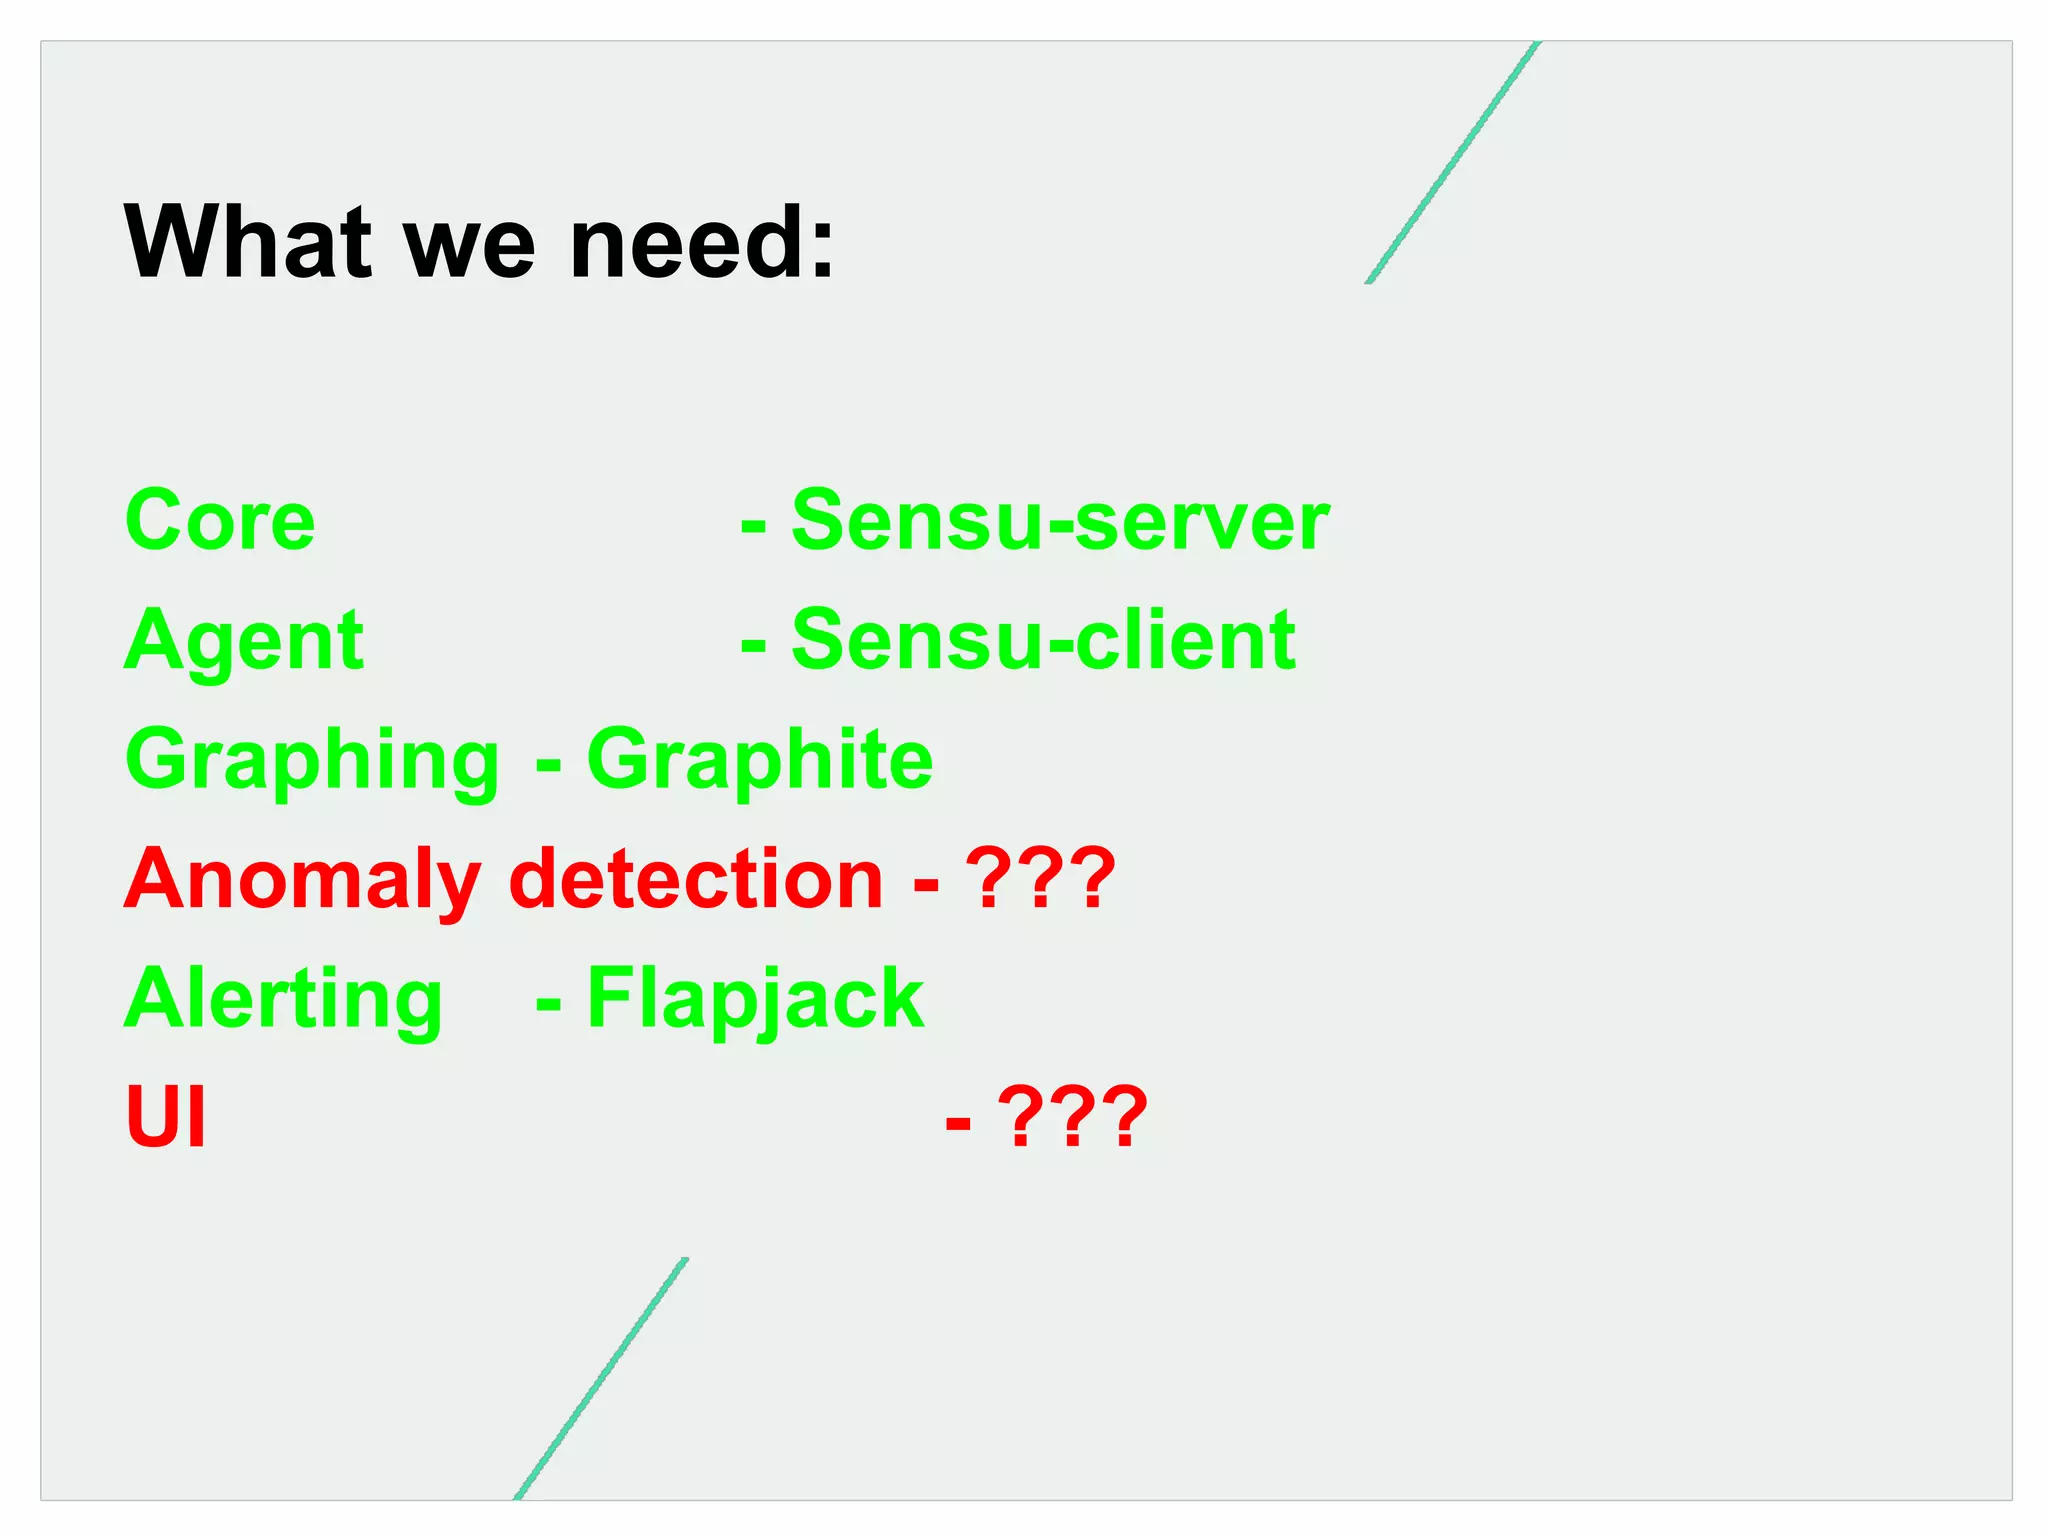
Proposes using Sensu for monitoring; outlines core components needed for an evolved monitoring system.
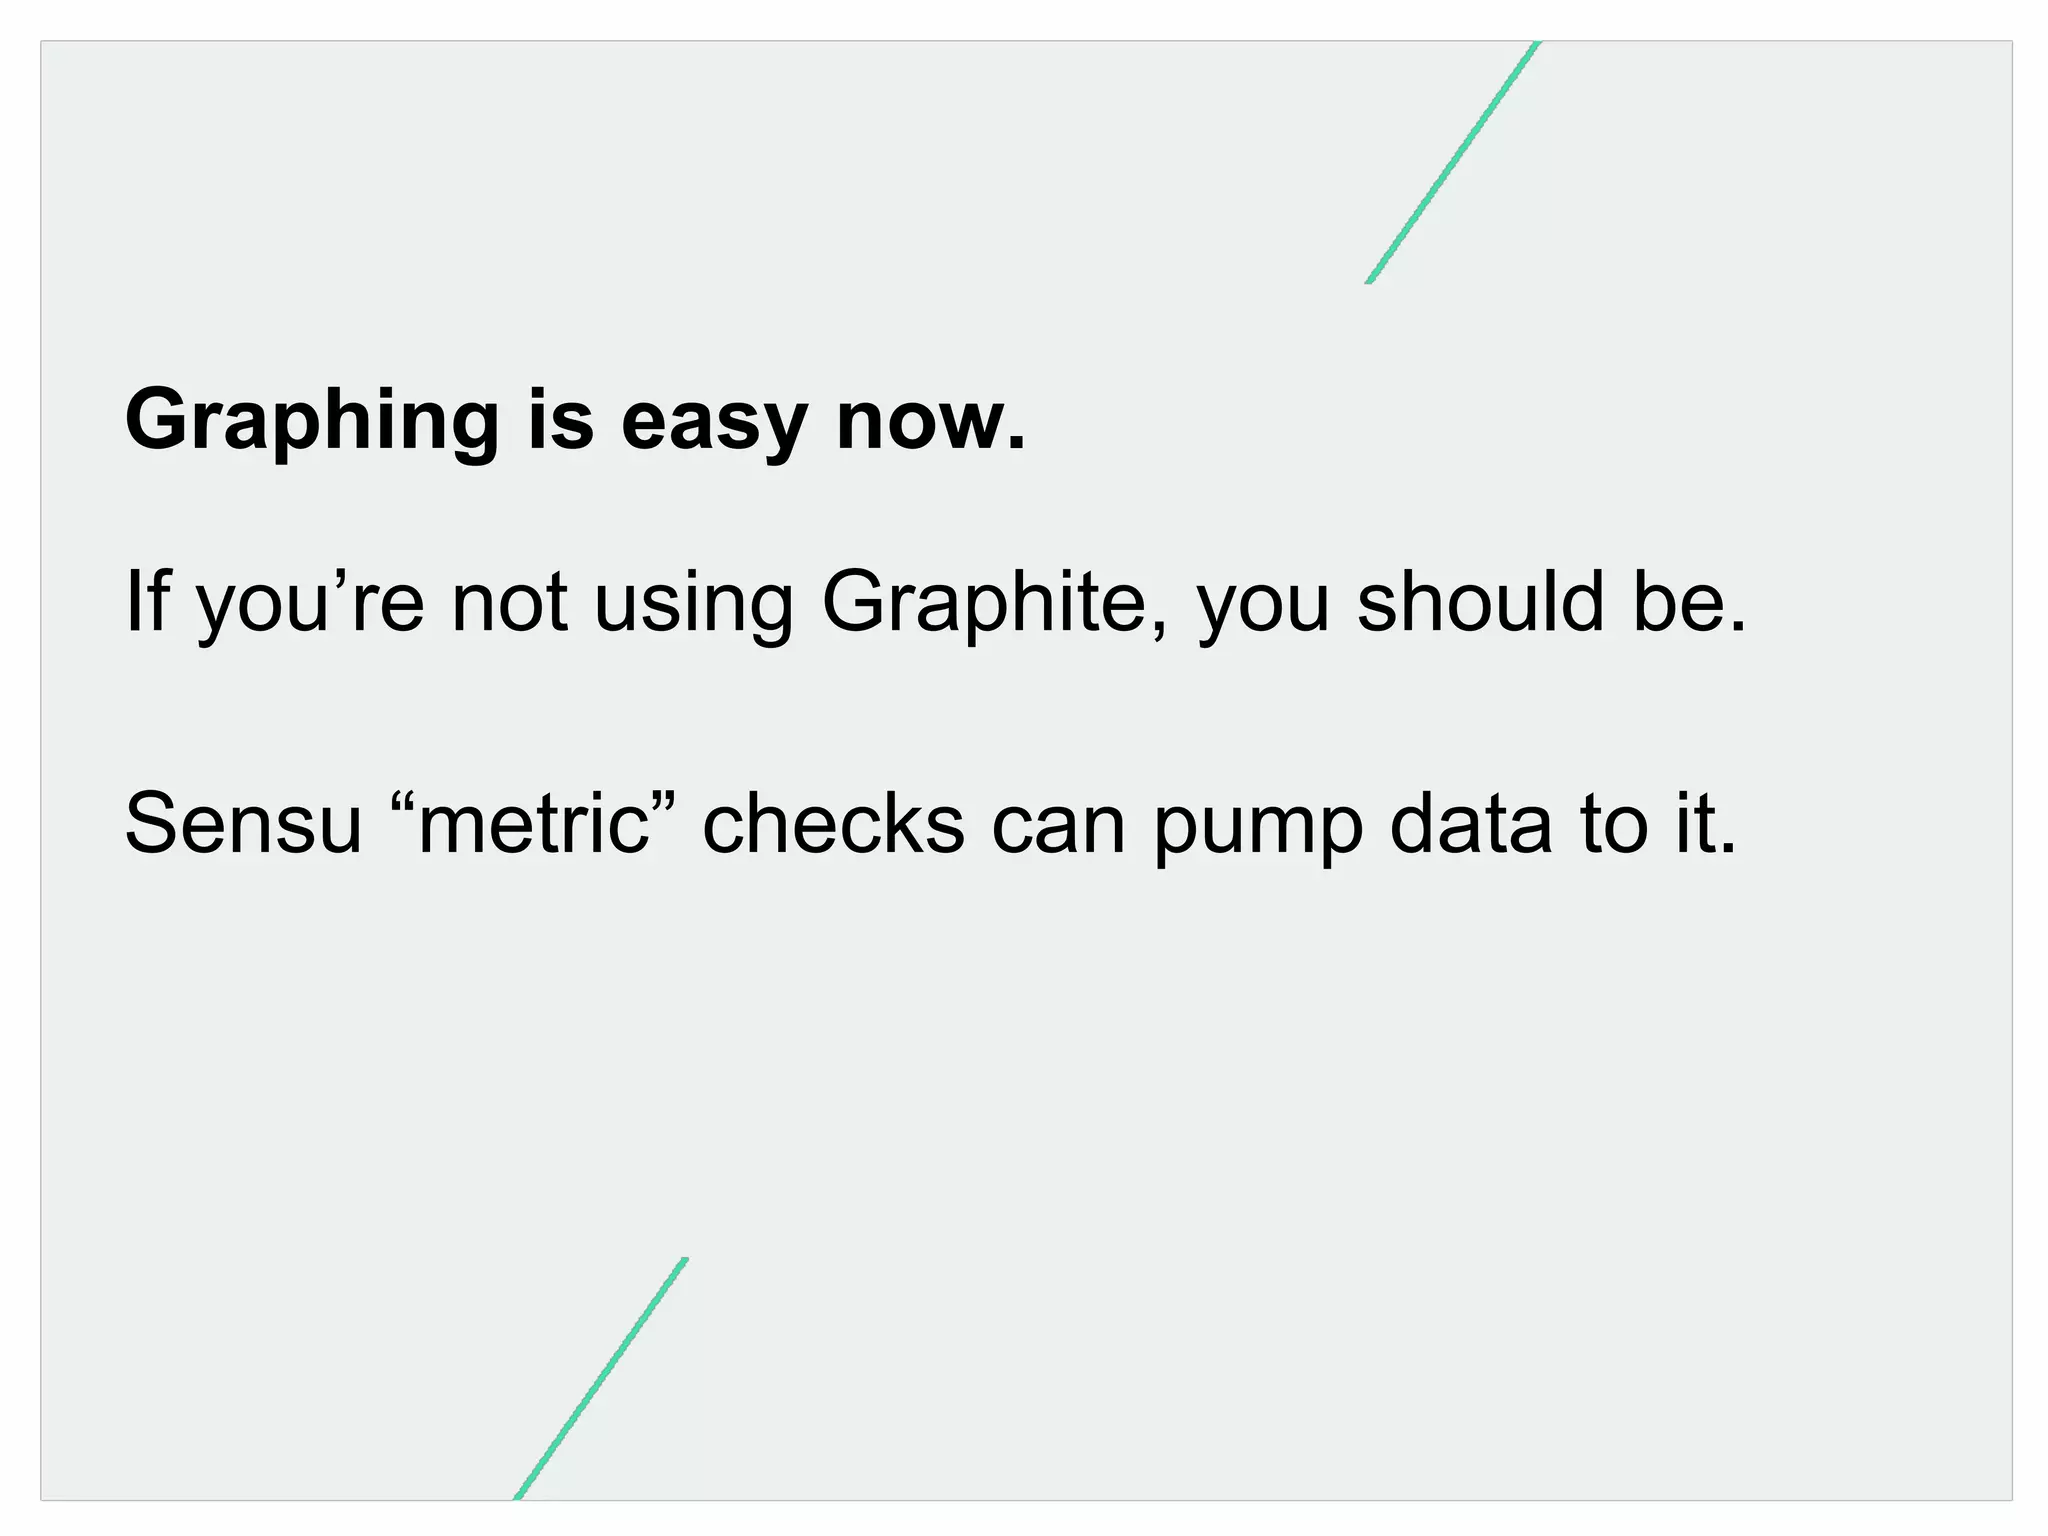
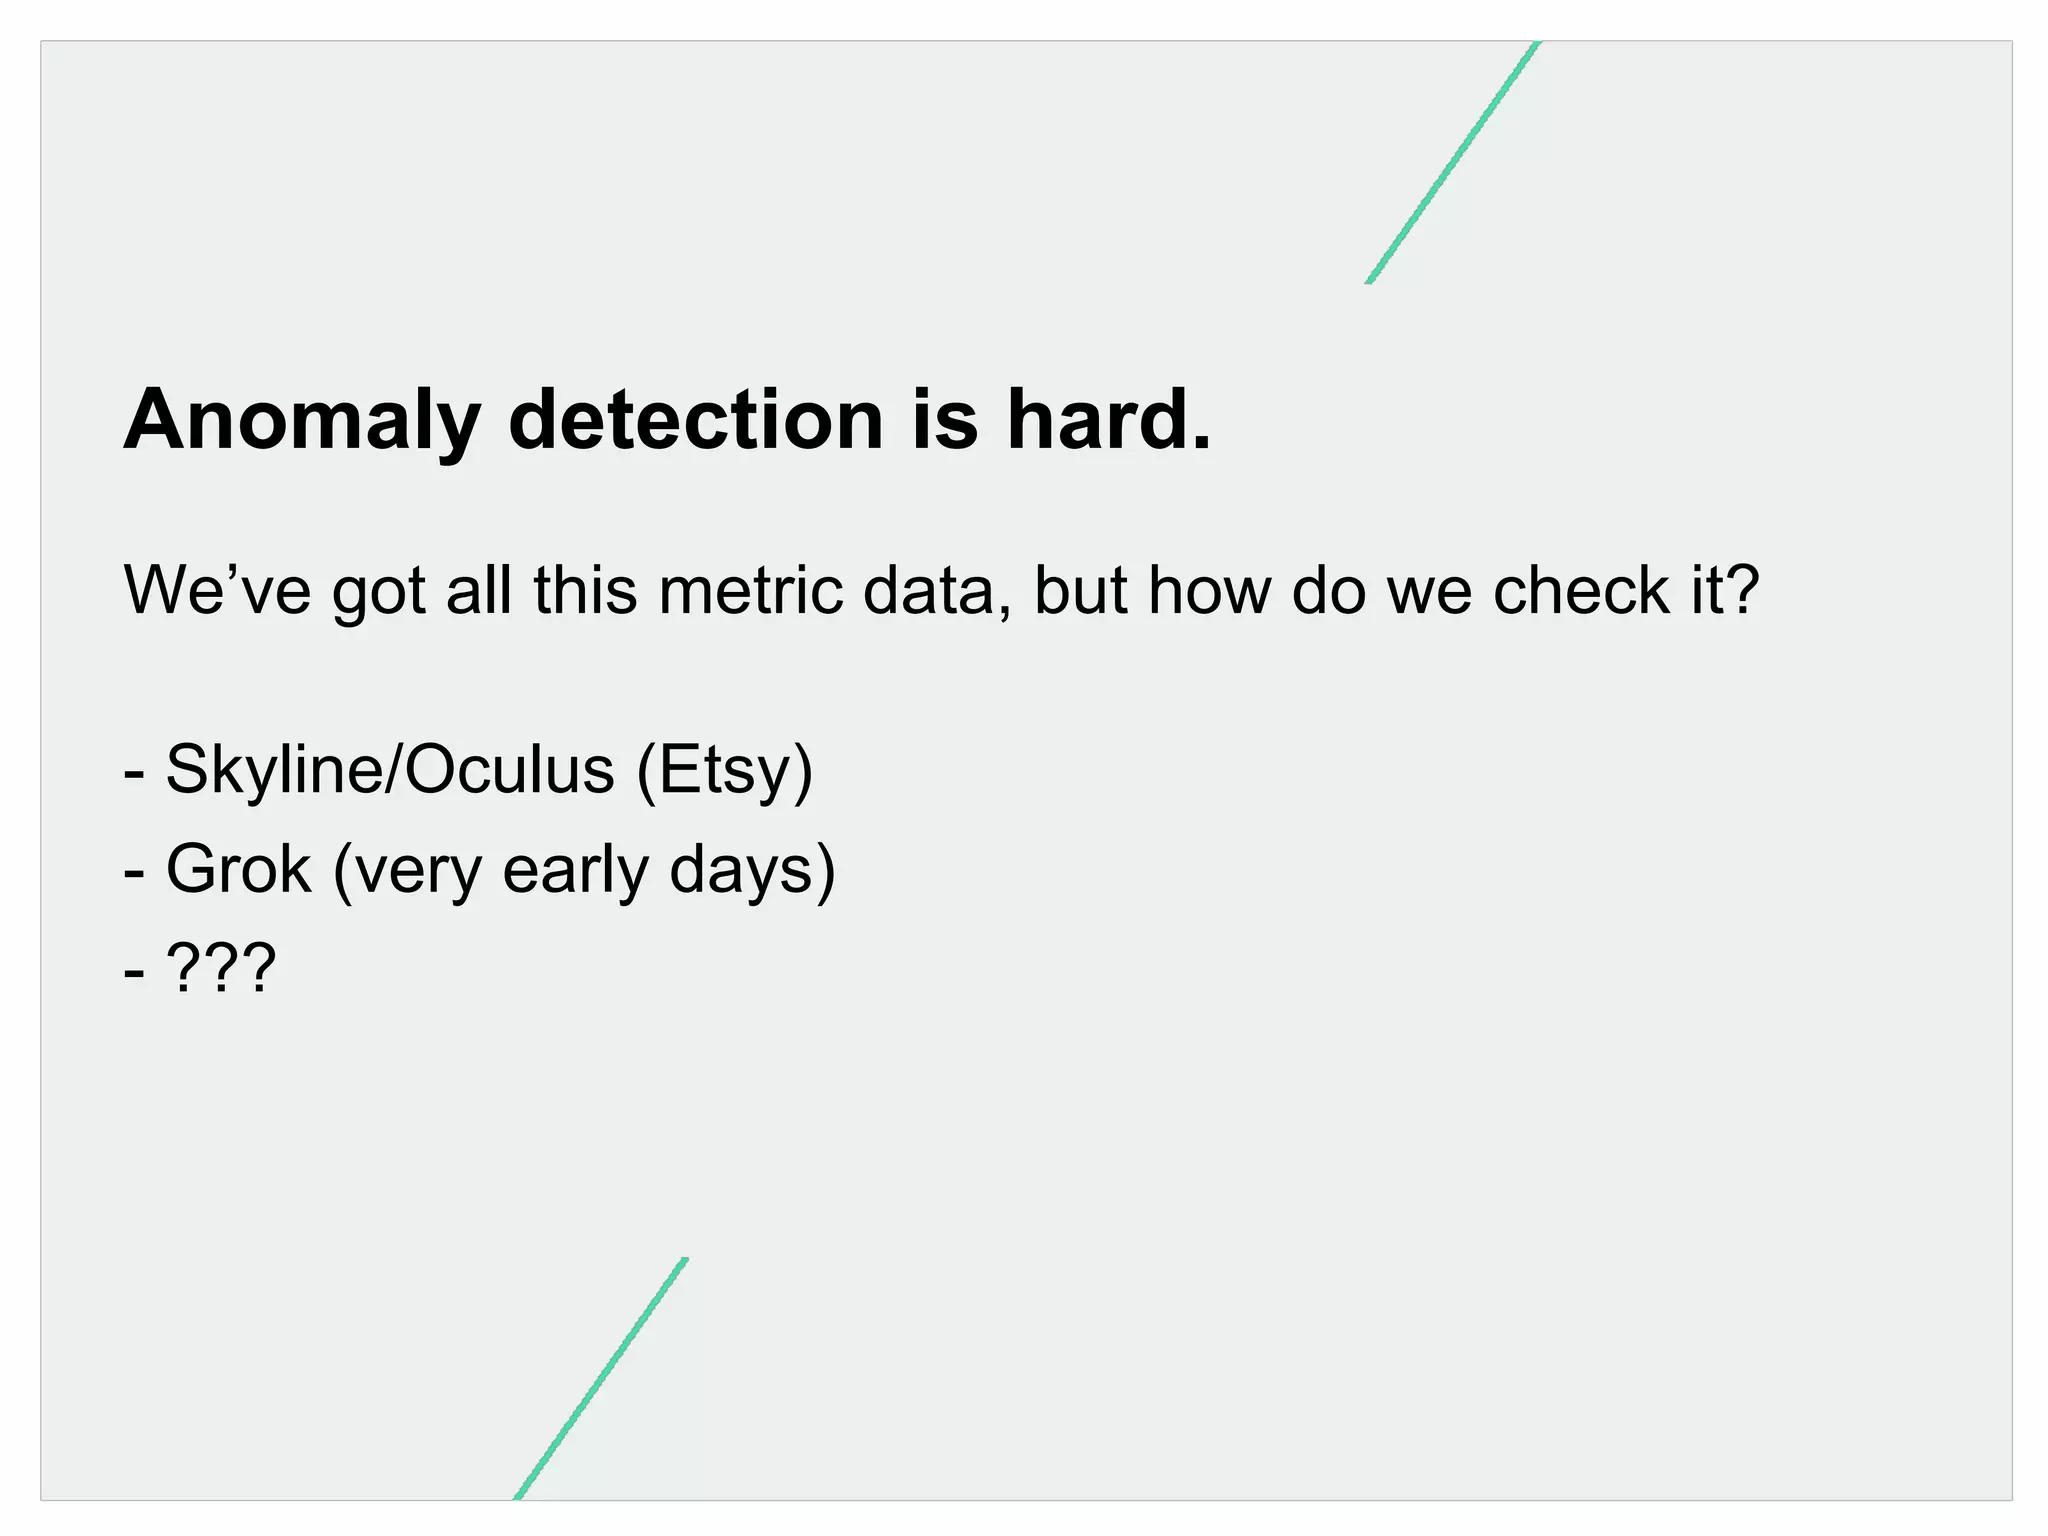
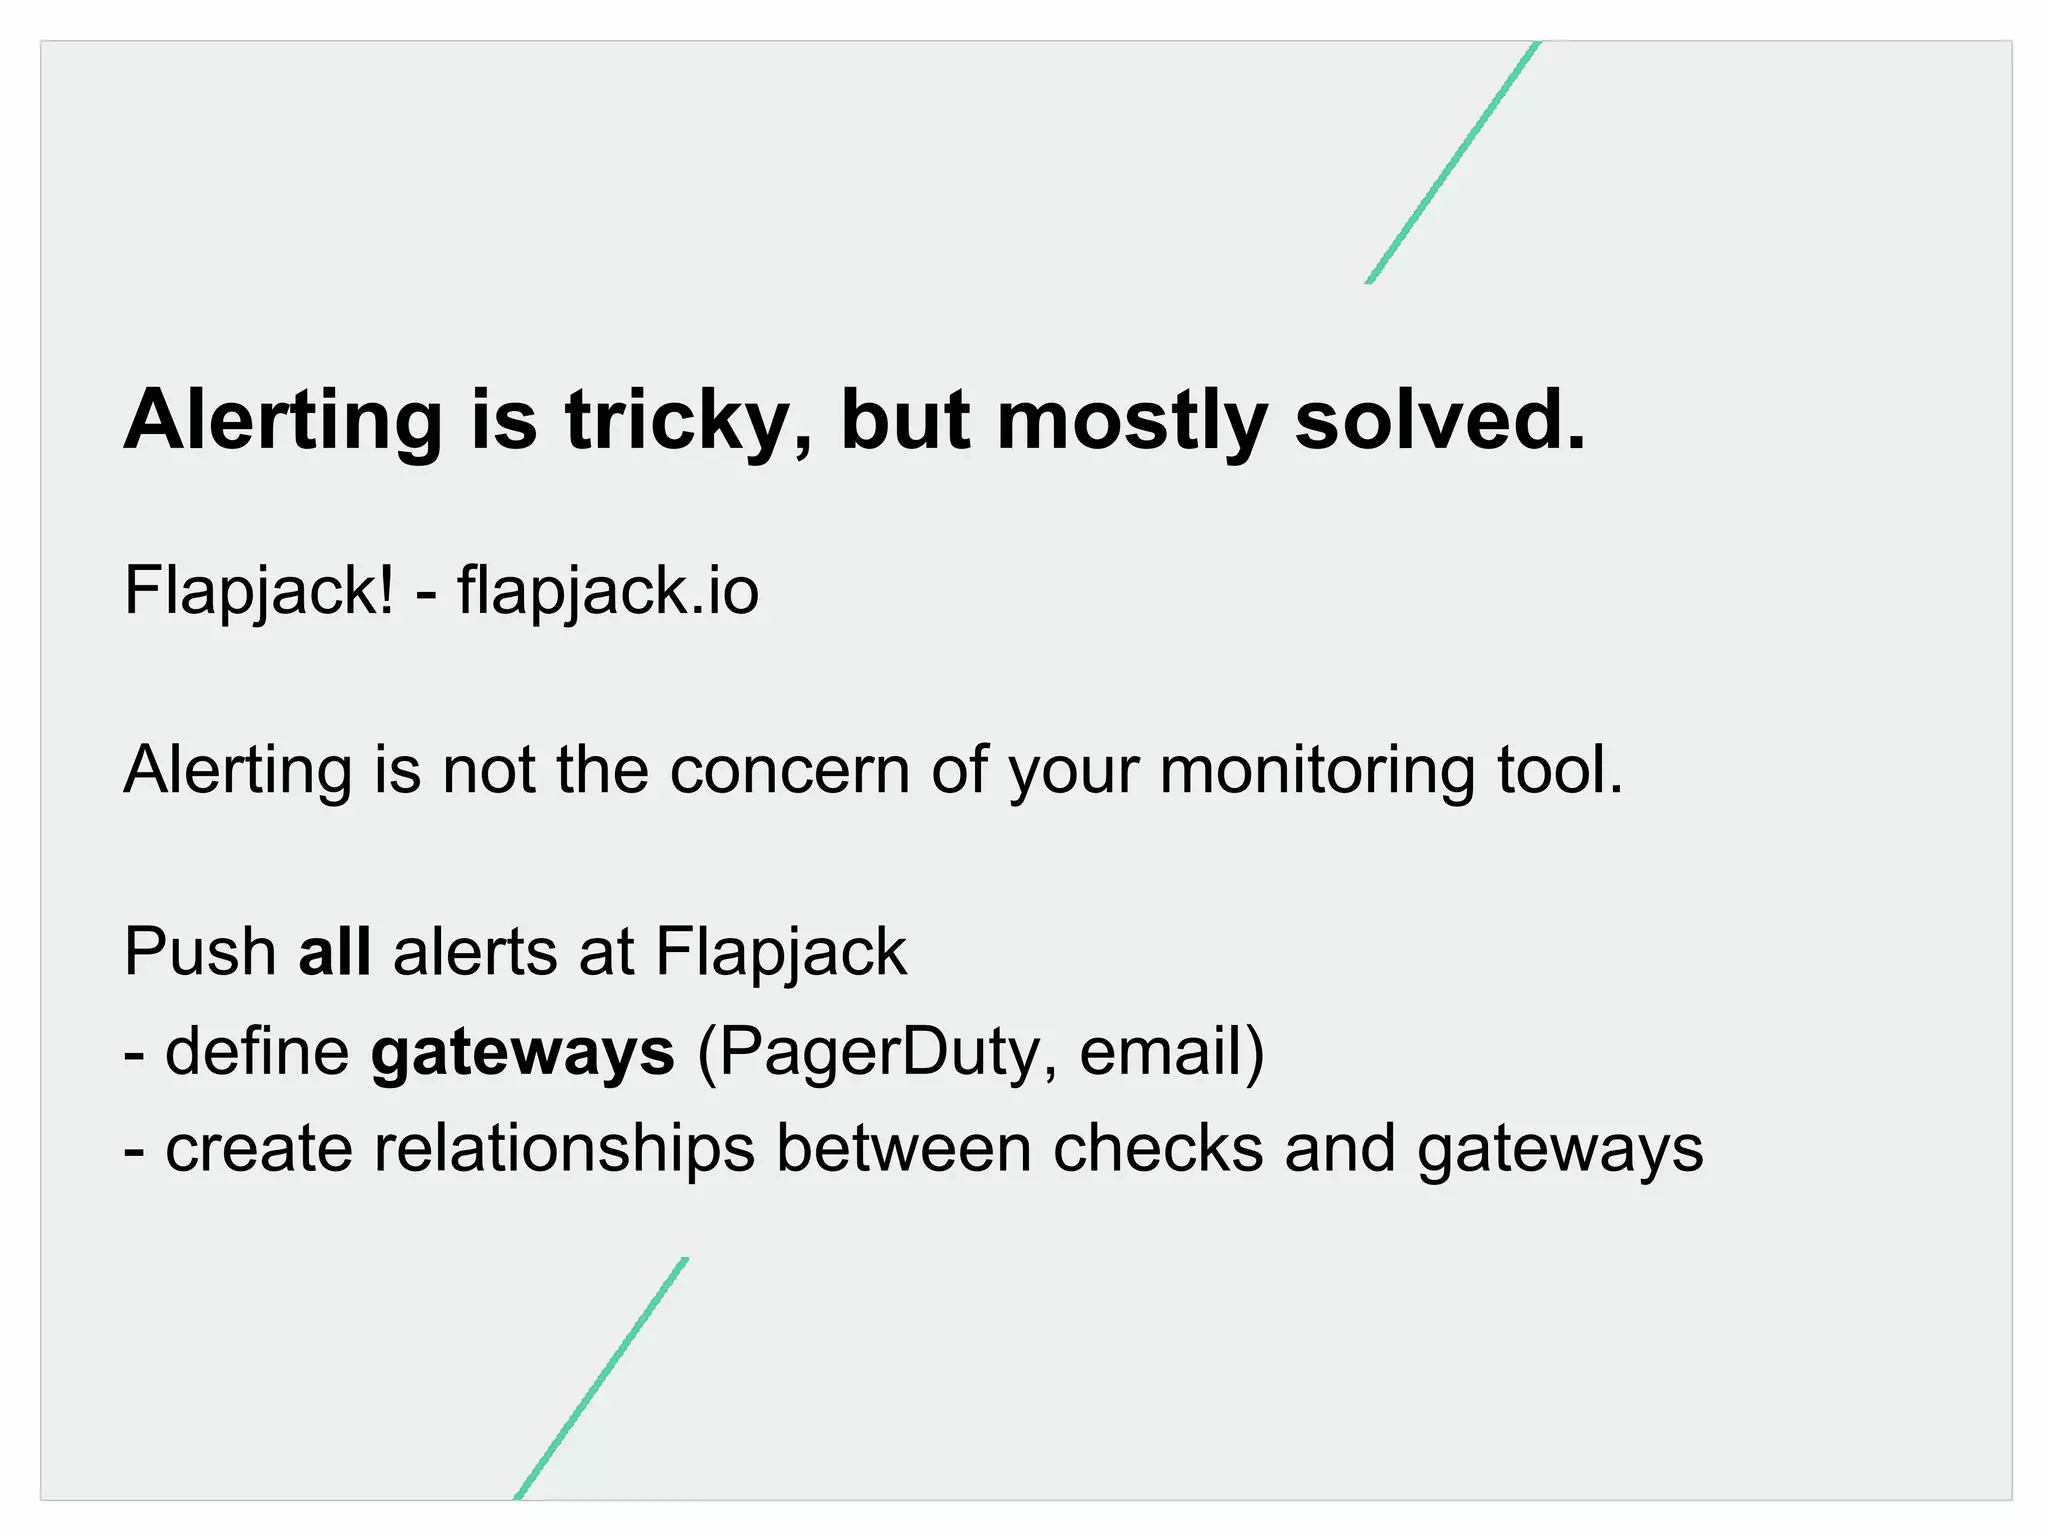
Details required elements: anomaly detection, graphing with Graphite, alerting mechanisms like Flapjack.
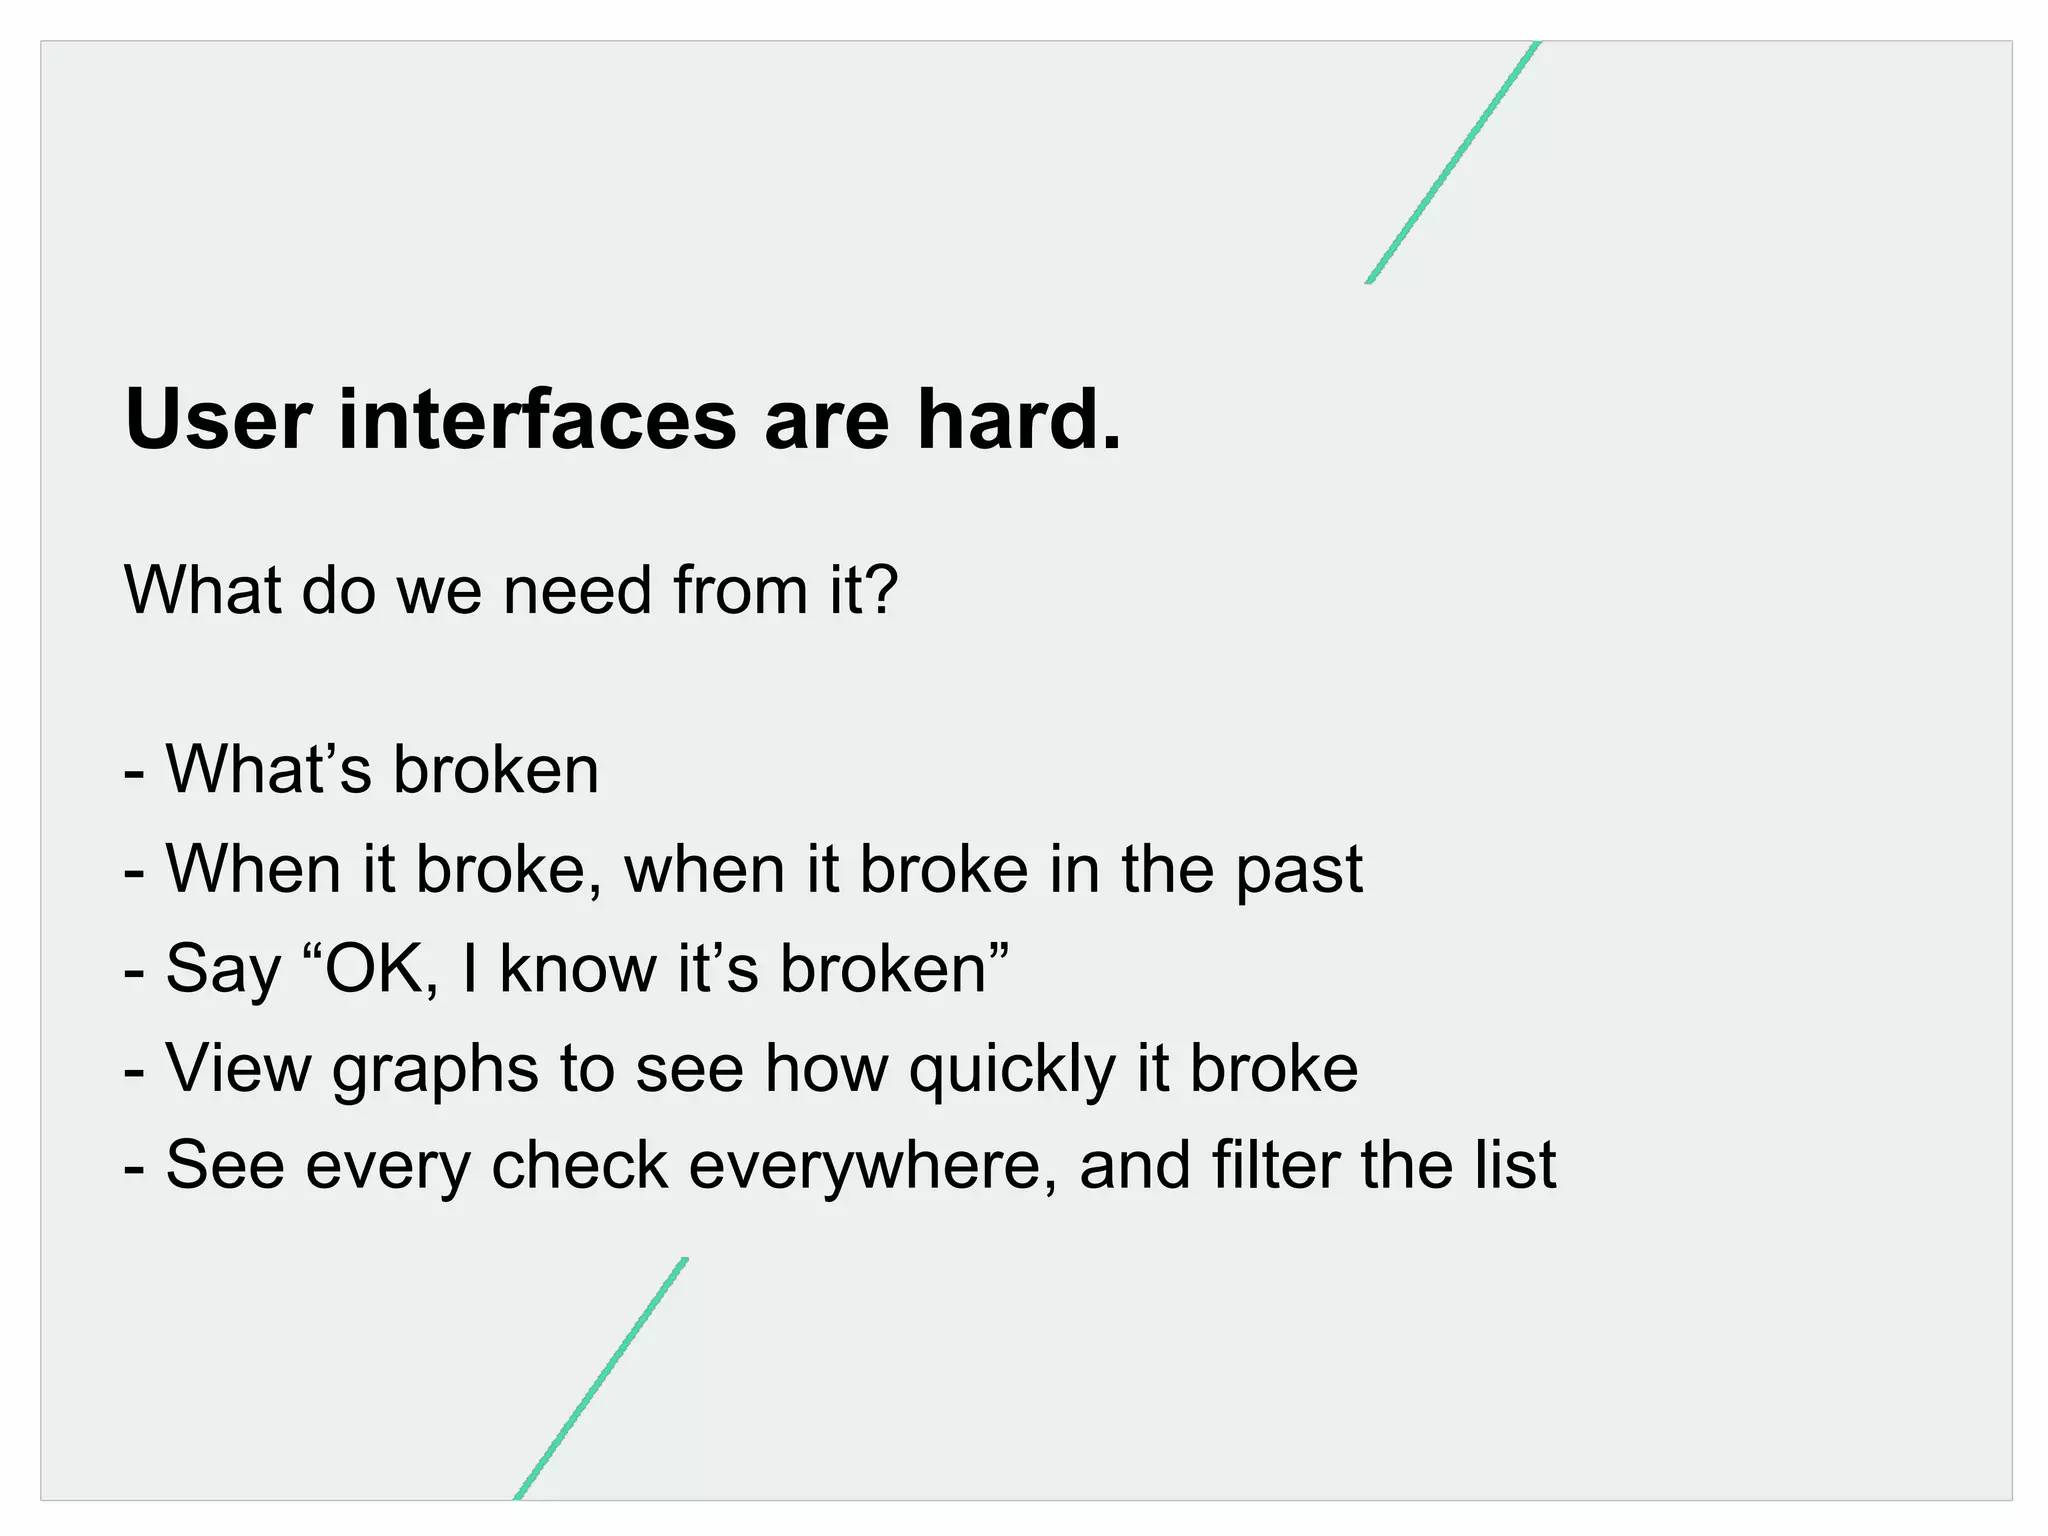
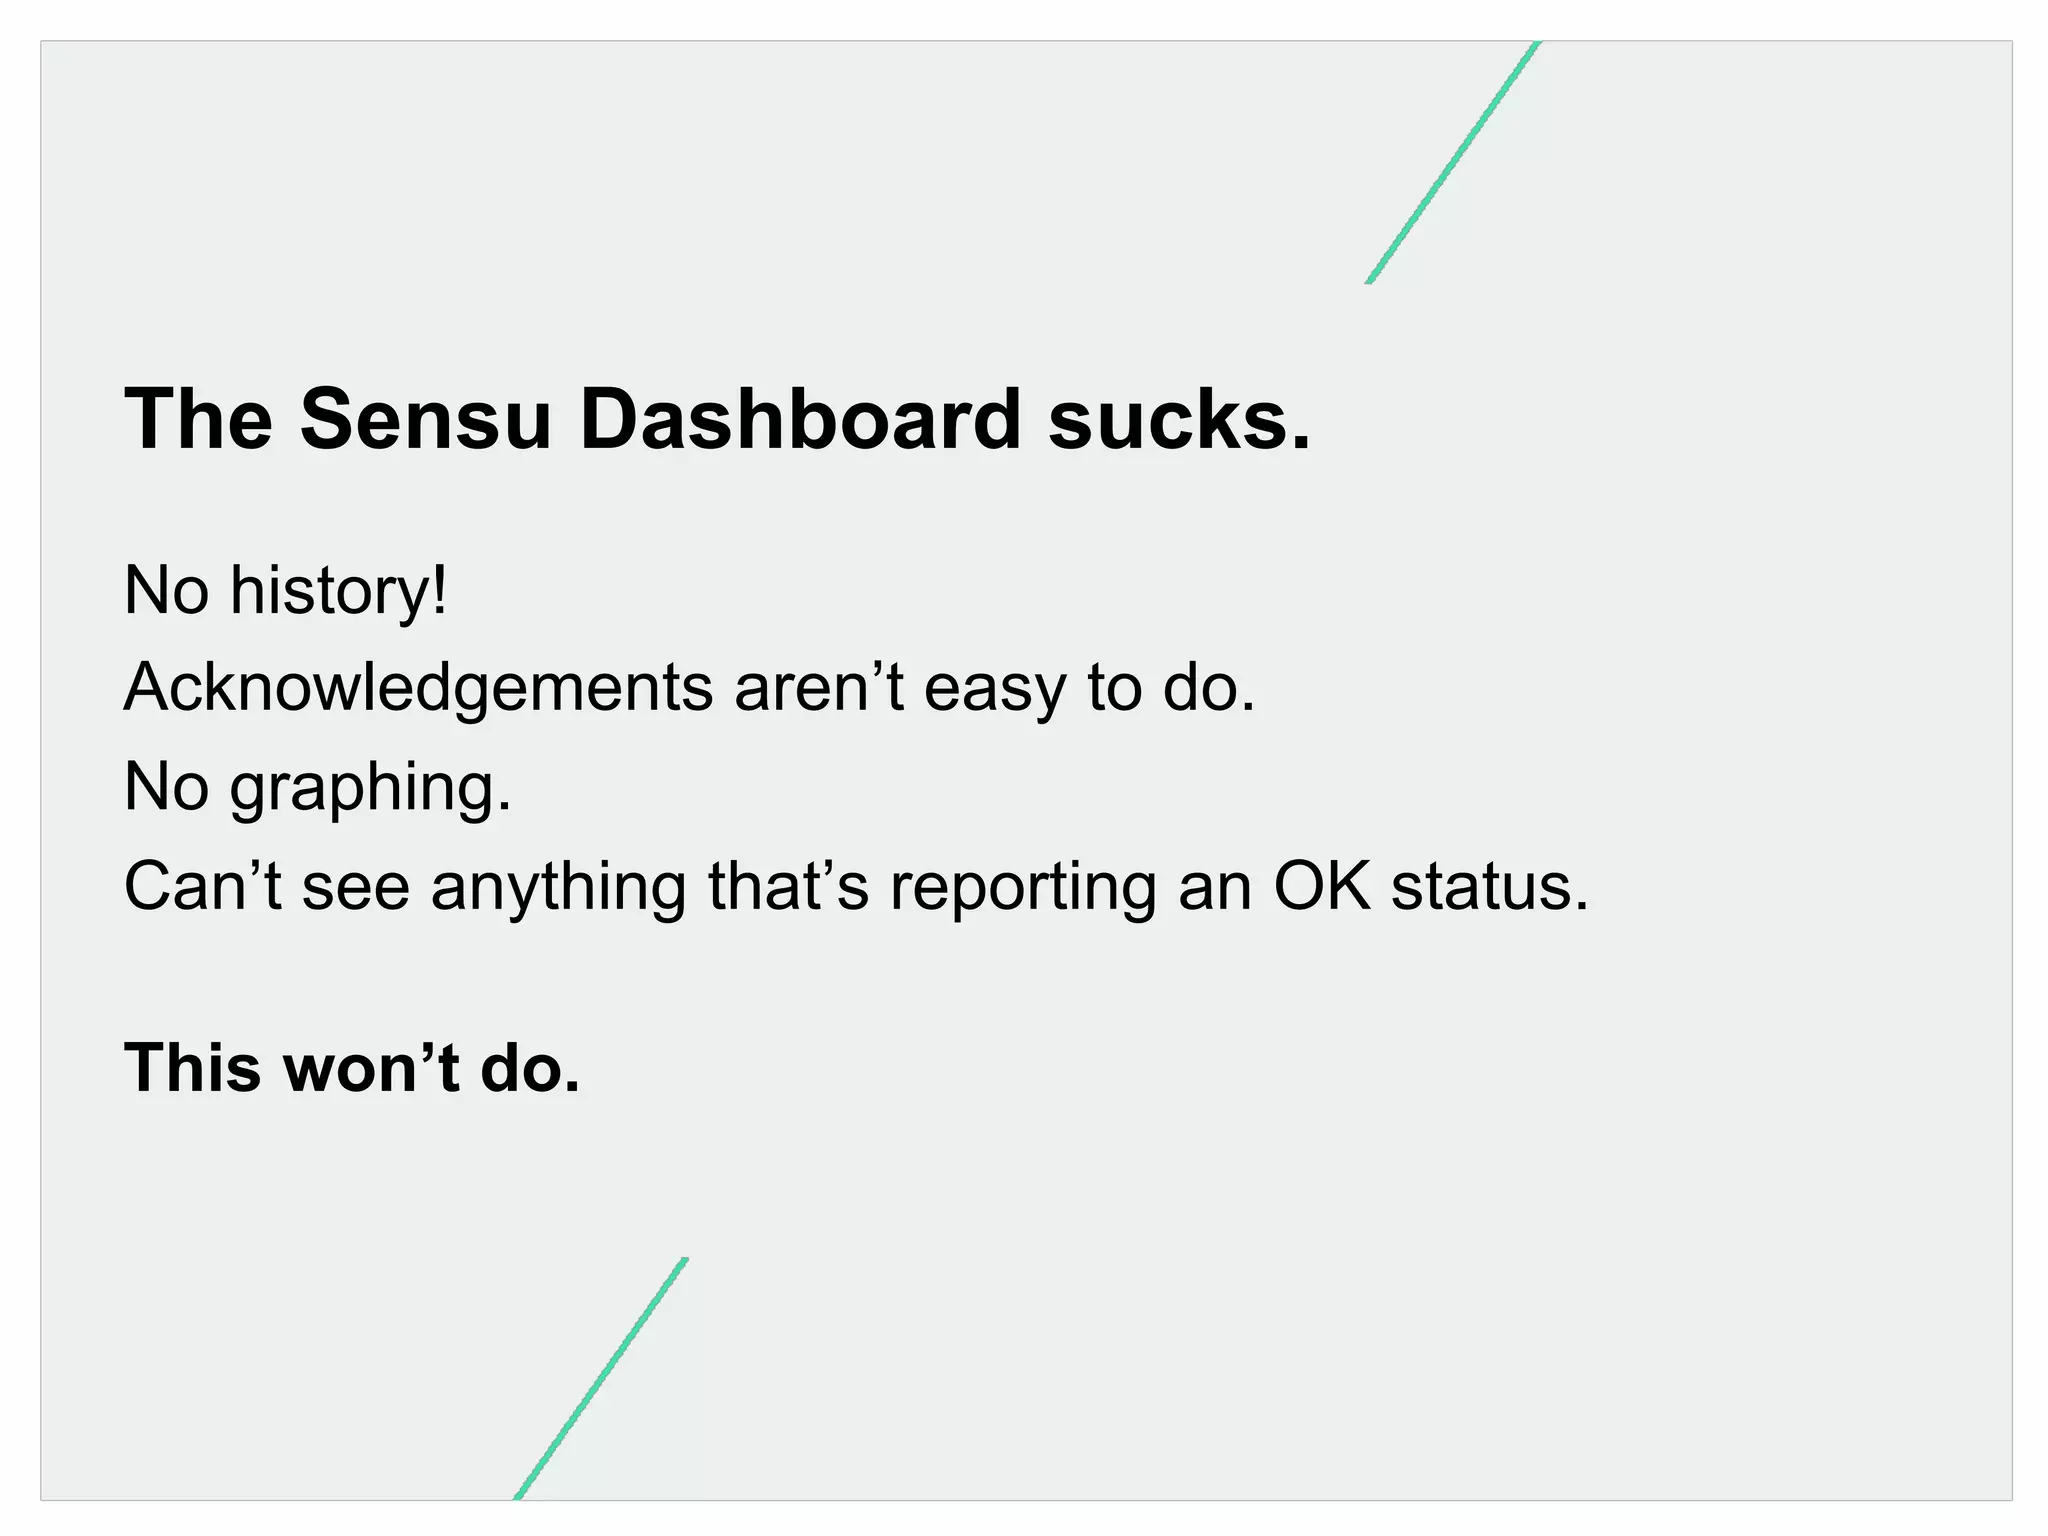
Identifies necessary UI functions for monitoring; critiques current Sensu Dashboard and proposes improvements.
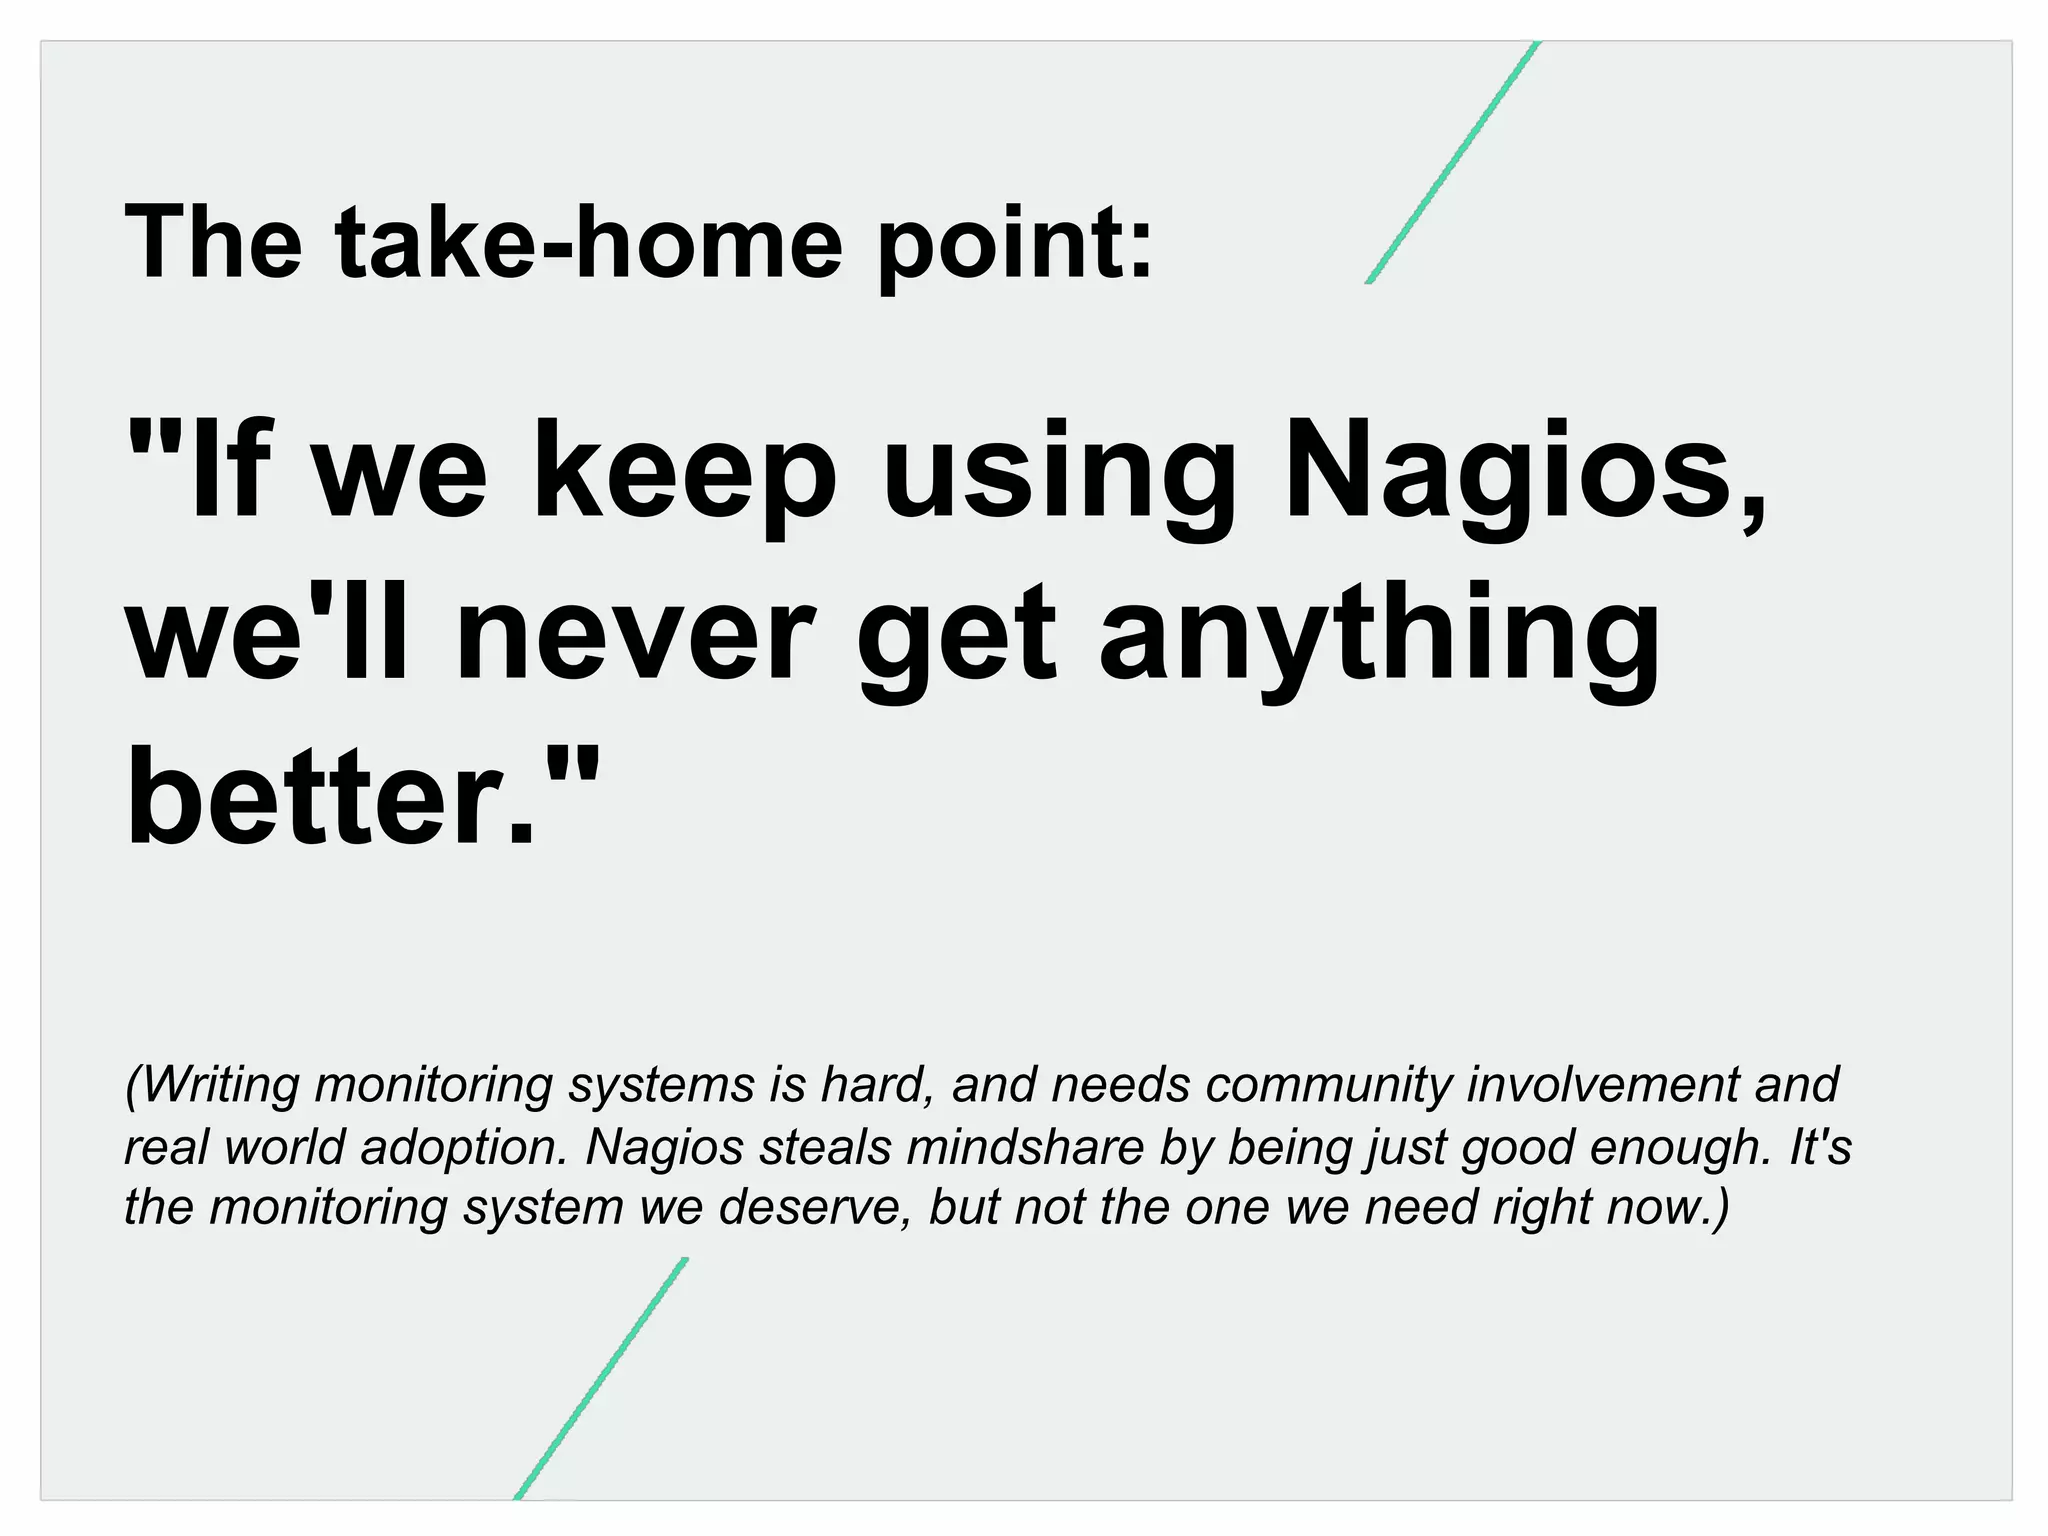
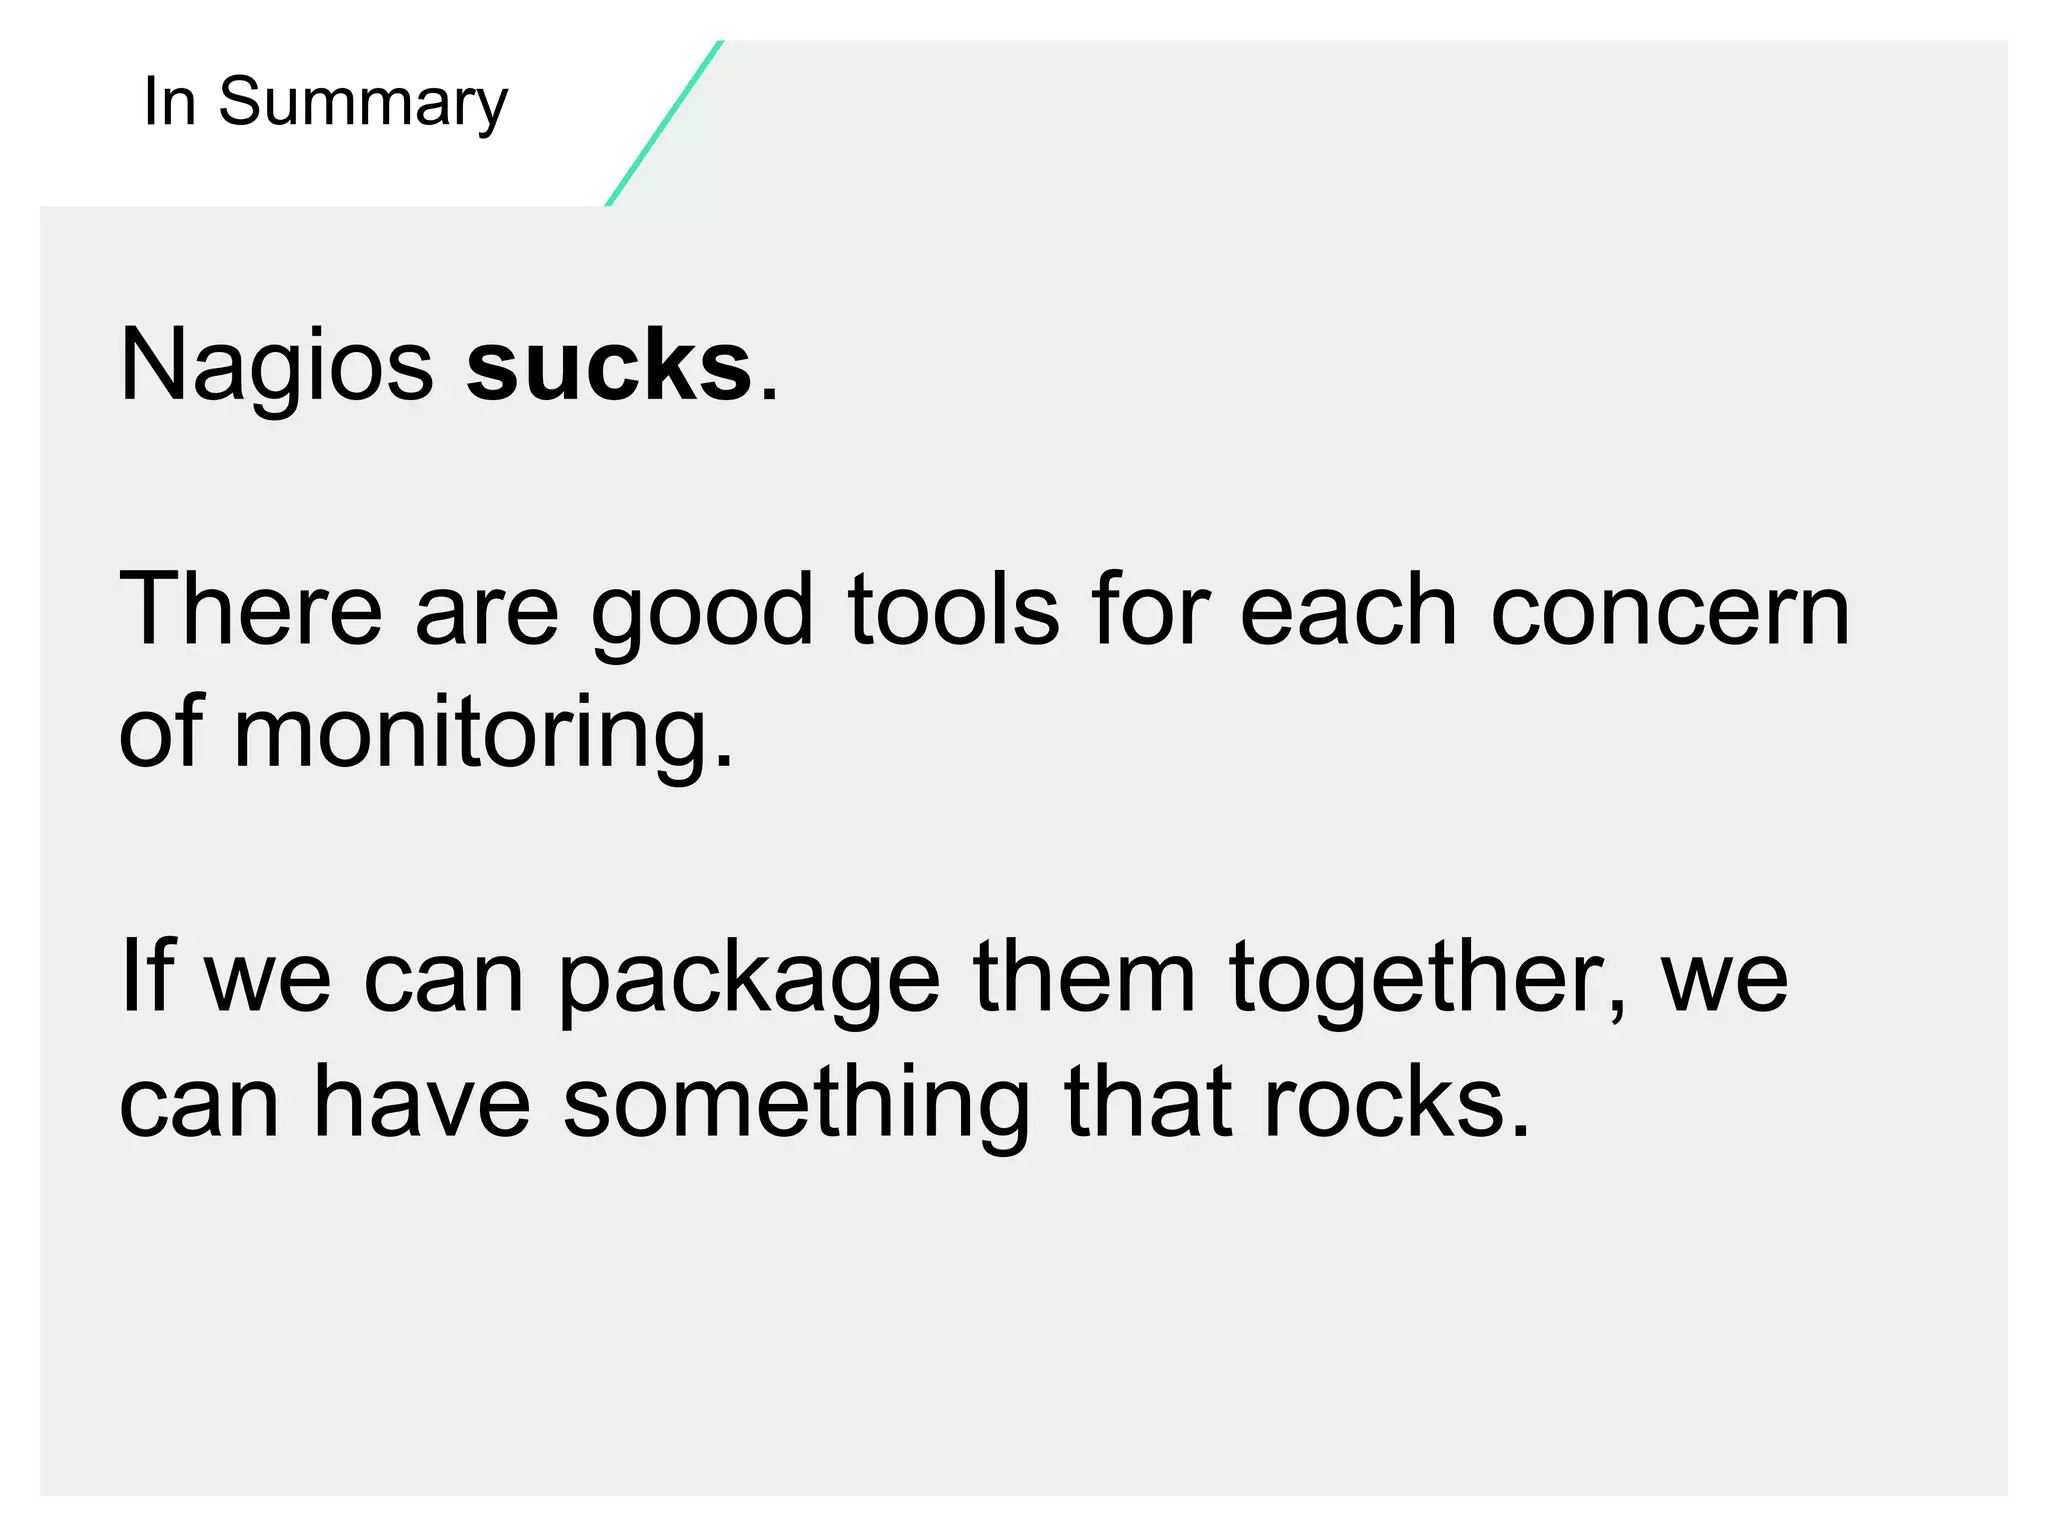
Final remarks indicating Nagios' inadequacy; emphasizes combining tools for a superior monitoring solution.


![Vibe Coding vs. Spec-Driven Development [Free Meetup]](https://cdn.slidesharecdn.com/ss_thumbnails/vibecodingvsspecdrivendevelopment-251209105622-43f455e7-thumbnail.jpg?width=640&height=640&fit=bounds)


