SlideShare a Scribd company logo
1 of 4
Download to read offline
Investment Report
Member : Demo
Financial Year : 2009 - 2010
Report Date : 04/Dec/2010

                                OPENING STOCK                  PURCHASE                        SALE               CLOSING STOCK                    VALUATION              Actual      Market
Scrip Name                      Qty    Rate     Amount      Qty     Rate    Amount     Qty     Rate    Amount      Qty          Rate    Amount       Rate    Amount        Gain         Gain
3I INFOTECH                       0       0             0      5    71.13     355.65     0        0          0        5     71.13         355.65     82.90     415.00         0        59.35
ACC LTD                          10   700.00    7000.00        0       0          0      0        0          0      10     700.00        7000.00    749.15    7506.50         0       506.50
ADLABS FILMS                      0       0             0      5 1108.81     5544.05     0        0          0        5 1108.81          5544.05    253.15    1265.75         0     (4278.30)
ALPS INDS.                        0       0             0    800    85.83   68666.00     0        0          0     800      85.83       68666.00     10.05    8040.00         0    (60626.00)
AMTEK INDIA                       0       0             0      0       0          0     125   163.81   20475.75   (125)            0         .00     48.73         0    20475.75           0
APOLLO TYRES                      0       0             0    100    52.63    5263.00    100    53.92    5392.00       0            0        0.00     48.00         0      129.00           0
ASHOK LEYL.                       0       0             0    302    40.39   12197.01     0        0          0     302      40.39       12197.01     45.58   13725.90         0      1528.89
ASSAM CO.LTD                      0       0             0      0       0          0     100    26.81    2681.00   (100)            0         .00     16.15         0     2681.00           0
BALARPUR IND                      0       0             0      0       0          0     25    136.09    3402.25    (25)            0         .00     22.20         0     3402.25           0
BANK MAHA                         0       0             0      0       0          0     100    81.72    8172.00   (100)            0         .00     43.00         0     8172.00           0
BHARAT FORGE                      0       0             0      5   274.81    1374.05     0        0          0        5    274.81        1374.05    250.10    1249.75         0      (124.30)
BHARTI ARTL                       0       0             0     40   893.25   35729.80    10    852.07    8520.70     30     901.93       27058.00    292.50    8764.50   (151.10)   (18293.50)
BHEL                              0       0             0     10 2503.81    25038.05     0        0          0      10 2503.81          25038.05   2217.45   22171.00         0     (2867.05)
CAIRN IND                         0       0             0      0       0          0     200   275.13   55025.00   (200)            0         .00    263.48         0    55025.00           0
CENTBOP                           0       0             0    100    68.98    6898.00    100    50.84    5084.00       0            0        0.00        0          0     5084.00           0
CENTRAL BK                        0       0             0    500   116.98   58489.00    200   120.35   24070.00    300     116.98       35093.40    133.18   39900.00     674.40     4806.60
DENA BANK                         0       0             0      5    84.58     422.90     5     89.22     446.10       0            0        0.00        0          0       23.20           0
DHANALAK.BNK                      0       0             0      0       0          0     50     78.25    3912.50    (50)            0         .00    137.20         0     3912.50           0
DISH TV                           0       0             0    100    30.15    3015.01    100    90.36    9036.00       0            0        0.00     30.45         0     6020.99           0
D-LINK INDIA                      0       0             0      0       0          0     25    107.74    2693.50    (25)            0         .00     41.80         0     2693.50           0
ESSEL PROP                        0       0             0    100    76.43    7643.00     0        0          0     100      76.43        7643.00     41.95    4195.00         0     (3448.00)
EVEREST KANT                      0       0             0      0       0          0     50    363.79   18189.35    (50)            0         .00    138.55         0    18189.35           0
FACOR ALLOYS                      0       0             0   1000    11.23   11230.00     0        0          0    1000          11.23   11230.00      4.65    4650.00         0     (6580.00)
FERRO ALLOYS                      0       0             0      0       0          0     300    46.77   14031.00   (300)            0         .00      9.14         0    14031.00           0
FIRSTSOURCE SOLUTIONS LIMITED     0       0             0     25    29.88     746.95    25     30.27     756.75       0            0        0.00        0          0        9.80           0
GAIL (I) LTD                      0       0             0      0       0          0     25    509.03   12725.65    (25)            0         .00    347.98         0    12725.65           0
GALLAN METAL                      0       0             0   2400    31.02   74451.50   2000    40.15   80300.00    400      31.05       12421.50     15.08    6000.00   18270.00    (6421.50)
GAMMON INDIA                      0       0             0     10   290.20    2902.00    10    293.79    2937.90       0            0        0.00    230.23         0       35.90           0


Generated from Invest Plus                     Page 1                                                             E. &. O. E.
Investment Report
Member : Demo
Financial Year : 2009 - 2010
Report Date : 04/Dec/2010

                               OPENING STOCK                 PURCHASE                       SALE               CLOSING STOCK                   VALUATION              Actual      Market
Scrip Name                     Qty   Rate     Amount      Qty     Rate    Amount     Qty    Rate    Amount      Qty          Rate   Amount       Rate    Amount        Gain         Gain
GMR INFRASTR                     0      0             0    102   224.26   22874.50     2   135.25     270.50    100     226.07      22607.00     61.53    6145.00       3.00   (16462.00)
GODFREY PH                       0      0             0     10 1523.59    15235.90     0       0          0      10 1523.59         15235.90   1754.38   17493.00         0      2257.10
GOLDIAM INT.                     0      0             0     10    40.10     401.01     0       0          0      10      40.10        401.01     36.53     365.00         0       (36.01)
GSPL (INDIA) LTD                 0      0             0      5    93.23     466.15     0       0          0        5     93.23        466.15        0          0          0            0
GTL INFRAST                      0      0             0      0       0          0     40    41.26    1650.50    (40)            0        .00        0          0     1650.50           0
GUJ PETRONET                     0      0             0    100    75.93    7593.00   100    82.27    8227.00       0            0       0.00     81.33         0      634.00           0
GUJ.IND.POW.                     0      0             0    100   101.20   10120.00     0       0          0     100     101.20      10120.00    108.50   10850.00         0       730.00
GUJ.SIDH.CEM                     0      0             0      0       0          0    100    42.30    4230.00   (100)            0        .00     14.43         0     4230.00           0
HDFC                             0      0             0     10 1378.00    13780.00    10 1401.00    14010.00       0            0       0.00   2657.58         0      230.00           0
HDFC BANK                       10 1336.80   13368.00        0       0          0      0       0          0      10 1336.80         13368.00   1621.00   16213.00         0      2845.00
HELIOS & MAT                     0      0             0     25   130.76    3269.00     0       0          0      25     130.76       3269.00     37.10     927.50         0     (2341.50)
HIMACHAL FUT                     0      0             0    500    18.98    9490.00   200    57.69   11538.00    300      18.98       5694.00     10.41    3123.00    7742.00    (2571.00)
HIND UNI LT                      0      0             0      0       0          0    150   230.10   34514.50   (150)            0        .00    283.23         0    34514.50           0
HIND.CONSTN.                     0      0             0     40    86.10    3444.00    25   113.20    2830.00     15      86.10       1291.50    125.60    1879.50     677.50      588.00
HIND.MOTORS                      0      0             0      0       0          0    100    50.80    5080.30   (100)            0        .00     20.00         0     5080.30           0
HIND.ORG.CHM                     0      0             0    100    66.66    6666.00     0       0          0     100      66.66       6666.00     35.45    3545.00         0     (3121.00)
HINDALCO                         0      0             0     50   169.88    8494.00    50   183.98    9199.00       0            0       0.00    121.90         0      705.00           0
HOUSING DEV                      0      0             0     45   588.23   26470.45    10   371.18    3711.80     35     642.41      22484.40    316.40   11077.50   (274.25)   (11406.90)
HYD.INDUS                        0      0             0     10   171.89    1718.90    40   205.55    8222.00    (30)            0        .00    406.78         0     6503.10           0
ICICI BANK                       0      0             0     81 1214.96    98411.69    25 1191.93    29798.30     56 1227.52         68740.94    790.20   44217.60     127.55   (24523.34)
IDBI LTD.                        0      0             0    100   120.34   12034.00     0       0          0     100     120.34      12034.00    113.80   11365.00         0      (669.00)
IFCI LTD                         0      0             0      0       0          0     35    52.06    1822.20    (35)            0        .00        0          0     1822.20           0
IKF TECHNO                       0      0             0   1000    17.92   17920.00     0       0          0    1000      17.92      17920.00      4.66    4660.00         0    (13260.00)
INDIAN HOTEL                     0      0             0      0       0          0     10    86.00     859.99    (10)            0        .00     73.60         0      859.99           0
INFOSYS TECH                     0      0             0     12 1847.72    22172.68     7 2063.15    14442.04       5 1593.07         7965.35   2205.80   11027.00     234.71     3061.65
INFRA DEVFIN                     0      0             0    105   122.84   12898.05     0       0          0     105     122.84      12898.05    147.43   15477.00         0      2578.95
ISPAT INDS.                      0      0             0      0       0          0    100    73.63    7363.00   (100)            0        .00     18.83         0     7363.00           0
ITC LTD.                         0      0             0    150   197.22   29583.00   100   210.52   21052.00     50     422.94      21147.00    254.98   12757.50   12616.00    (8389.50)


Generated from Invest Plus                   Page 2                                                            E. &. O. E.
Investment Report
Member : Demo
Financial Year : 2009 - 2010
Report Date : 04/Dec/2010

                               OPENING STOCK                PURCHASE                        SALE               CLOSING STOCK                   VALUATION              Actual      Market
Scrip Name                     Qty   Rate    Amount      Qty     Rate    Amount     Qty     Rate    Amount     Qty           Rate   Amount       Rate    Amount        Gain         Gain
IVR PRIME                        0      0            0     10   489.05    4890.50     0        0          0      10     489.05       4890.50    123.13    1230.50         0     (3660.00)
IVRCL INFRAS                     0      0            0     15   201.23    3018.45     0        0          0      15     201.23       3018.45    347.75    5219.25         0      2200.80
JAIPRA                           0      0            0     75   372.04   27902.75     0        0          0      75     372.04      27902.75    210.15   15761.25         0    (12141.50)
JAYSHREE TEA                     0      0            0      0       0          0     50    145.47    7273.50   (50)             0        .00    306.70         0     7273.50           0
LARSEN & TOU                     0      0            0      2 3544.39     7088.78     0        0          0        2 3544.39         7088.78   1567.58    3134.30         0     (3954.48)
LIQUID BENCHMARK ETS             0      0            0      0       0          0     12    999.99   11999.88   (12)             0        .00        0          0    11999.88           0
MAH.SEAMLESS                     0      0            0     25   403.81   10095.25     0        0          0      25     403.81      10095.25    327.80    8180.00         0     (1915.25)
MUNDRA PORT                      0      0            0      1   701.70     701.70    25 1116.33     27908.25   (24)             0        .00    500.35         0    27206.55           0
NAGREEKA EXP                     0      0            0     50   172.20    8610.00     0        0          0      50     172.20       8610.00     16.05     802.50         0     (7807.50)
NAHAR SPG.                       0      0            0    200   107.10   21419.00    100   103.27   10327.00   100      101.51      10151.00     57.55    5755.00   (941.00)    (4396.00)
NTPC LTD                         0      0            0     50   210.66   10533.00     0        0          0      50     210.66      10533.00    211.90   10570.00         0        37.00
OMAXE LTD                        0      0            0     20   116.38    2327.52     0        0          0      20     116.38       2327.52     97.95    1959.00         0      (368.52)
ONGC CORPN                       0      0            0     10   896.23    8962.30     0        0          0      10     896.23       8962.30   1132.25   11327.00         0      2364.70
ORIENT INFO.                     0      0            0     30     8.90     267.01     0        0          0      30          8.90     267.01        0          0          0            0
PAGE INDUSTR                     0      0            0      0       0          0     10    342.39    3423.90   (10)             0        .00    659.03         0     3423.90           0
PATEL ENGG.                      0      0            0     20   602.00   12040.00     0        0          0      20     602.00      12040.00    453.35    9066.00         0     (2974.00)
POCHIRAJU IN                     0      0            0   1000    33.78   33780.00   1000    35.03   35025.00       0            0       0.00     16.50         0     1245.00           0
POWER GRID                       0      0            0    100   111.68   11168.00     0        0          0    100      111.68      11168.00    104.30   10425.00         0      (743.00)
PRAJ IND.LTD                     0      0            0     50   227.08   11354.00     0        0          0      50     227.08      11354.00     83.88    4192.50         0     (7161.50)
PUNJ LLOYD                       0      0            0     45   554.41   24948.25     0        0          0      45     554.41      24948.25    202.18    9094.50         0    (15853.75)
RAJESH EXPO.                     0      0            0      5   890.99    4454.95     0        0          0        5    890.99       4454.95     76.65     383.25         0     (4071.70)
RAYMOND                          0      0            0    100   436.03   43603.00     0        0          0    100      436.03      43603.00    181.73   18175.00         0    (25428.00)
REL COM LTD                      0      0            0     15   387.51    5812.65     0        0          0      15     387.51       5812.65    175.90    2639.25         0     (3173.40)
REL PET                          0      0            0    100   183.03   18302.50     0        0          0    100      183.03      18302.50        0          0          0            0
REL.CAP.                         0      0            0     10 1836.22    18362.15     0        0          0      10 1836.22         18362.15    746.28    7456.50         0    (10905.65)
RELIANCE                         0      0            0     35 2348.41    82194.35    35 2396.84     83889.30       0            0       0.00   1931.20         0     1694.95           0
RELIANCE POWER                   0      0            0     15   155.68    2335.17     0        0          0      15     155.68       2335.17    138.50    2078.25         0      (256.92)
RELIGARE ENT                     0      0            0      0       0          0      5    709.99    3549.95    (5)             0        .00    365.65         0     3549.95           0


Generated from Invest Plus                  Page 3                                                             E. &. O. E.
Investment Report
Member : Demo
Financial Year : 2009 - 2010
Report Date : 04/Dec/2010

                               OPENING STOCK                  PURCHASE                          SALE                CLOSING STOCK                    VALUATION                Actual      Market
Scrip Name                     Qty   Rate     Amount       Qty     Rate      Amount     Qty     Rate     Amount      Qty          Rate    Amount       Rate     Amount         Gain         Gain
ROLTA (I)                        0      0             0      5    178.00       890.00     5    185.14      925.70       0            0        0.00        0           0        35.70           0
RUCHI SOYA                       0      0             0      0        0            0     300   116.55    34964.00   (300)            0         .00     79.90          0     34964.00           0
SIEMENS LTD.                     0      0             0      4    558.88      2235.52     2    511.49     1022.98       2    610.06        1220.11    514.83     1028.90        7.57     (191.21)
SRI DIGV CEM                     0      0             0    550     38.77     21325.01     0        0           0     550      38.77       21325.01     15.45     8497.50           0   (12827.51)
STATE BANK                       0      0             0     21 1611.13       33833.73    21 1659.51      34849.72       0            0        0.00   2191.03          0      1015.99           0
STEEL AUTH.                      0      0             0      0        0            0     50    152.43     7621.50    (50)            0         .00    164.53          0      7621.50           0
STERLITE IN                      0      0             0     19 1055.55       20055.44    31 1802.67      55882.77    (12) (953.29)        11439.50    771.05          0     47266.83           0
SUNFLAG IRON                     0      0             0    200     35.50      7100.00     0        0           0     200      35.50        7100.00     22.85     4570.00           0    (2530.00)
SURYACHAKRA                      0      0             0     50     18.05       902.50     0        0           0      50      18.05         902.50        0           0            0           0
SUZLONENERGY                     0      0             0      5     66.87       334.35     0        0           0        5     66.87         334.35        0           0            0           0
TATA STEEL                       0      0             0      11   715.20      7867.22     1    574.88      574.88     10     730.38        7303.80    471.58     4716.00       11.46    (2587.80)
TATA TEA                         0      0             0     30    694.83     20844.90    80    878.46    70277.00    (50)            0         .00    856.20          0     49432.10           0
TATA TELESER                     0      0             0      0        0            0     200    54.96    10992.00   (200)            0         .00     26.50          0     10992.00           0
TITAN IND.                       0      0             0      0        0            0      5 1493.67       7468.35     (5)            0         .00   1255.70          0      7468.35           0
UCOBANK                          0      0             0    200     70.99     14198.00     0        0           0     200      70.99       14198.00     50.58    10120.00           0    (4078.00)
ULTRATECH CM                     0      0             0      0        0            0      1    549.99      549.99     (1)            0         .00    768.35          0       549.99           0
UNITECH LTD                      0      0             0     15    103.74      1556.16     0        0           0      15     103.74        1556.16     82.25     1233.75           0     (322.41)
UNITED SPIRITS LTD               0      0             0      5 1268.82        6344.10    15 1358.32      20374.86    (10)            0         .00   1070.18          0     14030.76           0
VICEROY HOTE                     0      0             0      0        0            0     200   107.12    21424.00   (200)            0         .00     35.60          0     21424.00           0
VIJAYA BANK                      0      0             0    200     75.00     14999.00     0        0           0     200      75.00       14999.00     43.90     8770.00           0    (6229.00)
VISA STEEL                       0      0             0   1000     53.84     53840.00    500    53.82    26910.00    500      58.10       29050.00     36.23    18025.00     2120.00   (11025.00)
VISESH INFO.                     0      0             0     40     15.75       630.02     0        0           0      40      15.75         630.02      8.49      339.20           0     (290.82)
WELSP GUJ SR                     0      0             0      0        0            0     50    438.98    21948.75    (50)            0         .00    256.70          0     21948.75           0
WOCKHARDT                        0      0             0     50    343.63     17181.50     0        0           0      50     343.63       17181.50    170.90     8530.00           0    (8651.50)
ZEE NEWS                         0      0             0      0        0            0     250    77.60    19400.00   (250)            0         .00     51.73          0     19400.00           0
Total :                         20 1018.40   20368.00     12450    99.70   1241317.03   7602   128.29   975255.86   4868     170.38      829396.19             482285.40   549865.02 (315398.78)


Generated from Invest Plus                   Page 4                                                                 E. &. O. E.

More Related Content

What's hot

Go Ahead for F&O Report 12 October 2012-Mansukh Investment and Trading Solution
Go Ahead for F&O Report 12 October 2012-Mansukh Investment and Trading Solution Go Ahead for F&O Report 12 October 2012-Mansukh Investment and Trading Solution
Go Ahead for F&O Report 12 October 2012-Mansukh Investment and Trading Solution Mansukh Investment & Trading Solutions
 
Go Ahead for F&O Report 26 October 2012-Mansukh Investment and Trading Solution
Go Ahead for F&O Report 26 October 2012-Mansukh Investment and Trading Solution Go Ahead for F&O Report 26 October 2012-Mansukh Investment and Trading Solution
Go Ahead for F&O Report 26 October 2012-Mansukh Investment and Trading Solution Mansukh Investment & Trading Solutions
 
Go Ahead for F&O Report 08 November 2012-Mansukh Investment and Trading Solut...
Go Ahead for F&O Report 08 November 2012-Mansukh Investment and Trading Solut...Go Ahead for F&O Report 08 November 2012-Mansukh Investment and Trading Solut...
Go Ahead for F&O Report 08 November 2012-Mansukh Investment and Trading Solut...Mansukh Investment & Trading Solutions
 
Go Ahead for F&O Report 25 October 2012-Mansukh Investment and Trading Solution
Go Ahead for F&O Report 25 October 2012-Mansukh Investment and Trading Solution Go Ahead for F&O Report 25 October 2012-Mansukh Investment and Trading Solution
Go Ahead for F&O Report 25 October 2012-Mansukh Investment and Trading Solution Mansukh Investment & Trading Solutions
 
Go Ahead for F&O Report 21 September 2012-Mansukh Investment and Trading Solu...
Go Ahead for F&O Report 21 September 2012-Mansukh Investment and Trading Solu...Go Ahead for F&O Report 21 September 2012-Mansukh Investment and Trading Solu...
Go Ahead for F&O Report 21 September 2012-Mansukh Investment and Trading Solu...Mansukh Investment & Trading Solutions
 
Go Ahead for F&O Report 13 September 2012-Mansukh Investment and Trading Solu...
Go Ahead for F&O Report 13 September 2012-Mansukh Investment and Trading Solu...Go Ahead for F&O Report 13 September 2012-Mansukh Investment and Trading Solu...
Go Ahead for F&O Report 13 September 2012-Mansukh Investment and Trading Solu...Mansukh Investment & Trading Solutions
 
Go Ahead for F&O Report 11 October 2012-Mansukh Investment and Trading Solution
Go Ahead for F&O Report 11 October 2012-Mansukh Investment and Trading Solution Go Ahead for F&O Report 11 October 2012-Mansukh Investment and Trading Solution
Go Ahead for F&O Report 11 October 2012-Mansukh Investment and Trading Solution Mansukh Investment & Trading Solutions
 
Go Ahead for Future levels Report 16th August 2011-Mansukh Investment and Tra...
Go Ahead for Future levels Report 16th August 2011-Mansukh Investment and Tra...Go Ahead for Future levels Report 16th August 2011-Mansukh Investment and Tra...
Go Ahead for Future levels Report 16th August 2011-Mansukh Investment and Tra...Mansukh Investment & Trading Solutions
 
Go Ahead for F&O Report 09 October 2012-Mansukh Investment and Trading Solution
Go Ahead for F&O Report 09 October 2012-Mansukh Investment and Trading Solution Go Ahead for F&O Report 09 October 2012-Mansukh Investment and Trading Solution
Go Ahead for F&O Report 09 October 2012-Mansukh Investment and Trading Solution Mansukh Investment & Trading Solutions
 
Go Ahead for F&O Report 14 November 2011-Mansukh Investment and Trading Solution
Go Ahead for F&O Report 14 November 2011-Mansukh Investment and Trading SolutionGo Ahead for F&O Report 14 November 2011-Mansukh Investment and Trading Solution
Go Ahead for F&O Report 14 November 2011-Mansukh Investment and Trading SolutionMansukh Investment & Trading Solutions
 

What's hot (20)

Future levels Report 9th August-Mansukh Investment and Trading
Future levels Report 9th August-Mansukh Investment and TradingFuture levels Report 9th August-Mansukh Investment and Trading
Future levels Report 9th August-Mansukh Investment and Trading
 
Go Ahead for F&O Report 12 October 2012-Mansukh Investment and Trading Solution
Go Ahead for F&O Report 12 October 2012-Mansukh Investment and Trading Solution Go Ahead for F&O Report 12 October 2012-Mansukh Investment and Trading Solution
Go Ahead for F&O Report 12 October 2012-Mansukh Investment and Trading Solution
 
Go Ahead for F&O Report 28 May 2012-Mansukh Investment and Trading Solution
Go Ahead for F&O Report 28 May 2012-Mansukh Investment and Trading Solution Go Ahead for F&O Report 28 May 2012-Mansukh Investment and Trading Solution
Go Ahead for F&O Report 28 May 2012-Mansukh Investment and Trading Solution
 
Go-ahead for Future Trades -Insights for 23 June
Go-ahead for Future Trades -Insights for 23 JuneGo-ahead for Future Trades -Insights for 23 June
Go-ahead for Future Trades -Insights for 23 June
 
F&O Report 12th August -Mansukh Investment and Trading
F&O Report 12th August -Mansukh Investment and TradingF&O Report 12th August -Mansukh Investment and Trading
F&O Report 12th August -Mansukh Investment and Trading
 
Go-ahead for Future Trades -Insights for 24 DEC
Go-ahead for Future Trades -Insights for 24 DECGo-ahead for Future Trades -Insights for 24 DEC
Go-ahead for Future Trades -Insights for 24 DEC
 
Go Ahead for F&O Report 26 October 2012-Mansukh Investment and Trading Solution
Go Ahead for F&O Report 26 October 2012-Mansukh Investment and Trading Solution Go Ahead for F&O Report 26 October 2012-Mansukh Investment and Trading Solution
Go Ahead for F&O Report 26 October 2012-Mansukh Investment and Trading Solution
 
F&O Report 24 Febuary 2012-Mansukh Investment and Trading Solution
F&O Report 24 Febuary 2012-Mansukh Investment and Trading SolutionF&O Report 24 Febuary 2012-Mansukh Investment and Trading Solution
F&O Report 24 Febuary 2012-Mansukh Investment and Trading Solution
 
Go Ahead for F&O Report 08 November 2012-Mansukh Investment and Trading Solut...
Go Ahead for F&O Report 08 November 2012-Mansukh Investment and Trading Solut...Go Ahead for F&O Report 08 November 2012-Mansukh Investment and Trading Solut...
Go Ahead for F&O Report 08 November 2012-Mansukh Investment and Trading Solut...
 
Go Ahead for F&O Report 25 October 2012-Mansukh Investment and Trading Solution
Go Ahead for F&O Report 25 October 2012-Mansukh Investment and Trading Solution Go Ahead for F&O Report 25 October 2012-Mansukh Investment and Trading Solution
Go Ahead for F&O Report 25 October 2012-Mansukh Investment and Trading Solution
 
Go Ahead for F&O Report 21 September 2012-Mansukh Investment and Trading Solu...
Go Ahead for F&O Report 21 September 2012-Mansukh Investment and Trading Solu...Go Ahead for F&O Report 21 September 2012-Mansukh Investment and Trading Solu...
Go Ahead for F&O Report 21 September 2012-Mansukh Investment and Trading Solu...
 
Go Ahead for F&O Report 13 September 2012-Mansukh Investment and Trading Solu...
Go Ahead for F&O Report 13 September 2012-Mansukh Investment and Trading Solu...Go Ahead for F&O Report 13 September 2012-Mansukh Investment and Trading Solu...
Go Ahead for F&O Report 13 September 2012-Mansukh Investment and Trading Solu...
 
Go Ahead for F&O Report 11 October 2012-Mansukh Investment and Trading Solution
Go Ahead for F&O Report 11 October 2012-Mansukh Investment and Trading Solution Go Ahead for F&O Report 11 October 2012-Mansukh Investment and Trading Solution
Go Ahead for F&O Report 11 October 2012-Mansukh Investment and Trading Solution
 
Go Ahead for Future levels Report 16th August 2011-Mansukh Investment and Tra...
Go Ahead for Future levels Report 16th August 2011-Mansukh Investment and Tra...Go Ahead for Future levels Report 16th August 2011-Mansukh Investment and Tra...
Go Ahead for Future levels Report 16th August 2011-Mansukh Investment and Tra...
 
Go Ahead for F&O Report 09 October 2012-Mansukh Investment and Trading Solution
Go Ahead for F&O Report 09 October 2012-Mansukh Investment and Trading Solution Go Ahead for F&O Report 09 October 2012-Mansukh Investment and Trading Solution
Go Ahead for F&O Report 09 October 2012-Mansukh Investment and Trading Solution
 
Go-ahead for Future Trades -Insights for 23 DEC
Go-ahead for Future Trades -Insights for 23 DECGo-ahead for Future Trades -Insights for 23 DEC
Go-ahead for Future Trades -Insights for 23 DEC
 
Go-ahead for Future Trades -Insights for 22 DEC
Go-ahead for Future Trades -Insights for 22 DECGo-ahead for Future Trades -Insights for 22 DEC
Go-ahead for Future Trades -Insights for 22 DEC
 
Go Ahead for F&O Report 14 November 2011-Mansukh Investment and Trading Solution
Go Ahead for F&O Report 14 November 2011-Mansukh Investment and Trading SolutionGo Ahead for F&O Report 14 November 2011-Mansukh Investment and Trading Solution
Go Ahead for F&O Report 14 November 2011-Mansukh Investment and Trading Solution
 
A Look at Futures Trade for 24 Sep - by Mansukh
A Look at Futures Trade for 24 Sep - by MansukhA Look at Futures Trade for 24 Sep - by Mansukh
A Look at Futures Trade for 24 Sep - by Mansukh
 
Go Ahead for F&O Report 25 April 2012-Mansukh Investment and Trading Solution
Go Ahead for F&O Report 25 April 2012-Mansukh Investment and Trading SolutionGo Ahead for F&O Report 25 April 2012-Mansukh Investment and Trading Solution
Go Ahead for F&O Report 25 April 2012-Mansukh Investment and Trading Solution
 

Viewers also liked

Slide Show Dec 6 2008 Sibliography Final
Slide Show Dec 6 2008 Sibliography FinalSlide Show Dec 6 2008 Sibliography Final
Slide Show Dec 6 2008 Sibliography Finalduffy13
 
Crossing the chasm with a high performance dynamically scalable open source p...
Crossing the chasm with a high performance dynamically scalable open source p...Crossing the chasm with a high performance dynamically scalable open source p...
Crossing the chasm with a high performance dynamically scalable open source p...mark madsen
 
Crossroad wp4session samo sv3
Crossroad wp4session samo sv3Crossroad wp4session samo sv3
Crossroad wp4session samo sv3osimod
 
Osimo - presentation at Administracao 2.0 iGov event - Lisboa
Osimo - presentation at Administracao 2.0 iGov event - LisboaOsimo - presentation at Administracao 2.0 iGov event - Lisboa
Osimo - presentation at Administracao 2.0 iGov event - Lisboaosimod
 
Osimo eurocpr
Osimo eurocprOsimo eurocpr
Osimo eurocprosimod
 
Osimo crossover-consilium
Osimo crossover-consiliumOsimo crossover-consilium
Osimo crossover-consiliumosimod
 

Viewers also liked (6)

Slide Show Dec 6 2008 Sibliography Final
Slide Show Dec 6 2008 Sibliography FinalSlide Show Dec 6 2008 Sibliography Final
Slide Show Dec 6 2008 Sibliography Final
 
Crossing the chasm with a high performance dynamically scalable open source p...
Crossing the chasm with a high performance dynamically scalable open source p...Crossing the chasm with a high performance dynamically scalable open source p...
Crossing the chasm with a high performance dynamically scalable open source p...
 
Crossroad wp4session samo sv3
Crossroad wp4session samo sv3Crossroad wp4session samo sv3
Crossroad wp4session samo sv3
 
Osimo - presentation at Administracao 2.0 iGov event - Lisboa
Osimo - presentation at Administracao 2.0 iGov event - LisboaOsimo - presentation at Administracao 2.0 iGov event - Lisboa
Osimo - presentation at Administracao 2.0 iGov event - Lisboa
 
Osimo eurocpr
Osimo eurocprOsimo eurocpr
Osimo eurocpr
 
Osimo crossover-consilium
Osimo crossover-consiliumOsimo crossover-consilium
Osimo crossover-consilium
 

Similar to Investment report invest plus

Go Ahead for F&O Report 14 August 2012-Mansukh Investment and Trading Solution
Go Ahead for F&O Report 14 August 2012-Mansukh Investment and Trading Solution Go Ahead for F&O Report 14 August 2012-Mansukh Investment and Trading Solution
Go Ahead for F&O Report 14 August 2012-Mansukh Investment and Trading Solution Mansukh Investment & Trading Solutions
 
Go Ahead for F&O Report 13 August 2012-Mansukh Investment and Trading Solution
Go Ahead for F&O Report 13 August 2012-Mansukh Investment and Trading Solution Go Ahead for F&O Report 13 August 2012-Mansukh Investment and Trading Solution
Go Ahead for F&O Report 13 August 2012-Mansukh Investment and Trading Solution Mansukh Investment & Trading Solutions
 
Insights for trading Futures - 4th August- by Mansukh Investment and Trading ...
Insights for trading Futures - 4th August- by Mansukh Investment and Trading ...Insights for trading Futures - 4th August- by Mansukh Investment and Trading ...
Insights for trading Futures - 4th August- by Mansukh Investment and Trading ...Mansukh Investment & Trading Solutions
 
Go Ahead for F&O Report 03 August 2012-Mansukh Investment and Trading Solution
Go Ahead for F&O Report 03 August 2012-Mansukh Investment and Trading Solution Go Ahead for F&O Report 03 August 2012-Mansukh Investment and Trading Solution
Go Ahead for F&O Report 03 August 2012-Mansukh Investment and Trading Solution Mansukh Investment & Trading Solutions
 
Go Ahead for F&O Report 03 January 2013 Mansukh Investment and Trading Solution
Go Ahead for F&O Report 03 January 2013 Mansukh Investment and Trading Solution Go Ahead for F&O Report 03 January 2013 Mansukh Investment and Trading Solution
Go Ahead for F&O Report 03 January 2013 Mansukh Investment and Trading Solution Mansukh Investment & Trading Solutions
 
Go Ahead for F&O Report 15 October 2012-Mansukh Investment and Trading Solution
Go Ahead for F&O Report 15 October 2012-Mansukh Investment and Trading Solution Go Ahead for F&O Report 15 October 2012-Mansukh Investment and Trading Solution
Go Ahead for F&O Report 15 October 2012-Mansukh Investment and Trading Solution Mansukh Investment & Trading Solutions
 
Go Ahead for F&O Report 01 November 2012-Mansukh Investment and Trading Solut...
Go Ahead for F&O Report 01 November 2012-Mansukh Investment and Trading Solut...Go Ahead for F&O Report 01 November 2012-Mansukh Investment and Trading Solut...
Go Ahead for F&O Report 01 November 2012-Mansukh Investment and Trading Solut...Mansukh Investment & Trading Solutions
 
Go Ahead for F&O Report 26 November 2012-Mansukh Investment and Trading Solut...
Go Ahead for F&O Report 26 November 2012-Mansukh Investment and Trading Solut...Go Ahead for F&O Report 26 November 2012-Mansukh Investment and Trading Solut...
Go Ahead for F&O Report 26 November 2012-Mansukh Investment and Trading Solut...Mansukh Investment & Trading Solutions
 
Go Ahead for F&O Report 18 October 2012-Mansukh Investment and Trading Solution
Go Ahead for F&O Report 18 October 2012-Mansukh Investment and Trading Solution Go Ahead for F&O Report 18 October 2012-Mansukh Investment and Trading Solution
Go Ahead for F&O Report 18 October 2012-Mansukh Investment and Trading Solution Mansukh Investment & Trading Solutions
 
Go Ahead for F&O Report 23 November 2012-Mansukh Investment and Trading Solut...
Go Ahead for F&O Report 23 November 2012-Mansukh Investment and Trading Solut...Go Ahead for F&O Report 23 November 2012-Mansukh Investment and Trading Solut...
Go Ahead for F&O Report 23 November 2012-Mansukh Investment and Trading Solut...Mansukh Investment & Trading Solutions
 

Similar to Investment report invest plus (20)

Go Ahead for F&O Report 14 August 2012-Mansukh Investment and Trading Solution
Go Ahead for F&O Report 14 August 2012-Mansukh Investment and Trading Solution Go Ahead for F&O Report 14 August 2012-Mansukh Investment and Trading Solution
Go Ahead for F&O Report 14 August 2012-Mansukh Investment and Trading Solution
 
Go Ahead for F&O Report 13 August 2012-Mansukh Investment and Trading Solution
Go Ahead for F&O Report 13 August 2012-Mansukh Investment and Trading Solution Go Ahead for F&O Report 13 August 2012-Mansukh Investment and Trading Solution
Go Ahead for F&O Report 13 August 2012-Mansukh Investment and Trading Solution
 
Insights for trading Futures - 4th August- by Mansukh Investment and Trading ...
Insights for trading Futures - 4th August- by Mansukh Investment and Trading ...Insights for trading Futures - 4th August- by Mansukh Investment and Trading ...
Insights for trading Futures - 4th August- by Mansukh Investment and Trading ...
 
Future levels 30.10.12
Future levels 30.10.12Future levels 30.10.12
Future levels 30.10.12
 
Go-ahead for Future Trades -Insights for 31 DEC
Go-ahead for Future Trades -Insights for 31 DECGo-ahead for Future Trades -Insights for 31 DEC
Go-ahead for Future Trades -Insights for 31 DEC
 
F&O Report 27 Febuary 2012-Mansukh Investment and Trading Solution
F&O Report 27 Febuary 2012-Mansukh Investment and Trading SolutionF&O Report 27 Febuary 2012-Mansukh Investment and Trading Solution
F&O Report 27 Febuary 2012-Mansukh Investment and Trading Solution
 
Go Ahead for F&O Report 03 August 2012-Mansukh Investment and Trading Solution
Go Ahead for F&O Report 03 August 2012-Mansukh Investment and Trading Solution Go Ahead for F&O Report 03 August 2012-Mansukh Investment and Trading Solution
Go Ahead for F&O Report 03 August 2012-Mansukh Investment and Trading Solution
 
Go Ahead for F&O Report 03 January 2013 Mansukh Investment and Trading Solution
Go Ahead for F&O Report 03 January 2013 Mansukh Investment and Trading Solution Go Ahead for F&O Report 03 January 2013 Mansukh Investment and Trading Solution
Go Ahead for F&O Report 03 January 2013 Mansukh Investment and Trading Solution
 
Go Ahead for F&O Report 15 October 2012-Mansukh Investment and Trading Solution
Go Ahead for F&O Report 15 October 2012-Mansukh Investment and Trading Solution Go Ahead for F&O Report 15 October 2012-Mansukh Investment and Trading Solution
Go Ahead for F&O Report 15 October 2012-Mansukh Investment and Trading Solution
 
Go Ahead for F&O Report 01 November 2012-Mansukh Investment and Trading Solut...
Go Ahead for F&O Report 01 November 2012-Mansukh Investment and Trading Solut...Go Ahead for F&O Report 01 November 2012-Mansukh Investment and Trading Solut...
Go Ahead for F&O Report 01 November 2012-Mansukh Investment and Trading Solut...
 
Go Ahead for F&O Report 04 July 2012-Mansukh Investment and Trading Solution
Go Ahead for F&O Report 04 July 2012-Mansukh Investment and Trading Solution Go Ahead for F&O Report 04 July 2012-Mansukh Investment and Trading Solution
Go Ahead for F&O Report 04 July 2012-Mansukh Investment and Trading Solution
 
Go Ahead for F&O Report 26 November 2012-Mansukh Investment and Trading Solut...
Go Ahead for F&O Report 26 November 2012-Mansukh Investment and Trading Solut...Go Ahead for F&O Report 26 November 2012-Mansukh Investment and Trading Solut...
Go Ahead for F&O Report 26 November 2012-Mansukh Investment and Trading Solut...
 
F&O Report 23 January 2012-Mansukh Investment and Trading Solution
F&O Report 23 January 2012-Mansukh Investment and Trading SolutionF&O Report 23 January 2012-Mansukh Investment and Trading Solution
F&O Report 23 January 2012-Mansukh Investment and Trading Solution
 
Go Ahead for F&O Report 18 October 2012-Mansukh Investment and Trading Solution
Go Ahead for F&O Report 18 October 2012-Mansukh Investment and Trading Solution Go Ahead for F&O Report 18 October 2012-Mansukh Investment and Trading Solution
Go Ahead for F&O Report 18 October 2012-Mansukh Investment and Trading Solution
 
16 sep future
16 sep future16 sep future
16 sep future
 
Go Ahead for F&O Report 23 November 2012-Mansukh Investment and Trading Solut...
Go Ahead for F&O Report 23 November 2012-Mansukh Investment and Trading Solut...Go Ahead for F&O Report 23 November 2012-Mansukh Investment and Trading Solut...
Go Ahead for F&O Report 23 November 2012-Mansukh Investment and Trading Solut...
 
Go Ahead for F&O Report 21 March 2012-Mansukh Investment and Trading Solution
Go Ahead for F&O Report 21 March 2012-Mansukh Investment and Trading SolutionGo Ahead for F&O Report 21 March 2012-Mansukh Investment and Trading Solution
Go Ahead for F&O Report 21 March 2012-Mansukh Investment and Trading Solution
 
Future levels 09.08.11
Future levels 09.08.11Future levels 09.08.11
Future levels 09.08.11
 
F&O Report 28 Febuary 2012-Mansukh Investment and Trading Solution
F&O Report 28 Febuary 2012-Mansukh Investment and Trading SolutionF&O Report 28 Febuary 2012-Mansukh Investment and Trading Solution
F&O Report 28 Febuary 2012-Mansukh Investment and Trading Solution
 
Future levels 11th August 2011 -Mansukh Investment and Trading
Future levels 11th August 2011 -Mansukh Investment and Trading Future levels 11th August 2011 -Mansukh Investment and Trading
Future levels 11th August 2011 -Mansukh Investment and Trading
 

Recently uploaded

Measures of Dispersion and Variability: Range, QD, AD and SD
Measures of Dispersion and Variability: Range, QD, AD and SDMeasures of Dispersion and Variability: Range, QD, AD and SD
Measures of Dispersion and Variability: Range, QD, AD and SDThiyagu K
 
The basics of sentences session 2pptx copy.pptx
The basics of sentences session 2pptx copy.pptxThe basics of sentences session 2pptx copy.pptx
The basics of sentences session 2pptx copy.pptxheathfieldcps1
 
Beyond the EU: DORA and NIS 2 Directive's Global Impact
Beyond the EU: DORA and NIS 2 Directive's Global ImpactBeyond the EU: DORA and NIS 2 Directive's Global Impact
Beyond the EU: DORA and NIS 2 Directive's Global ImpactPECB
 
Food Chain and Food Web (Ecosystem) EVS, B. Pharmacy 1st Year, Sem-II
Food Chain and Food Web (Ecosystem) EVS, B. Pharmacy 1st Year, Sem-IIFood Chain and Food Web (Ecosystem) EVS, B. Pharmacy 1st Year, Sem-II
Food Chain and Food Web (Ecosystem) EVS, B. Pharmacy 1st Year, Sem-IIShubhangi Sonawane
 
PROCESS RECORDING FORMAT.docx
PROCESS      RECORDING        FORMAT.docxPROCESS      RECORDING        FORMAT.docx
PROCESS RECORDING FORMAT.docxPoojaSen20
 
Web & Social Media Analytics Previous Year Question Paper.pdf
Web & Social Media Analytics Previous Year Question Paper.pdfWeb & Social Media Analytics Previous Year Question Paper.pdf
Web & Social Media Analytics Previous Year Question Paper.pdfJayanti Pande
 
Measures of Central Tendency: Mean, Median and Mode
Measures of Central Tendency: Mean, Median and ModeMeasures of Central Tendency: Mean, Median and Mode
Measures of Central Tendency: Mean, Median and ModeThiyagu K
 
Z Score,T Score, Percential Rank and Box Plot Graph
Z Score,T Score, Percential Rank and Box Plot GraphZ Score,T Score, Percential Rank and Box Plot Graph
Z Score,T Score, Percential Rank and Box Plot GraphThiyagu K
 
Class 11th Physics NEET formula sheet pdf
Class 11th Physics NEET formula sheet pdfClass 11th Physics NEET formula sheet pdf
Class 11th Physics NEET formula sheet pdfAyushMahapatra5
 
Seal of Good Local Governance (SGLG) 2024Final.pptx
Seal of Good Local Governance (SGLG) 2024Final.pptxSeal of Good Local Governance (SGLG) 2024Final.pptx
Seal of Good Local Governance (SGLG) 2024Final.pptxnegromaestrong
 
ICT Role in 21st Century Education & its Challenges.pptx
ICT Role in 21st Century Education & its Challenges.pptxICT Role in 21st Century Education & its Challenges.pptx
ICT Role in 21st Century Education & its Challenges.pptxAreebaZafar22
 
On National Teacher Day, meet the 2024-25 Kenan Fellows
On National Teacher Day, meet the 2024-25 Kenan FellowsOn National Teacher Day, meet the 2024-25 Kenan Fellows
On National Teacher Day, meet the 2024-25 Kenan FellowsMebane Rash
 
Making and Justifying Mathematical Decisions.pdf
Making and Justifying Mathematical Decisions.pdfMaking and Justifying Mathematical Decisions.pdf
Making and Justifying Mathematical Decisions.pdfChris Hunter
 
Presentation by Andreas Schleicher Tackling the School Absenteeism Crisis 30 ...
Presentation by Andreas Schleicher Tackling the School Absenteeism Crisis 30 ...Presentation by Andreas Schleicher Tackling the School Absenteeism Crisis 30 ...
Presentation by Andreas Schleicher Tackling the School Absenteeism Crisis 30 ...EduSkills OECD
 
Explore beautiful and ugly buildings. Mathematics helps us create beautiful d...
Explore beautiful and ugly buildings. Mathematics helps us create beautiful d...Explore beautiful and ugly buildings. Mathematics helps us create beautiful d...
Explore beautiful and ugly buildings. Mathematics helps us create beautiful d...christianmathematics
 
The basics of sentences session 3pptx.pptx
The basics of sentences session 3pptx.pptxThe basics of sentences session 3pptx.pptx
The basics of sentences session 3pptx.pptxheathfieldcps1
 
Energy Resources. ( B. Pharmacy, 1st Year, Sem-II) Natural Resources
Energy Resources. ( B. Pharmacy, 1st Year, Sem-II) Natural ResourcesEnergy Resources. ( B. Pharmacy, 1st Year, Sem-II) Natural Resources
Energy Resources. ( B. Pharmacy, 1st Year, Sem-II) Natural ResourcesShubhangi Sonawane
 
1029 - Danh muc Sach Giao Khoa 10 . pdf
1029 -  Danh muc Sach Giao Khoa 10 . pdf1029 -  Danh muc Sach Giao Khoa 10 . pdf
1029 - Danh muc Sach Giao Khoa 10 . pdfQucHHunhnh
 
Key note speaker Neum_Admir Softic_ENG.pdf
Key note speaker Neum_Admir Softic_ENG.pdfKey note speaker Neum_Admir Softic_ENG.pdf
Key note speaker Neum_Admir Softic_ENG.pdfAdmir Softic
 

Recently uploaded (20)

Measures of Dispersion and Variability: Range, QD, AD and SD
Measures of Dispersion and Variability: Range, QD, AD and SDMeasures of Dispersion and Variability: Range, QD, AD and SD
Measures of Dispersion and Variability: Range, QD, AD and SD
 
The basics of sentences session 2pptx copy.pptx
The basics of sentences session 2pptx copy.pptxThe basics of sentences session 2pptx copy.pptx
The basics of sentences session 2pptx copy.pptx
 
Beyond the EU: DORA and NIS 2 Directive's Global Impact
Beyond the EU: DORA and NIS 2 Directive's Global ImpactBeyond the EU: DORA and NIS 2 Directive's Global Impact
Beyond the EU: DORA and NIS 2 Directive's Global Impact
 
Food Chain and Food Web (Ecosystem) EVS, B. Pharmacy 1st Year, Sem-II
Food Chain and Food Web (Ecosystem) EVS, B. Pharmacy 1st Year, Sem-IIFood Chain and Food Web (Ecosystem) EVS, B. Pharmacy 1st Year, Sem-II
Food Chain and Food Web (Ecosystem) EVS, B. Pharmacy 1st Year, Sem-II
 
PROCESS RECORDING FORMAT.docx
PROCESS      RECORDING        FORMAT.docxPROCESS      RECORDING        FORMAT.docx
PROCESS RECORDING FORMAT.docx
 
Web & Social Media Analytics Previous Year Question Paper.pdf
Web & Social Media Analytics Previous Year Question Paper.pdfWeb & Social Media Analytics Previous Year Question Paper.pdf
Web & Social Media Analytics Previous Year Question Paper.pdf
 
Measures of Central Tendency: Mean, Median and Mode
Measures of Central Tendency: Mean, Median and ModeMeasures of Central Tendency: Mean, Median and Mode
Measures of Central Tendency: Mean, Median and Mode
 
Asian American Pacific Islander Month DDSD 2024.pptx
Asian American Pacific Islander Month DDSD 2024.pptxAsian American Pacific Islander Month DDSD 2024.pptx
Asian American Pacific Islander Month DDSD 2024.pptx
 
Z Score,T Score, Percential Rank and Box Plot Graph
Z Score,T Score, Percential Rank and Box Plot GraphZ Score,T Score, Percential Rank and Box Plot Graph
Z Score,T Score, Percential Rank and Box Plot Graph
 
Class 11th Physics NEET formula sheet pdf
Class 11th Physics NEET formula sheet pdfClass 11th Physics NEET formula sheet pdf
Class 11th Physics NEET formula sheet pdf
 
Seal of Good Local Governance (SGLG) 2024Final.pptx
Seal of Good Local Governance (SGLG) 2024Final.pptxSeal of Good Local Governance (SGLG) 2024Final.pptx
Seal of Good Local Governance (SGLG) 2024Final.pptx
 
ICT Role in 21st Century Education & its Challenges.pptx
ICT Role in 21st Century Education & its Challenges.pptxICT Role in 21st Century Education & its Challenges.pptx
ICT Role in 21st Century Education & its Challenges.pptx
 
On National Teacher Day, meet the 2024-25 Kenan Fellows
On National Teacher Day, meet the 2024-25 Kenan FellowsOn National Teacher Day, meet the 2024-25 Kenan Fellows
On National Teacher Day, meet the 2024-25 Kenan Fellows
 
Making and Justifying Mathematical Decisions.pdf
Making and Justifying Mathematical Decisions.pdfMaking and Justifying Mathematical Decisions.pdf
Making and Justifying Mathematical Decisions.pdf
 
Presentation by Andreas Schleicher Tackling the School Absenteeism Crisis 30 ...
Presentation by Andreas Schleicher Tackling the School Absenteeism Crisis 30 ...Presentation by Andreas Schleicher Tackling the School Absenteeism Crisis 30 ...
Presentation by Andreas Schleicher Tackling the School Absenteeism Crisis 30 ...
 
Explore beautiful and ugly buildings. Mathematics helps us create beautiful d...
Explore beautiful and ugly buildings. Mathematics helps us create beautiful d...Explore beautiful and ugly buildings. Mathematics helps us create beautiful d...
Explore beautiful and ugly buildings. Mathematics helps us create beautiful d...
 
The basics of sentences session 3pptx.pptx
The basics of sentences session 3pptx.pptxThe basics of sentences session 3pptx.pptx
The basics of sentences session 3pptx.pptx
 
Energy Resources. ( B. Pharmacy, 1st Year, Sem-II) Natural Resources
Energy Resources. ( B. Pharmacy, 1st Year, Sem-II) Natural ResourcesEnergy Resources. ( B. Pharmacy, 1st Year, Sem-II) Natural Resources
Energy Resources. ( B. Pharmacy, 1st Year, Sem-II) Natural Resources
 
1029 - Danh muc Sach Giao Khoa 10 . pdf
1029 -  Danh muc Sach Giao Khoa 10 . pdf1029 -  Danh muc Sach Giao Khoa 10 . pdf
1029 - Danh muc Sach Giao Khoa 10 . pdf
 
Key note speaker Neum_Admir Softic_ENG.pdf
Key note speaker Neum_Admir Softic_ENG.pdfKey note speaker Neum_Admir Softic_ENG.pdf
Key note speaker Neum_Admir Softic_ENG.pdf
 

Investment report invest plus

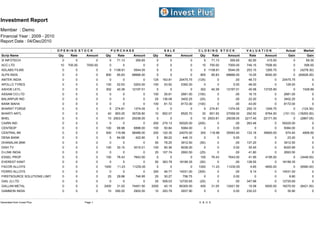
  • 1. Investment Report Member : Demo Financial Year : 2009 - 2010 Report Date : 04/Dec/2010 OPENING STOCK PURCHASE SALE CLOSING STOCK VALUATION Actual Market Scrip Name Qty Rate Amount Qty Rate Amount Qty Rate Amount Qty Rate Amount Rate Amount Gain Gain 3I INFOTECH 0 0 0 5 71.13 355.65 0 0 0 5 71.13 355.65 82.90 415.00 0 59.35 ACC LTD 10 700.00 7000.00 0 0 0 0 0 0 10 700.00 7000.00 749.15 7506.50 0 506.50 ADLABS FILMS 0 0 0 5 1108.81 5544.05 0 0 0 5 1108.81 5544.05 253.15 1265.75 0 (4278.30) ALPS INDS. 0 0 0 800 85.83 68666.00 0 0 0 800 85.83 68666.00 10.05 8040.00 0 (60626.00) AMTEK INDIA 0 0 0 0 0 0 125 163.81 20475.75 (125) 0 .00 48.73 0 20475.75 0 APOLLO TYRES 0 0 0 100 52.63 5263.00 100 53.92 5392.00 0 0 0.00 48.00 0 129.00 0 ASHOK LEYL. 0 0 0 302 40.39 12197.01 0 0 0 302 40.39 12197.01 45.58 13725.90 0 1528.89 ASSAM CO.LTD 0 0 0 0 0 0 100 26.81 2681.00 (100) 0 .00 16.15 0 2681.00 0 BALARPUR IND 0 0 0 0 0 0 25 136.09 3402.25 (25) 0 .00 22.20 0 3402.25 0 BANK MAHA 0 0 0 0 0 0 100 81.72 8172.00 (100) 0 .00 43.00 0 8172.00 0 BHARAT FORGE 0 0 0 5 274.81 1374.05 0 0 0 5 274.81 1374.05 250.10 1249.75 0 (124.30) BHARTI ARTL 0 0 0 40 893.25 35729.80 10 852.07 8520.70 30 901.93 27058.00 292.50 8764.50 (151.10) (18293.50) BHEL 0 0 0 10 2503.81 25038.05 0 0 0 10 2503.81 25038.05 2217.45 22171.00 0 (2867.05) CAIRN IND 0 0 0 0 0 0 200 275.13 55025.00 (200) 0 .00 263.48 0 55025.00 0 CENTBOP 0 0 0 100 68.98 6898.00 100 50.84 5084.00 0 0 0.00 0 0 5084.00 0 CENTRAL BK 0 0 0 500 116.98 58489.00 200 120.35 24070.00 300 116.98 35093.40 133.18 39900.00 674.40 4806.60 DENA BANK 0 0 0 5 84.58 422.90 5 89.22 446.10 0 0 0.00 0 0 23.20 0 DHANALAK.BNK 0 0 0 0 0 0 50 78.25 3912.50 (50) 0 .00 137.20 0 3912.50 0 DISH TV 0 0 0 100 30.15 3015.01 100 90.36 9036.00 0 0 0.00 30.45 0 6020.99 0 D-LINK INDIA 0 0 0 0 0 0 25 107.74 2693.50 (25) 0 .00 41.80 0 2693.50 0 ESSEL PROP 0 0 0 100 76.43 7643.00 0 0 0 100 76.43 7643.00 41.95 4195.00 0 (3448.00) EVEREST KANT 0 0 0 0 0 0 50 363.79 18189.35 (50) 0 .00 138.55 0 18189.35 0 FACOR ALLOYS 0 0 0 1000 11.23 11230.00 0 0 0 1000 11.23 11230.00 4.65 4650.00 0 (6580.00) FERRO ALLOYS 0 0 0 0 0 0 300 46.77 14031.00 (300) 0 .00 9.14 0 14031.00 0 FIRSTSOURCE SOLUTIONS LIMITED 0 0 0 25 29.88 746.95 25 30.27 756.75 0 0 0.00 0 0 9.80 0 GAIL (I) LTD 0 0 0 0 0 0 25 509.03 12725.65 (25) 0 .00 347.98 0 12725.65 0 GALLAN METAL 0 0 0 2400 31.02 74451.50 2000 40.15 80300.00 400 31.05 12421.50 15.08 6000.00 18270.00 (6421.50) GAMMON INDIA 0 0 0 10 290.20 2902.00 10 293.79 2937.90 0 0 0.00 230.23 0 35.90 0 Generated from Invest Plus Page 1 E. &. O. E.
  • 2. Investment Report Member : Demo Financial Year : 2009 - 2010 Report Date : 04/Dec/2010 OPENING STOCK PURCHASE SALE CLOSING STOCK VALUATION Actual Market Scrip Name Qty Rate Amount Qty Rate Amount Qty Rate Amount Qty Rate Amount Rate Amount Gain Gain GMR INFRASTR 0 0 0 102 224.26 22874.50 2 135.25 270.50 100 226.07 22607.00 61.53 6145.00 3.00 (16462.00) GODFREY PH 0 0 0 10 1523.59 15235.90 0 0 0 10 1523.59 15235.90 1754.38 17493.00 0 2257.10 GOLDIAM INT. 0 0 0 10 40.10 401.01 0 0 0 10 40.10 401.01 36.53 365.00 0 (36.01) GSPL (INDIA) LTD 0 0 0 5 93.23 466.15 0 0 0 5 93.23 466.15 0 0 0 0 GTL INFRAST 0 0 0 0 0 0 40 41.26 1650.50 (40) 0 .00 0 0 1650.50 0 GUJ PETRONET 0 0 0 100 75.93 7593.00 100 82.27 8227.00 0 0 0.00 81.33 0 634.00 0 GUJ.IND.POW. 0 0 0 100 101.20 10120.00 0 0 0 100 101.20 10120.00 108.50 10850.00 0 730.00 GUJ.SIDH.CEM 0 0 0 0 0 0 100 42.30 4230.00 (100) 0 .00 14.43 0 4230.00 0 HDFC 0 0 0 10 1378.00 13780.00 10 1401.00 14010.00 0 0 0.00 2657.58 0 230.00 0 HDFC BANK 10 1336.80 13368.00 0 0 0 0 0 0 10 1336.80 13368.00 1621.00 16213.00 0 2845.00 HELIOS & MAT 0 0 0 25 130.76 3269.00 0 0 0 25 130.76 3269.00 37.10 927.50 0 (2341.50) HIMACHAL FUT 0 0 0 500 18.98 9490.00 200 57.69 11538.00 300 18.98 5694.00 10.41 3123.00 7742.00 (2571.00) HIND UNI LT 0 0 0 0 0 0 150 230.10 34514.50 (150) 0 .00 283.23 0 34514.50 0 HIND.CONSTN. 0 0 0 40 86.10 3444.00 25 113.20 2830.00 15 86.10 1291.50 125.60 1879.50 677.50 588.00 HIND.MOTORS 0 0 0 0 0 0 100 50.80 5080.30 (100) 0 .00 20.00 0 5080.30 0 HIND.ORG.CHM 0 0 0 100 66.66 6666.00 0 0 0 100 66.66 6666.00 35.45 3545.00 0 (3121.00) HINDALCO 0 0 0 50 169.88 8494.00 50 183.98 9199.00 0 0 0.00 121.90 0 705.00 0 HOUSING DEV 0 0 0 45 588.23 26470.45 10 371.18 3711.80 35 642.41 22484.40 316.40 11077.50 (274.25) (11406.90) HYD.INDUS 0 0 0 10 171.89 1718.90 40 205.55 8222.00 (30) 0 .00 406.78 0 6503.10 0 ICICI BANK 0 0 0 81 1214.96 98411.69 25 1191.93 29798.30 56 1227.52 68740.94 790.20 44217.60 127.55 (24523.34) IDBI LTD. 0 0 0 100 120.34 12034.00 0 0 0 100 120.34 12034.00 113.80 11365.00 0 (669.00) IFCI LTD 0 0 0 0 0 0 35 52.06 1822.20 (35) 0 .00 0 0 1822.20 0 IKF TECHNO 0 0 0 1000 17.92 17920.00 0 0 0 1000 17.92 17920.00 4.66 4660.00 0 (13260.00) INDIAN HOTEL 0 0 0 0 0 0 10 86.00 859.99 (10) 0 .00 73.60 0 859.99 0 INFOSYS TECH 0 0 0 12 1847.72 22172.68 7 2063.15 14442.04 5 1593.07 7965.35 2205.80 11027.00 234.71 3061.65 INFRA DEVFIN 0 0 0 105 122.84 12898.05 0 0 0 105 122.84 12898.05 147.43 15477.00 0 2578.95 ISPAT INDS. 0 0 0 0 0 0 100 73.63 7363.00 (100) 0 .00 18.83 0 7363.00 0 ITC LTD. 0 0 0 150 197.22 29583.00 100 210.52 21052.00 50 422.94 21147.00 254.98 12757.50 12616.00 (8389.50) Generated from Invest Plus Page 2 E. &. O. E.
  • 3. Investment Report Member : Demo Financial Year : 2009 - 2010 Report Date : 04/Dec/2010 OPENING STOCK PURCHASE SALE CLOSING STOCK VALUATION Actual Market Scrip Name Qty Rate Amount Qty Rate Amount Qty Rate Amount Qty Rate Amount Rate Amount Gain Gain IVR PRIME 0 0 0 10 489.05 4890.50 0 0 0 10 489.05 4890.50 123.13 1230.50 0 (3660.00) IVRCL INFRAS 0 0 0 15 201.23 3018.45 0 0 0 15 201.23 3018.45 347.75 5219.25 0 2200.80 JAIPRA 0 0 0 75 372.04 27902.75 0 0 0 75 372.04 27902.75 210.15 15761.25 0 (12141.50) JAYSHREE TEA 0 0 0 0 0 0 50 145.47 7273.50 (50) 0 .00 306.70 0 7273.50 0 LARSEN & TOU 0 0 0 2 3544.39 7088.78 0 0 0 2 3544.39 7088.78 1567.58 3134.30 0 (3954.48) LIQUID BENCHMARK ETS 0 0 0 0 0 0 12 999.99 11999.88 (12) 0 .00 0 0 11999.88 0 MAH.SEAMLESS 0 0 0 25 403.81 10095.25 0 0 0 25 403.81 10095.25 327.80 8180.00 0 (1915.25) MUNDRA PORT 0 0 0 1 701.70 701.70 25 1116.33 27908.25 (24) 0 .00 500.35 0 27206.55 0 NAGREEKA EXP 0 0 0 50 172.20 8610.00 0 0 0 50 172.20 8610.00 16.05 802.50 0 (7807.50) NAHAR SPG. 0 0 0 200 107.10 21419.00 100 103.27 10327.00 100 101.51 10151.00 57.55 5755.00 (941.00) (4396.00) NTPC LTD 0 0 0 50 210.66 10533.00 0 0 0 50 210.66 10533.00 211.90 10570.00 0 37.00 OMAXE LTD 0 0 0 20 116.38 2327.52 0 0 0 20 116.38 2327.52 97.95 1959.00 0 (368.52) ONGC CORPN 0 0 0 10 896.23 8962.30 0 0 0 10 896.23 8962.30 1132.25 11327.00 0 2364.70 ORIENT INFO. 0 0 0 30 8.90 267.01 0 0 0 30 8.90 267.01 0 0 0 0 PAGE INDUSTR 0 0 0 0 0 0 10 342.39 3423.90 (10) 0 .00 659.03 0 3423.90 0 PATEL ENGG. 0 0 0 20 602.00 12040.00 0 0 0 20 602.00 12040.00 453.35 9066.00 0 (2974.00) POCHIRAJU IN 0 0 0 1000 33.78 33780.00 1000 35.03 35025.00 0 0 0.00 16.50 0 1245.00 0 POWER GRID 0 0 0 100 111.68 11168.00 0 0 0 100 111.68 11168.00 104.30 10425.00 0 (743.00) PRAJ IND.LTD 0 0 0 50 227.08 11354.00 0 0 0 50 227.08 11354.00 83.88 4192.50 0 (7161.50) PUNJ LLOYD 0 0 0 45 554.41 24948.25 0 0 0 45 554.41 24948.25 202.18 9094.50 0 (15853.75) RAJESH EXPO. 0 0 0 5 890.99 4454.95 0 0 0 5 890.99 4454.95 76.65 383.25 0 (4071.70) RAYMOND 0 0 0 100 436.03 43603.00 0 0 0 100 436.03 43603.00 181.73 18175.00 0 (25428.00) REL COM LTD 0 0 0 15 387.51 5812.65 0 0 0 15 387.51 5812.65 175.90 2639.25 0 (3173.40) REL PET 0 0 0 100 183.03 18302.50 0 0 0 100 183.03 18302.50 0 0 0 0 REL.CAP. 0 0 0 10 1836.22 18362.15 0 0 0 10 1836.22 18362.15 746.28 7456.50 0 (10905.65) RELIANCE 0 0 0 35 2348.41 82194.35 35 2396.84 83889.30 0 0 0.00 1931.20 0 1694.95 0 RELIANCE POWER 0 0 0 15 155.68 2335.17 0 0 0 15 155.68 2335.17 138.50 2078.25 0 (256.92) RELIGARE ENT 0 0 0 0 0 0 5 709.99 3549.95 (5) 0 .00 365.65 0 3549.95 0 Generated from Invest Plus Page 3 E. &. O. E.
  • 4. Investment Report Member : Demo Financial Year : 2009 - 2010 Report Date : 04/Dec/2010 OPENING STOCK PURCHASE SALE CLOSING STOCK VALUATION Actual Market Scrip Name Qty Rate Amount Qty Rate Amount Qty Rate Amount Qty Rate Amount Rate Amount Gain Gain ROLTA (I) 0 0 0 5 178.00 890.00 5 185.14 925.70 0 0 0.00 0 0 35.70 0 RUCHI SOYA 0 0 0 0 0 0 300 116.55 34964.00 (300) 0 .00 79.90 0 34964.00 0 SIEMENS LTD. 0 0 0 4 558.88 2235.52 2 511.49 1022.98 2 610.06 1220.11 514.83 1028.90 7.57 (191.21) SRI DIGV CEM 0 0 0 550 38.77 21325.01 0 0 0 550 38.77 21325.01 15.45 8497.50 0 (12827.51) STATE BANK 0 0 0 21 1611.13 33833.73 21 1659.51 34849.72 0 0 0.00 2191.03 0 1015.99 0 STEEL AUTH. 0 0 0 0 0 0 50 152.43 7621.50 (50) 0 .00 164.53 0 7621.50 0 STERLITE IN 0 0 0 19 1055.55 20055.44 31 1802.67 55882.77 (12) (953.29) 11439.50 771.05 0 47266.83 0 SUNFLAG IRON 0 0 0 200 35.50 7100.00 0 0 0 200 35.50 7100.00 22.85 4570.00 0 (2530.00) SURYACHAKRA 0 0 0 50 18.05 902.50 0 0 0 50 18.05 902.50 0 0 0 0 SUZLONENERGY 0 0 0 5 66.87 334.35 0 0 0 5 66.87 334.35 0 0 0 0 TATA STEEL 0 0 0 11 715.20 7867.22 1 574.88 574.88 10 730.38 7303.80 471.58 4716.00 11.46 (2587.80) TATA TEA 0 0 0 30 694.83 20844.90 80 878.46 70277.00 (50) 0 .00 856.20 0 49432.10 0 TATA TELESER 0 0 0 0 0 0 200 54.96 10992.00 (200) 0 .00 26.50 0 10992.00 0 TITAN IND. 0 0 0 0 0 0 5 1493.67 7468.35 (5) 0 .00 1255.70 0 7468.35 0 UCOBANK 0 0 0 200 70.99 14198.00 0 0 0 200 70.99 14198.00 50.58 10120.00 0 (4078.00) ULTRATECH CM 0 0 0 0 0 0 1 549.99 549.99 (1) 0 .00 768.35 0 549.99 0 UNITECH LTD 0 0 0 15 103.74 1556.16 0 0 0 15 103.74 1556.16 82.25 1233.75 0 (322.41) UNITED SPIRITS LTD 0 0 0 5 1268.82 6344.10 15 1358.32 20374.86 (10) 0 .00 1070.18 0 14030.76 0 VICEROY HOTE 0 0 0 0 0 0 200 107.12 21424.00 (200) 0 .00 35.60 0 21424.00 0 VIJAYA BANK 0 0 0 200 75.00 14999.00 0 0 0 200 75.00 14999.00 43.90 8770.00 0 (6229.00) VISA STEEL 0 0 0 1000 53.84 53840.00 500 53.82 26910.00 500 58.10 29050.00 36.23 18025.00 2120.00 (11025.00) VISESH INFO. 0 0 0 40 15.75 630.02 0 0 0 40 15.75 630.02 8.49 339.20 0 (290.82) WELSP GUJ SR 0 0 0 0 0 0 50 438.98 21948.75 (50) 0 .00 256.70 0 21948.75 0 WOCKHARDT 0 0 0 50 343.63 17181.50 0 0 0 50 343.63 17181.50 170.90 8530.00 0 (8651.50) ZEE NEWS 0 0 0 0 0 0 250 77.60 19400.00 (250) 0 .00 51.73 0 19400.00 0 Total : 20 1018.40 20368.00 12450 99.70 1241317.03 7602 128.29 975255.86 4868 170.38 829396.19 482285.40 549865.02 (315398.78) Generated from Invest Plus Page 4 E. &. O. E.