Download to read offline
![Submitted to the Astrophysical Journal Letters
Preprint typeset using L TEX style emulateapj v. 8/13/10
A
CLASH: NEW MULTIPLE-IMAGES CONSTRAINING THE INNER MASS PROFILE OF MACS J1206.2-0847
A. Zitrin1 , P. Rosati2 , M. Nonino3 , C. Grillo4 , M. Postman5 , D. Coe5 , S. Seitz6 , T. Eichner6 , T. Broadhurst7,8 ,
S. Jouvel9 , I. Balestra10 , A. Mercurio11 , M. Scodeggio 12 , N. Ben´ ıtez13 , L. Bradley5 , H. Ford14 , O. Host9 , Y.
Jimenez-Teja13 , A. Koekemoer5 , W. Zheng14 , M. Bartelmann15 , R. Bouwens16 , O. Czoske17 , M. Donahue18 , O.
Graur1 , G. Graves19 , L. Infante20 , S. Jha21 , D. Kelson22 , O. Lahav9 , R. Lazkoz7 , D. Lemze14 , M. Lombardi23 , D.
Maoz1 , C. McCully21 , E. Medezinski14 , P. Melchior24 , M. Meneghetti25 , J. Merten15 , A. Molino13 , L.A.
Moustakas26 , S. Ogaz5 , B. Patel21 , E. Regoes27 , A. Riess5,14 , S. Rodney14 , K. Umetsu28 , and A. Van der Wel29
Submitted to the Astrophysical Journal Letters
ABSTRACT
arXiv:1107.2649v2 [astro-ph.CO] 17 Jul 2011
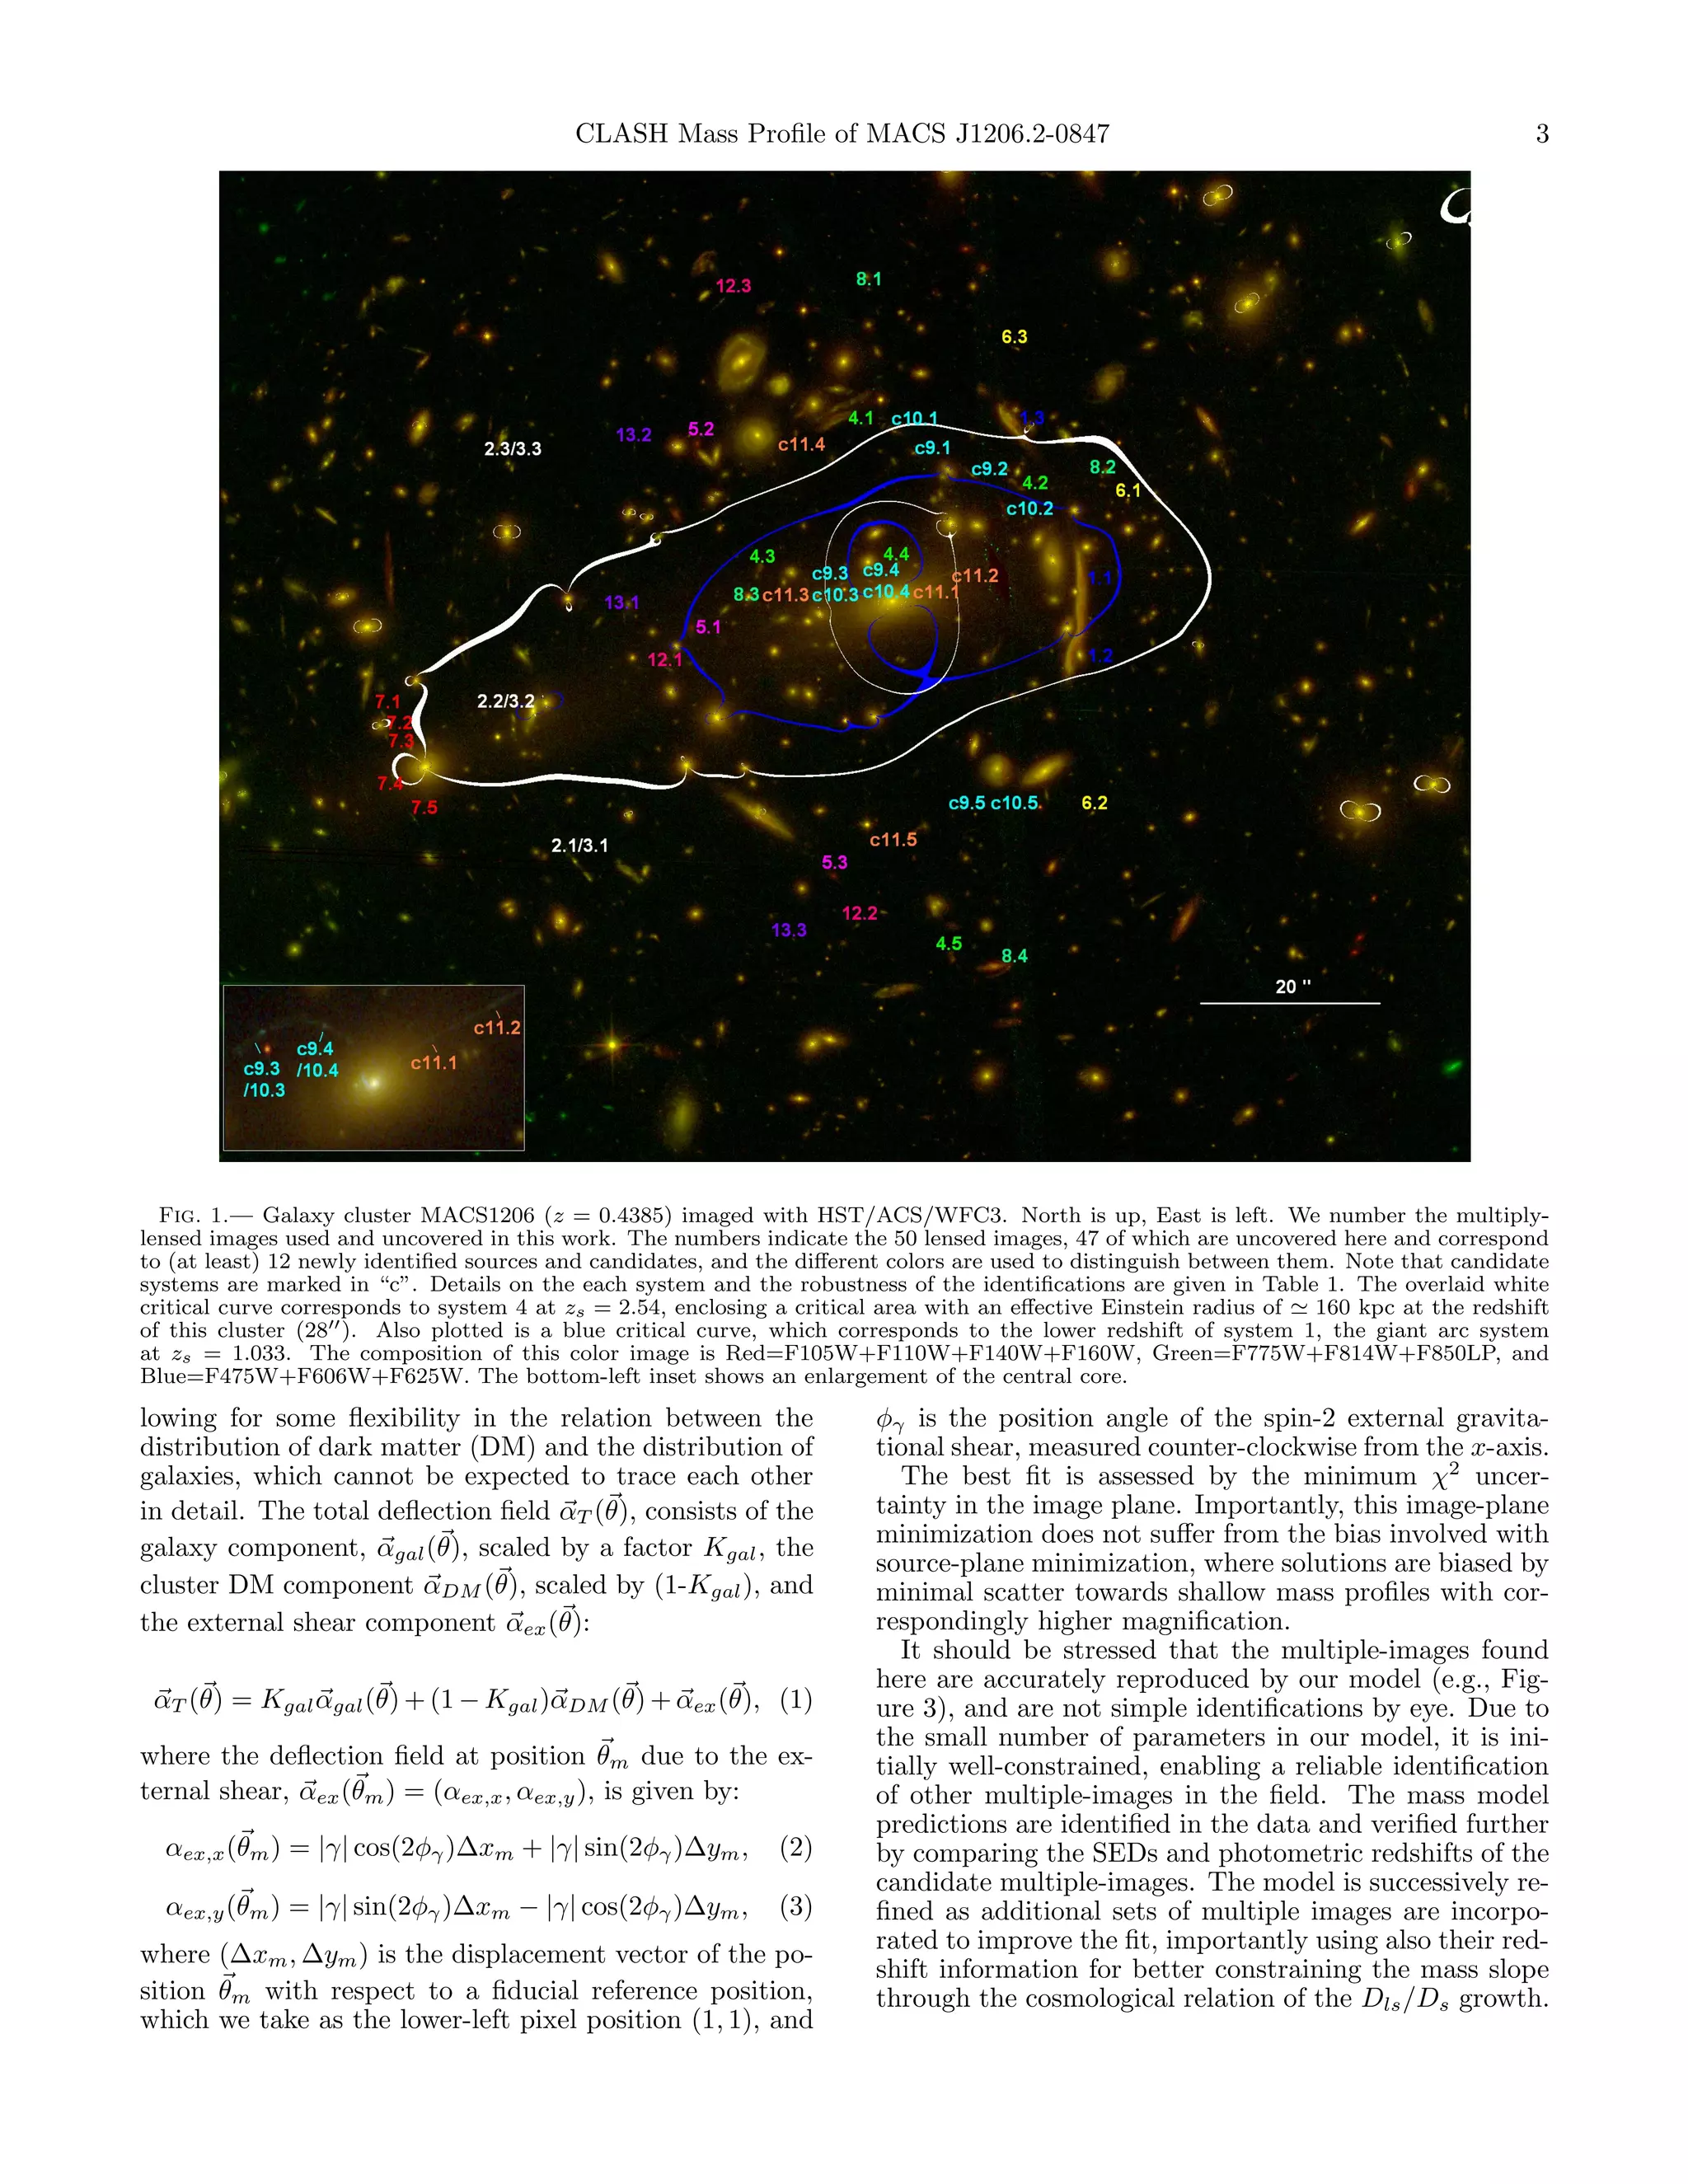
We present a strong-lensing analysis of the galaxy cluster MACS J1206.2-0847 (z=0.44) using UV,
Optical, and IR, HST/ACS/WFC3 data taken as part of the CLASH multi-cycle treasury program,
with VLT/VIMOS spectroscopy for some of the multiply-lensed arcs. The CLASH observations,
combined with our mass-model, allow us to identify 47 new multiply-lensed images of 12 distant
sources. These images, along with the previously known arc, span the redshift range 1 z 5.5, and
thus enable us to derive a detailed mass distribution and to accurately constrain, for the first time,
the inner mass-profile of this cluster. We find an inner profile slope of d log Σ/d log θ −0.55 ± 0.1
(in the range [1 ,53 ], or 5 r 300 kpc), as commonly found for relaxed and well-concentrated
clusters. Using the many systems uncovered here we derive credible critical curves and Einstein radii
for different source redshifts. For a source at zs 2.5, the critical curve encloses a large area with an
effective Einstein radius of θE = 28 ± 3 , and a projected mass of 1.34 ± 0.15 × 10¹⁴ M . From the
current understanding of structure formation in concordance cosmology, these values are relatively
high for clusters at z ∼ 0.5, so that detailed studies of the inner mass distribution of clusters such as
MACS J1206.2-0847 can provide stringent tests of the ΛCDM paradigm.
Subject headings: dark matter, galaxies: clusters: individuals: MACS J1206.2-0847, galaxies: clusters:
general, galaxies: high-redshift, gravitational lensing
1. INTRODUCTION lenses. The expected distribution of lens-sizes and the
Massive galaxy clusters, due to their high inner mass- abundance of giant lenses in particular, have been now
density, are known to form prominent gravitational established by N-body simulations (e.g., Hennawi et al.
2007), semi-analytic calculations (e.g., Oguri & Bland-
1 The School of Physics and Astronomy, Tel Aviv University;
ford 2009), and recently, also examined observationally
by a statistical analysis and lens-modeling of 10,000
adiz@wise.tau.ac.il
2 European Southern Observatory SDSS clusters (see Zitrin et al. 2011b).
3 INAF-Osservatorio Astronomico di Trieste Due to the hierarchical growth of structure in the
4 Excellence Cluster Universe, Technische Universit¨t a Universe, collapsed, virialized clusters should be found
M¨nchen
u mostly at lower redshifts. These clusters make for ex-
5 Space Telescope Science Institute
6 Universitas Sternwarte Muenchen cellent lenses as there is more mass concentrated in the
7 University of Basque Country cluster center, boosting the critical lensing area. Ac-
8 IKERBASQUE, Basque Foundation for Science
9 University College London
cording to this assumption, along with the dependency
10 MPE, Garching on the cosmological distances involved, lensing should be
11 INAF-Osservatorio Astronomico di Capodimonte therefore optimized in clusters at redshifts of zl ∼ 0.2.
12 INAF IASF, Milano However, recent work has uncovered more large higher-
13 Instituto de Astrof´ısica de Andaluc´ (CSIC)
ıa
14 Department of Physics and Astronomy, The Johns Hopkins
redshift (zl ∼ 0.5) lenses than expected by ΛCDM and
related simulations, even after accounting for lensing bias
University
15 Universitat Heidelberg (e.g., Zitrin et al. 2011a,b; Meneghetti et al. 2011).
16 University of Leiden The existence of high-redshift massive clusters at zl
17 Institut f¨ r Astronomie der Universit¨t Wien
u
18 Michigan State University
a 1 (Rosati et al. 2009; Fassbender et al. 2011; Gobat et al.
19 UC Berkeley 2011; Planck Collaboration et al. 2011; Santos et al.
20 Universidad Catolica de Chile 2011; Williamson et al. 2011), as well as the existence
21 Rutgers University of evolved galaxies at high redshift, and other reported
22 Carnegie Institution
23 Dipartimento di Fisica, Universit` degli Studi di Milano
discrepancies such as the arc abundance and high con-
a centrations, are also claimed to be unlikely given the
24 The Ohio State University
25 INAF, Osservatorio Astronomico di Bologna; INFN, predicted abundance of extreme perturbations of cluster
Sezione di Bologna sized masses in the standard ΛCDM scenario (e.g., Daddi
26 Jet Propulsion Laboratory, California Institute of Technol-
et al. 2007, 2009; Broadhurst & Barkana 2008; Broad-
ogy
27 European Laboratory for Particle Physics (CERN) hurst et al. 2008; Jee et al. 2009, 2011; Richard et al.
28 Institute of Astronomy and Astrophysics, Academia Sinica 2011; Zitrin et al. 2010, 2011a,b,d). These claimed dis-
29 MPIA, Heidelberg crepancies possibly point towards a more extended early](https://image.slidesharecdn.com/clash-newmultiple-imagesconstrainingtheinnermassprofileofmacsj1206-2-0847-111016231857-phpapp02/75/Clash-new-multiple-images-constraining-the-inner-mass-profile-of-macs-j1206-2-0847-1-2048.jpg)
![2 Zitrin et al.
history of growth, or a non-Gaussian distribution of mas- using both the BPZ program (Ben´ 2000; Ben´ et al.
ıtez ıtez
sive perturbations. 2004; Coe et al. 2006), and LePhare (Arnouts et al. 1999;
To shed light on these mysteries we have embarked on a Ilbert et al. 2006), where in practice 15 bands are used for
major project involving galaxy clusters, the Cluster Lens- the photometry, as observations for this cluster are still
ing And Supernova survey with Hubble (CLASH). The in progress. Further details are presented in Postman
CLASH program has been awarded 524 orbits of HST et al. (2011).
time to conduct a multi-cycle program that will couple We obtain spectra for a number of multiple systems
the gravitational-lensing power of 25 massive intermedi- uncovered here, taken as part of the VLT/VIMOS Large
ate redshift galaxy clusters with HST’s newly enhanced Programme 186.A-0798, which will perform panoramic
panchromatic imaging capabilities (WFC3 and the re- spectroscopy of 14 southern CLASH clusters, targeting
stored ACS), in order to test structure formation mod- hundreds of cluster members per cluster and SL features
els with unprecedented precision, and to derive accurate in their cores. Details on this program will be presented
mass profiles. For full details about the CLASH program elsewhere, when observations for one cluster are com-
see Postman et al. (2011). pleted. For each cluster, four VIMOS pointings are used,
The galaxy cluster MACS J1206.2-0847 (z=0.4385; keeping one of the four quadrants constantly locked on
MACS1206 hereafter), is an X-ray selected system at in- the cluster core, thus allowing long exposures on the
termediate redshift found by the Massive Cluster Survey, arcs, where exposure times for each pointing are about
MACS (Ebeling et al. 2001, 2007, 2010; see also Ebeling 45-60 minutes. By filling the inter-quadrant gaps, the
et al. 2009), and therefore constitutes an interesting lens- final VIMOS layout covers 20-25 across. Either the low-
ing target in the aspects discussed above. A first mass resolution LR-Blue grism or the intermediate resolution
model for this cluster was presented by Ebeling et al. orange MR grism is used, depending on the photometric
(2009), based on 1-band HST/ACS imaging (F606W), redshifts of the targets.
combined with additional optical and NIR ground-based The spectra presented here are the results of the very
imaging. Ebeling et al. (2009) have identified one multi- first observations for this program, consisting of four
ple system, consisting of a giant arc and its counter image pointings with the LR-Blue grism which yielded ap-
at zs = 1.036, and presented a mass distribution for this proximately 1000 redshifts. This configuration provides
cluster, though without constraining the profile due to a spectral resolution of ∼ 28˚ with 1
A slits and a
the lack of sufficient high-resolution color-imaging, and useful wavelength coverage of 3700–6800˚. Preliminary
A
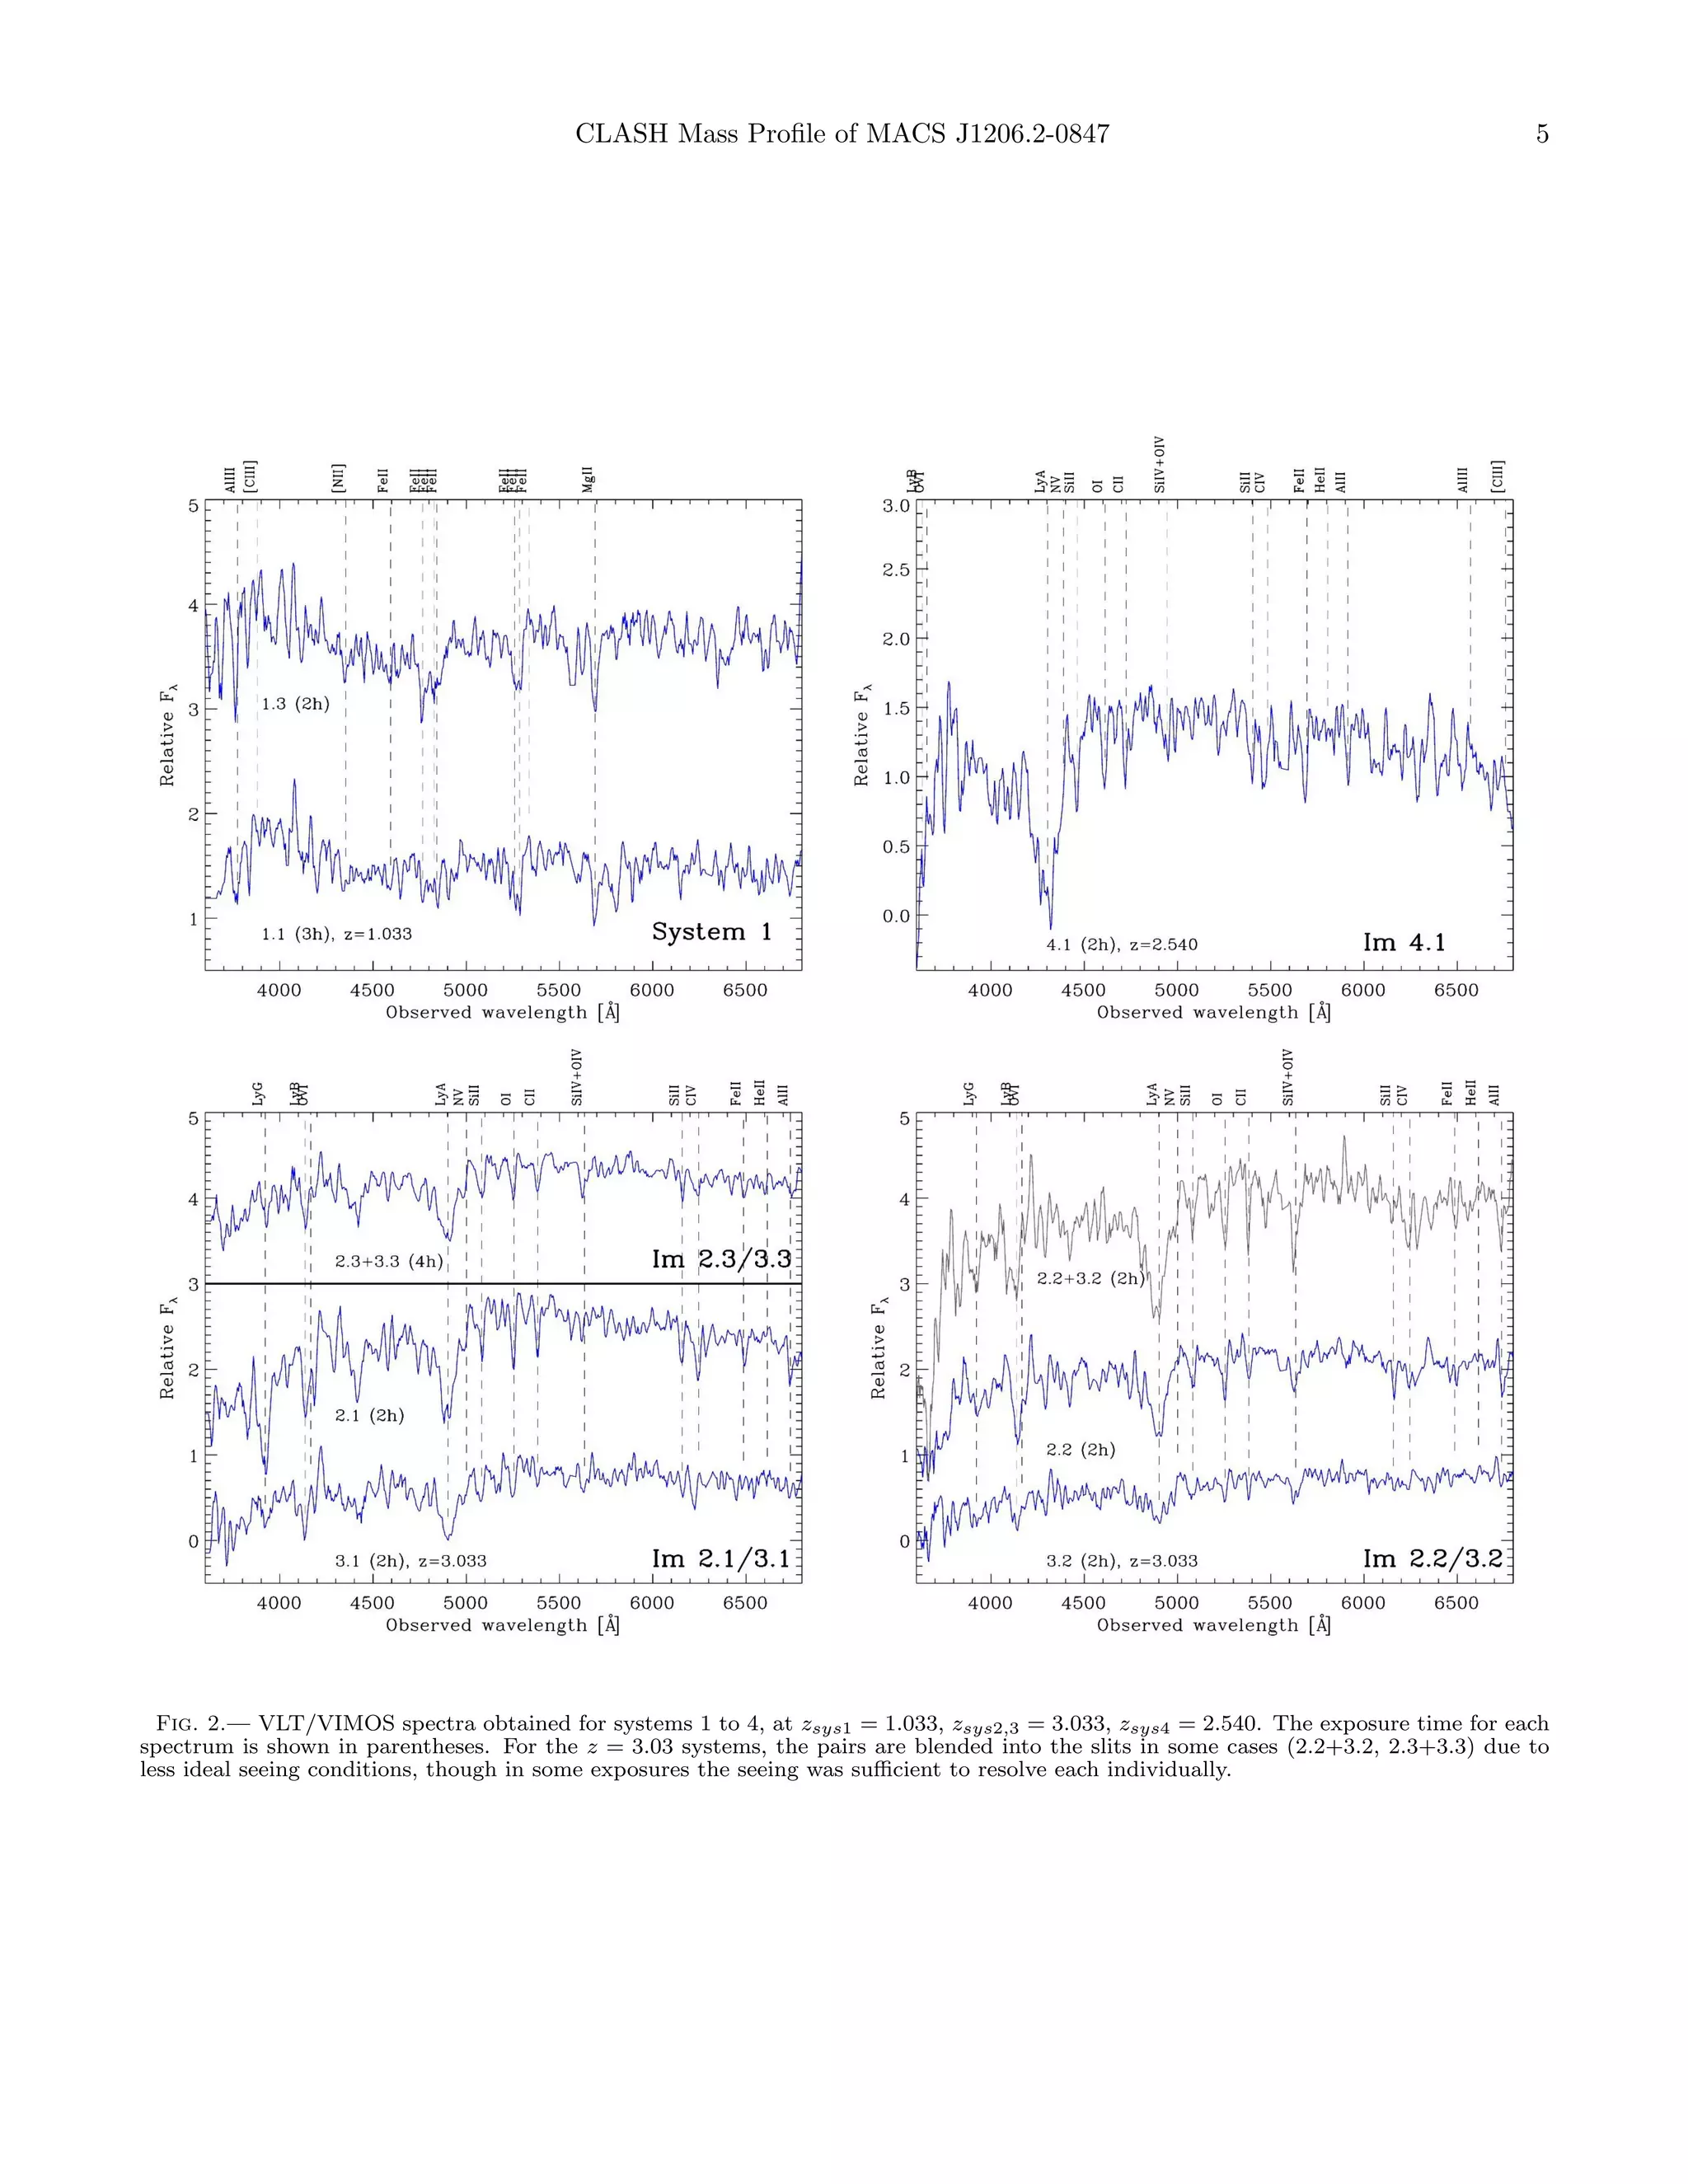
correspondingly, other multiple-systems. The 16 HST HST/CLASH data from the first two visits of MACS1206
bands chosen for the CLASH project ranging from the were used to select images 1.[1,2,3], 2.[1,2,3], 3.[1,2,3],
UV through the optical and to the IR, along with spec- and 4.1, as spectroscopic targets (see Figure 1). The
tra from the VLT/VIMOS for some of the brighter arcs, slits ran along the NS direction. For some exposures the
enable us to obtain accurate redshifts for the multiply- seeing was very good so that separate spectra of the pairs
lensed sources presented in this work. We use these data 2.1/3.1 and 2.2/3.2 (separation of ∼ 1 ) were taken (and
available to date, along with our well-tested approach to are shown in Figure 2, Table 1), though in other cases
SL modeling (e.g., Broadhurst et al. 2005; Zitrin et al. the pairs were blended in the slit. The spectrum of 1.2,
2009a,b, 2010, 2011a,c,d), to find a significant number of which contains the blend of the giant arc and a com-
multiple images across the central field of MACS1206 so pact cluster galaxy, is not shown. A spectrum of this
that its mass distribution and inner profile can be con- arc, covering redder wavelengths including the [OII] line,
strained for the first time, and with high precision. was however published in Ebeling et al. (2009). Our
The paper is organized as follows: In §2 we describe spectroscopy also confirms that the four compact galax-
the observations, and in §3 we detail the SL analysis. In ies right on the East and West side to the giant arc are
§4 we report and discuss the results. Throughout this early-type cluster members.
paper we adopt a concordance ΛCDM cosmology with
(Ωm0 = 0.3, ΩΛ0 = 0.7, h = 0.7). With these param- 3. STRONG LENSING MODELING AND ANALYSIS
eters one arcsecond corresponds to a physical scale of The approach to lens modeling we use here (e.g.,
5.67 kpc for this cluster (at z = 0.4385; Ebeling et al. Broadhurst et al. 2005; Zitrin et al. 2009b) begins with
2009). The reference center of our analysis is fixed on the assumption that mass approximately traces light, so
the brightest cluster galaxy (BCG): RA = 12:06:12.15 that the photometry of the red-sequence cluster mem-
Dec = -08:48:03.4 (J2000.0). ber galaxies is used as the starting point for our model.
In addition, using our extensive multi-band imaging and
2. OBSERVATIONS AND REDSHIFTS corresponding photometric redshifts, these can be then
As part of the CLASH program, MACS1206 has been verified as members lying at the cluster redshift.
observed with HST from 2011 March, and is scheduled to We approximate the large scale distribution of clus-
be observed further until 2011 July. This is the third of ter mass by assigning a power-law mass profile to each
25 clusters to be observed to a depth of 20 HST orbits in galaxy, the sum of which is then smoothed. The de-
16 filters with the Wide Field Camera 3 (WFC3) UVIS gree of smoothing (S) and the index of the power-law
and IR cameras, and the Advanced Camera for Surveys (q) are the most important free parameters determin-
(ACS) WFC. The images are processed for debias, flats, ing the mass profile. A worthwhile improvement in fit-
superflats, and darks, using standard techniques, and are ting the location of the lensed images is generally found
then co-aligned and combined using drizzle algorithms to by expanding to first order the gravitational potential of
a scale of 0.065 / pixel. The full UVIS/ACS/WFC3-IR this smooth component, equivalent to a coherent shear
data set is then importantly used for multiple-images ver- describing the overall matter ellipticity. The direction
ification and measurement of their photometric redshifts of the shear and its amplitude are free parameters, al-](https://image.slidesharecdn.com/clash-newmultiple-imagesconstrainingtheinnermassprofileofmacsj1206-2-0847-111016231857-phpapp02/75/Clash-new-multiple-images-constraining-the-inner-mass-profile-of-macs-j1206-2-0847-2-2048.jpg)
![4 Zitrin et al.
TABLE 1
Multiple-image systems and candidates
ARC RA DEC BPZ zphot LePhare zphot spec-z zmodel Comment
ID (J2000.0) (J2000.0) (best) [95% C.L.] (best) [90% C.L.]
1.1 12:06:10.75 -08:48:01.01 – [–] – [–] 1.033 (1.033)
1.2 12:06:10.82 -08:48:08.95 1.04 [0.96–1.12] 1.06 [1.04–1.09] (1.036) ” Ebeling et al. (2009)
1.3 12:06:11.29 -08:47:43.44 1.01 [0.93–1.09] 1.05 [1.03–1.06] 1.033 ”
2.1 12:06:14.53 -08:48:32.37 – [–] – [–] 3.03 (3.03)
2.2 12:06:15.00 -08:48:17.67 3.40 [3.23–3.57] 3.19 [3.12–3.36] 3.03 ”
2.3 12:06:15.03 -08:47:48.07 3.68 [3.50–3.86] 3.64 [3.59–3.70] 3.03 ”
3.1 12:06:14.43 -08:48:34.20 3.73 [3.55–3.92] 3.65 [3.60–3.73] 3.03 (3.03)
3.2 12:06:15.00 -08:48:16.50 – [–] – [–] 3.03 ”
3.3 12:06:15.01 -08:47:48.65 3.52 [3.34–3.70] 3.62 [3.53–3.67] 3.03 ”
4.1 12:06:12.58 -08:47:43.12 2.99 [2.83–3.15] 2.54 [2.48–2.60] 2.54 (2.54)
4.2 12:06:11.22 -08:47:50.27 2.54 [2.36–2.71] 2.35 [2.18–2.64] (2.54) ”
4.3 12:06:13.15 -08:47:59.84 2.35 [2.16–2.54] 1.93 [1.91–1.95] (2.54) ”
4.4 12:06:12.119 -08:47:59.51 – [–] – [–] (2.54) ”
4.5 12:06:11.70 -08:48:43.04 3.04 [2.83–3.20] 2.67 [2.50–3.24] (2.54) ”
5.1 12:06:13.66 -08:48:06.28 1.87 [1.73–1.99] 1.76 [1.72–1.89] – 1.85
5.2 12:06:13.62 -08:47:45.85 1.80 [1.60–1.91] 1.63 [1.54–1.72] – ”
5.3 12:06:12.59 -08:48:34.06 1.64 [1.46–1.84] 1.55 [1.09–1.74] – ”
6.1 12:06:10.38 -08:47:52.10 2.79 [2.64–2.94] 2.86 [2.77–2.93] – 2.8
6.2 12:06:10.64 -08:48:26.97 2.65 [2.29–2.79] 2.53 [2.44–2.71] – ”
6.3 12:06:11.21 -08:47:35.24 2.77 [2.62–2.92] 2.53 [2.37–2.64] – ”
7.1 12:06:15.98 -08:48:15.98 3.55 [3.37–3.91] 3.47 [3.29–4.04] – 3.7 affected by local galaxy weight
7.2 12:06:15.95 -08:48:17.21 – [–] – [–] – ” ”
7.3 12:06:15.95 -08:48:18.45 4.02 [3.70–4.22] 3.89 [3.34–4.07] – ” ”
7.4 12:06:15.90 -08:48:23.01 – [–] – [–] – ” ”
7.5 12:06:15.75 -08:48:27.49 3.97 [3.78–4.17] 3.68 [3.43–4.08] – ” ”
8.1 12:06:12.33 -08:47:28.61 5.44 [5.19–5.72] 5.52 [5.15–5.73] – 5.7
8.2 12:06:10.58 -08:47:49.49 5.42 [5.17–5.72] 5.44 [5.10–5.75] – ”
8.3 12:06:13.25 -08:48:03.81 5.42 [5.17–5.74] 5.42 [4.91–5.74] – ”
8.4 12:06:11.36 -08:48:44.99 5.46 [5.21–5.71] 5.51 [5.22–5.66] – ” most probable
9.1 12:06:11.99 -08:47:46.89 1.74 [1.63–1.85] 1.74 [1.62–1.78] – 1 candidate system
9.2 12:06:11.55 -08:47:49.36 1.76 [1.65–1.87] 1.75 [1.67–1.79] – ” ”
9.3 12:06:12.53 -08:48:01.47 – [–] – ” ”
9.4 12:06:12.31 -08:48:01.21 – [–] – ” ”
9.5 12:06:11.48 -08:48:30.61 1.41 [0.85–1.78] 1.08 [0.80-1.82] – ” most probable
10.1 12:06:12.13 -08:47:44.48 1.68 [1.48–1.79] 1.54 [1.50–1.65] – 1.4 candidate system
10.2 12:06:11.32 -08:47:52.81 1.57 [1.11–1.72] 1.60 [1.02–1.76] – ” ”
10.3 12:06:12.53 -08:48:01.47 – [–] – ” degeneracy with 9.3
10.4 12:06:12.31 -08:48:01.21 – [–] – ” degeneracy with 9.4
10.5 12:06:11.31 -08:48:32.83 1.38 [0.8–1.86] 0.94 [0.90–1.07] – ” most probable
11.1 12:06:12.04 -08:48:02.25 – [–] – 1.3 candidate system
11.2 12:06:11.77 -08:48:00.49 – [–] – ” ”
11.3 12:06:13.08 -08:48:04.00 1.42 [1.13–1.78] 1.72 [1.72–1.72] – ” ”
11.4 12:06:12.88 -08:47:44.75 1.12 [0.31–1.48] 1.10 [0.04–1.15] – ” ”, bimodal
11.5 12:06:11.99 -08:48:31.98 1.31 [1.19–1.76] 1.32 [1.07–1.80] – ” ”
12.1 12:06:13.82 -08:48:11.03 3.78 [3.50–4.05] 3.63 [3.26–4.01] – 4
12.2 12:06:12.42 -08:48:39.53 3.91 [3.44–4.13] 0.28 [0.11–3.43] – ” bimodal
12.3 12:06:13.43 -08:47:29.91 3.97 [3.70–4.17] 3.88 [3.61–4.06] – ”
13.1 12:06:14.16 -08:48:05.11 2.88 [2.65–3.12] 2.90 [2.32–3.16] – 3.6
13.2 12:06:14.09 -08:47:46.37 3.64 [3.30–3.82] 3.43 [0.23–3.71] – ” bimodal
13.3 12:06:12.89 -08:48:41.09 3.15 [0.2–3.41] 2.97 [0.08–3.43] – ” ”
Note. — Multiple-image systems and candidates used and uncovered by our model. The columns are: arc ID; RA and DEC in J2000.0;
best photo-z using BPZ (Ben´ ıtez 2000; Ben´ıtez et al. 2004; Coe et al. 2006), along with 95% confidence level, minimal and maximal
photo-z; best photo-z using LePhare (Arnouts et al. 1999; Ilbert et al. 2006), along with 90% confidence level, minimal and maximal
photo-z; spectroscopic redshift, spec-z (images marked in parenthesis were not spectroscopically measured here); zmodel , estimated redshift
for the arcs which lack spectroscopy as predicted by the mass model; comments. System 1 was uncovered by Ebeling et al. (2009) who
measured the redshift of images 1.1 and 1.2 spectroscopically at z = 1.036; our spectroscopy yields z = 1.033 for this system. Note that
we interpret the long arc (images 1.1/1.2) as a double-lensed image, though Ebeling et al. (2009) identify it to consist of several (partially)
lensed images. Either interpretation has only a very local (negligible) effect on the model. All other systems listed above are found in our
work, where we obtain VLT/VIMOS spectroscopy for systems 1 to 4. Note that unusually large errors in the photo-z imply a bimodal
distribution, such cases are specified in the comments. We denote in the comments column where the most probable image was chosen but
other candidates are seen nearby. Systems 9 to 11 are candidate systems, since their image-plane rms is extensively larger than the typical
rms of our model, or simply since the photo-z’s disagree with the model prediction. Systems 9 and 10 show similar symmetry to that of
system 4, strengthening their identification on one hand, but only 2 radial images are seen - so that these are degenerate with each other.
Due to the BCG light it is hard to determine unambiguously if, or to which, of these two systems they belong. Note also, that if images
11.1 and 11.2 are not multiple images, but, say, a jet coming out of the BCG (see Figure 1), then images 11.3 to 11.5 may constitute an
individual system. All other systems we consider as secure identifications, in the context of the photometric redshifts, internal details, and
the reproduction by our model.](https://image.slidesharecdn.com/clash-newmultiple-imagesconstrainingtheinnermassprofileofmacsj1206-2-0847-111016231857-phpapp02/75/Clash-new-multiple-images-constraining-the-inner-mass-profile-of-macs-j1206-2-0847-4-2048.jpg)
![6 Zitrin et al.
Fig. 4.— Projected total mass profile. We show in light blue the
radial surface mass-density profile in units of the critical surface
density (κ; right-side y-axis), for a source redshift of zs = 2, as
well as the overall enclosed mass per radius, M (< R), in dark blue
(left-side y-axis), along with their errors. The SL data were de-
rived using the 11 secure sets of multiple images shown in Figure
1, along with the redshift information from VLT/VIMOS spec-
troscopy, and 15-band CLASH photometric redshifts. Overplotted
is a dash-dotted line marking the mean Einstein radius (zs = 2) dis-
tribution from 3000 SDSS clusters at z ∼ 0.44 (Zitrin et al. 2011b),
and a dashed line marking the Einstein radius of MACS1206. See
Fig. 3.— Reproduction of systems 1 to 4 by our model, compared §4 for more details on this comparison.
with the real images. For each system we delens one image to the
source plane and relens it back to the image-plane to obtain the
other images of that system. More explicitly, we delens-relens, re- (see Figure 1). For the lower source redshift of system
spectively, images 1.1, 2.2/3.2, and 4.1, each in the lensing-distance 1, zs = 1.033, the Einstein radius is 17 , enclosing
ratio expected from its redshift (1.033, 3.03, 2.54, respectively), to a projected mass of 0.8 ± 0.1 × 10¹⁴ M . For compari-
obtain the results shown here. The upper images in each row are son, our model encloses within 21 , a projected mass of
the real images while the lower images are those reproduced by
our model. As can be seen, our model reproduces the images of M (< 21 ) 1±0.1×10¹⁴ M , while Ebeling et al. (2009)
these systems with great accuracy. In these stamp images North found similarly, although based on only one system, a
is right, East is up, and some of the images are slightly zoomed-in projected mass of M (< 21 ) = 1.12 ± 0.05 × 10¹⁴ M ,
for clarity. consistent with our result. In addition, as a consistency
check for the very inner profile around the BCG, we com-
4. RESULTS AND CONCLUSIONS pared our result to the F160W light. By estimating the
Using CLASH imaging, we have identified 47 new stellar mass profile from the F160W surface brightness
multiple-images in MACS1206, corresponding to 12 dis- photometry, assuming a Kroupa IMF, the stellar mass
tant sources. These images, along with the previously is approximately 10% of the total mass within 30 kpc,
known arc (Ebeling et al. 2009), span the redshift range which is approximately half the BCG effective radius.
1 z 5.5 and thus allow us to derive a robust mass We defer to forthcoming papers the exact assessment of
distribution and constrain the profile of this cluster, for the DM mass distribution steepness in the very inner re-
the first time. gion (say, below ∼ 5 kpc) after taking into account the
We have made use of the location and redshift of stellar and gas baryonic contributions.
all credible multiple-images to fully constrain the mass The corresponding critical curves for different redshifts
model and profile. We obtained VLT/VIMOS spectra for are plotted on the cluster image in Figure 1, along with
systems 1 to 4, at redshifts 1.033, 3.03, 3.03, and 2.54, the multiply-lensed systems. The resulting total mass
respectively, to help pin down the profile with greater profile is shown in Figure 4, for which we measure a slope
accuracy. Details on the multiple systems are found in of d log Σ/d log r −0.55 ± 0.1 (in the range [1 ,53 ],
Figure 1 and Table 1, where in Figure 3 we show exam- or 5 r 300 kpc), similar to other usually-relaxed
ples for reproductions of some of the multiple-systems by and well-concentrated lensing clusters (Broadhurst et al.
our model. Estimating the accuracy of our mass distribu- 2005; Zitrin et al. 2009b, 2010). X-ray and optical light
tion quantitatively, we obtain an average image-plane re- contours (see e.g., Ebeling et al. 2009) also show an ap-
production uncertainty of 2.5 per image, with an image- proximately (circularly) symmetric distribution, suggest-
plane rms of 3.1 including all 50 multiply-lensed images; ing a fairly relaxed system without a prominent sign of
a realistic value given the many multiple images used and recent merger. A full assessment of the degree of relax-
the small number of free parameters in our modeling. ation of this system will be soon enabled, by the dynam-
For a source at zs = 2.54, the critical curves enclose ical analysis from several hundreds member velocities we
a relatively large area, with an effective Einstein radius are currently collecting in our spectroscopic program, as
of rE = 28 ± 3 , or 158 kpc at the redshift of the well as from the combination of other mass diagnostics.
cluster. A projected mass of 1.34 ± 0.15 × 10¹⁴ M is We note that given its redshift, MACS1206 has a rela-
enclosed by this critical curve for this source redshift tively large Einstein radius. Previous studies have shown](https://image.slidesharecdn.com/clash-newmultiple-imagesconstrainingtheinnermassprofileofmacsj1206-2-0847-111016231857-phpapp02/75/Clash-new-multiple-images-constraining-the-inner-mass-profile-of-macs-j1206-2-0847-6-2048.jpg)

The document summarizes a study of the galaxy cluster MACS J1206.2-0847 using Hubble Space Telescope observations. The observations revealed 47 new multiply-lensed images of 12 distant galaxies, enabling an accurate analysis of the inner mass profile. The analysis found an inner slope of -0.55 ± 0.1, typical of relaxed clusters. For a source at redshift 2.5, the critical curve encompasses an effective Einstein radius of 28 ± 3 arcseconds, corresponding to a projected mass of 1.34 ± 0.15 × 10¹⁴ solar masses. The high mass and redshift of the cluster provide a stringent test of the standard cosmological model.


![Coded Agents – with UiPath SDK + LangGraph [Virtual Hands-on Workshop]](https://cdn.slidesharecdn.com/ss_thumbnails/codedagentsdeck-251215155422-5497c599-thumbnail.jpg?width=640&height=640&fit=bounds)


