Download as PDF, PPTX


![Predicting bug-prone methods
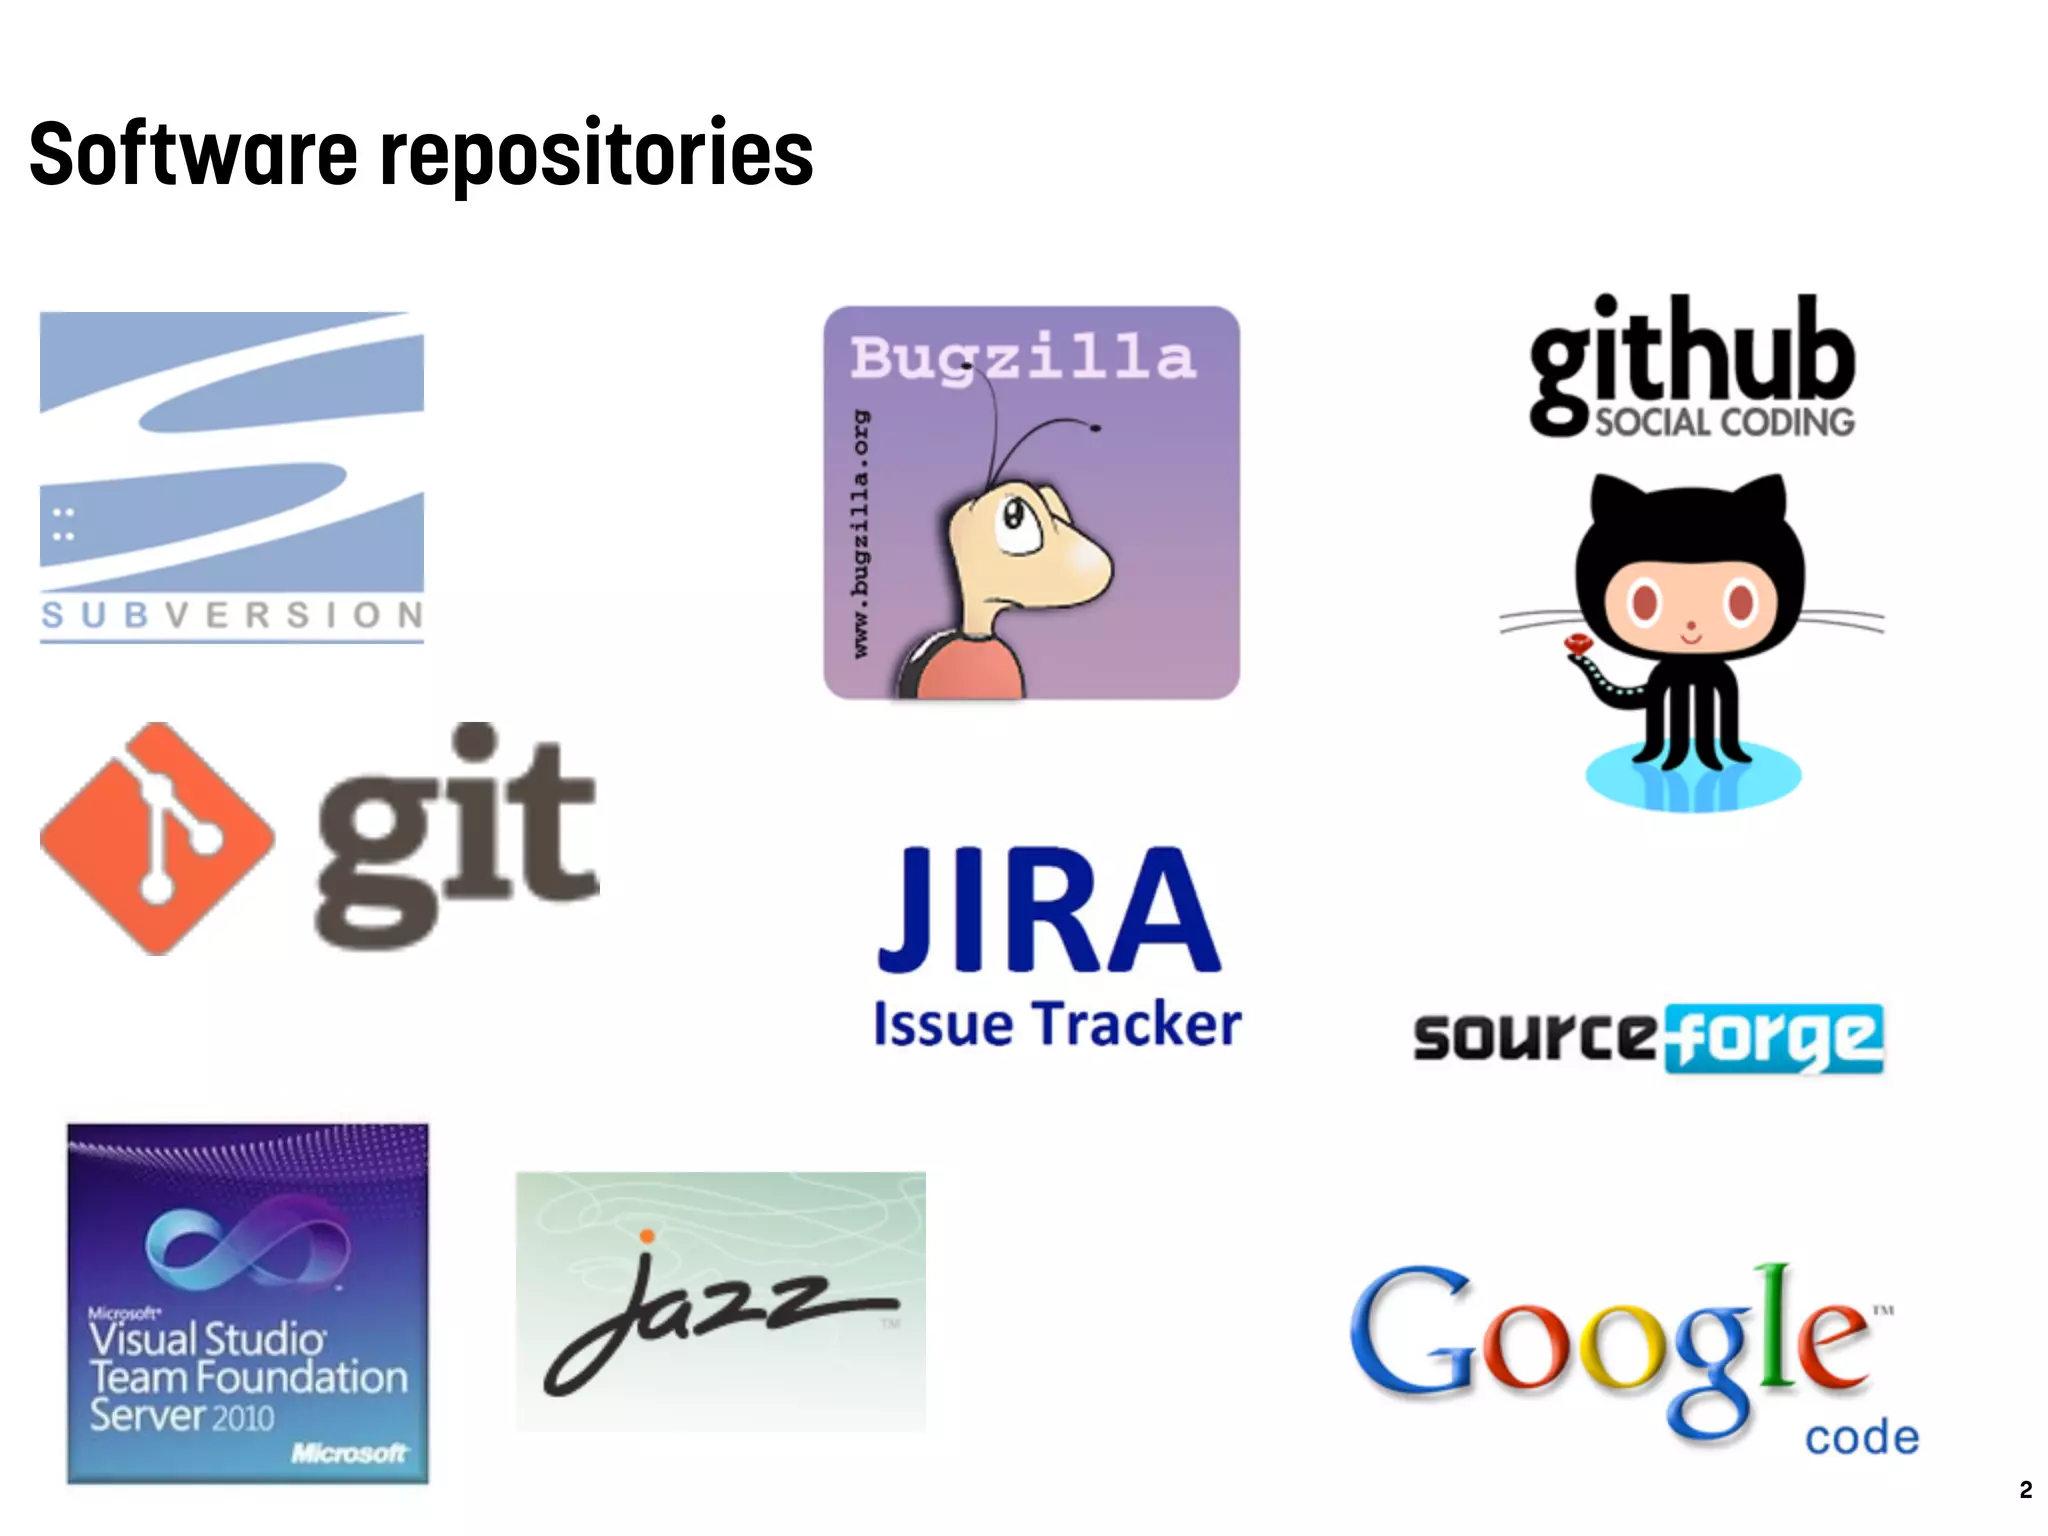
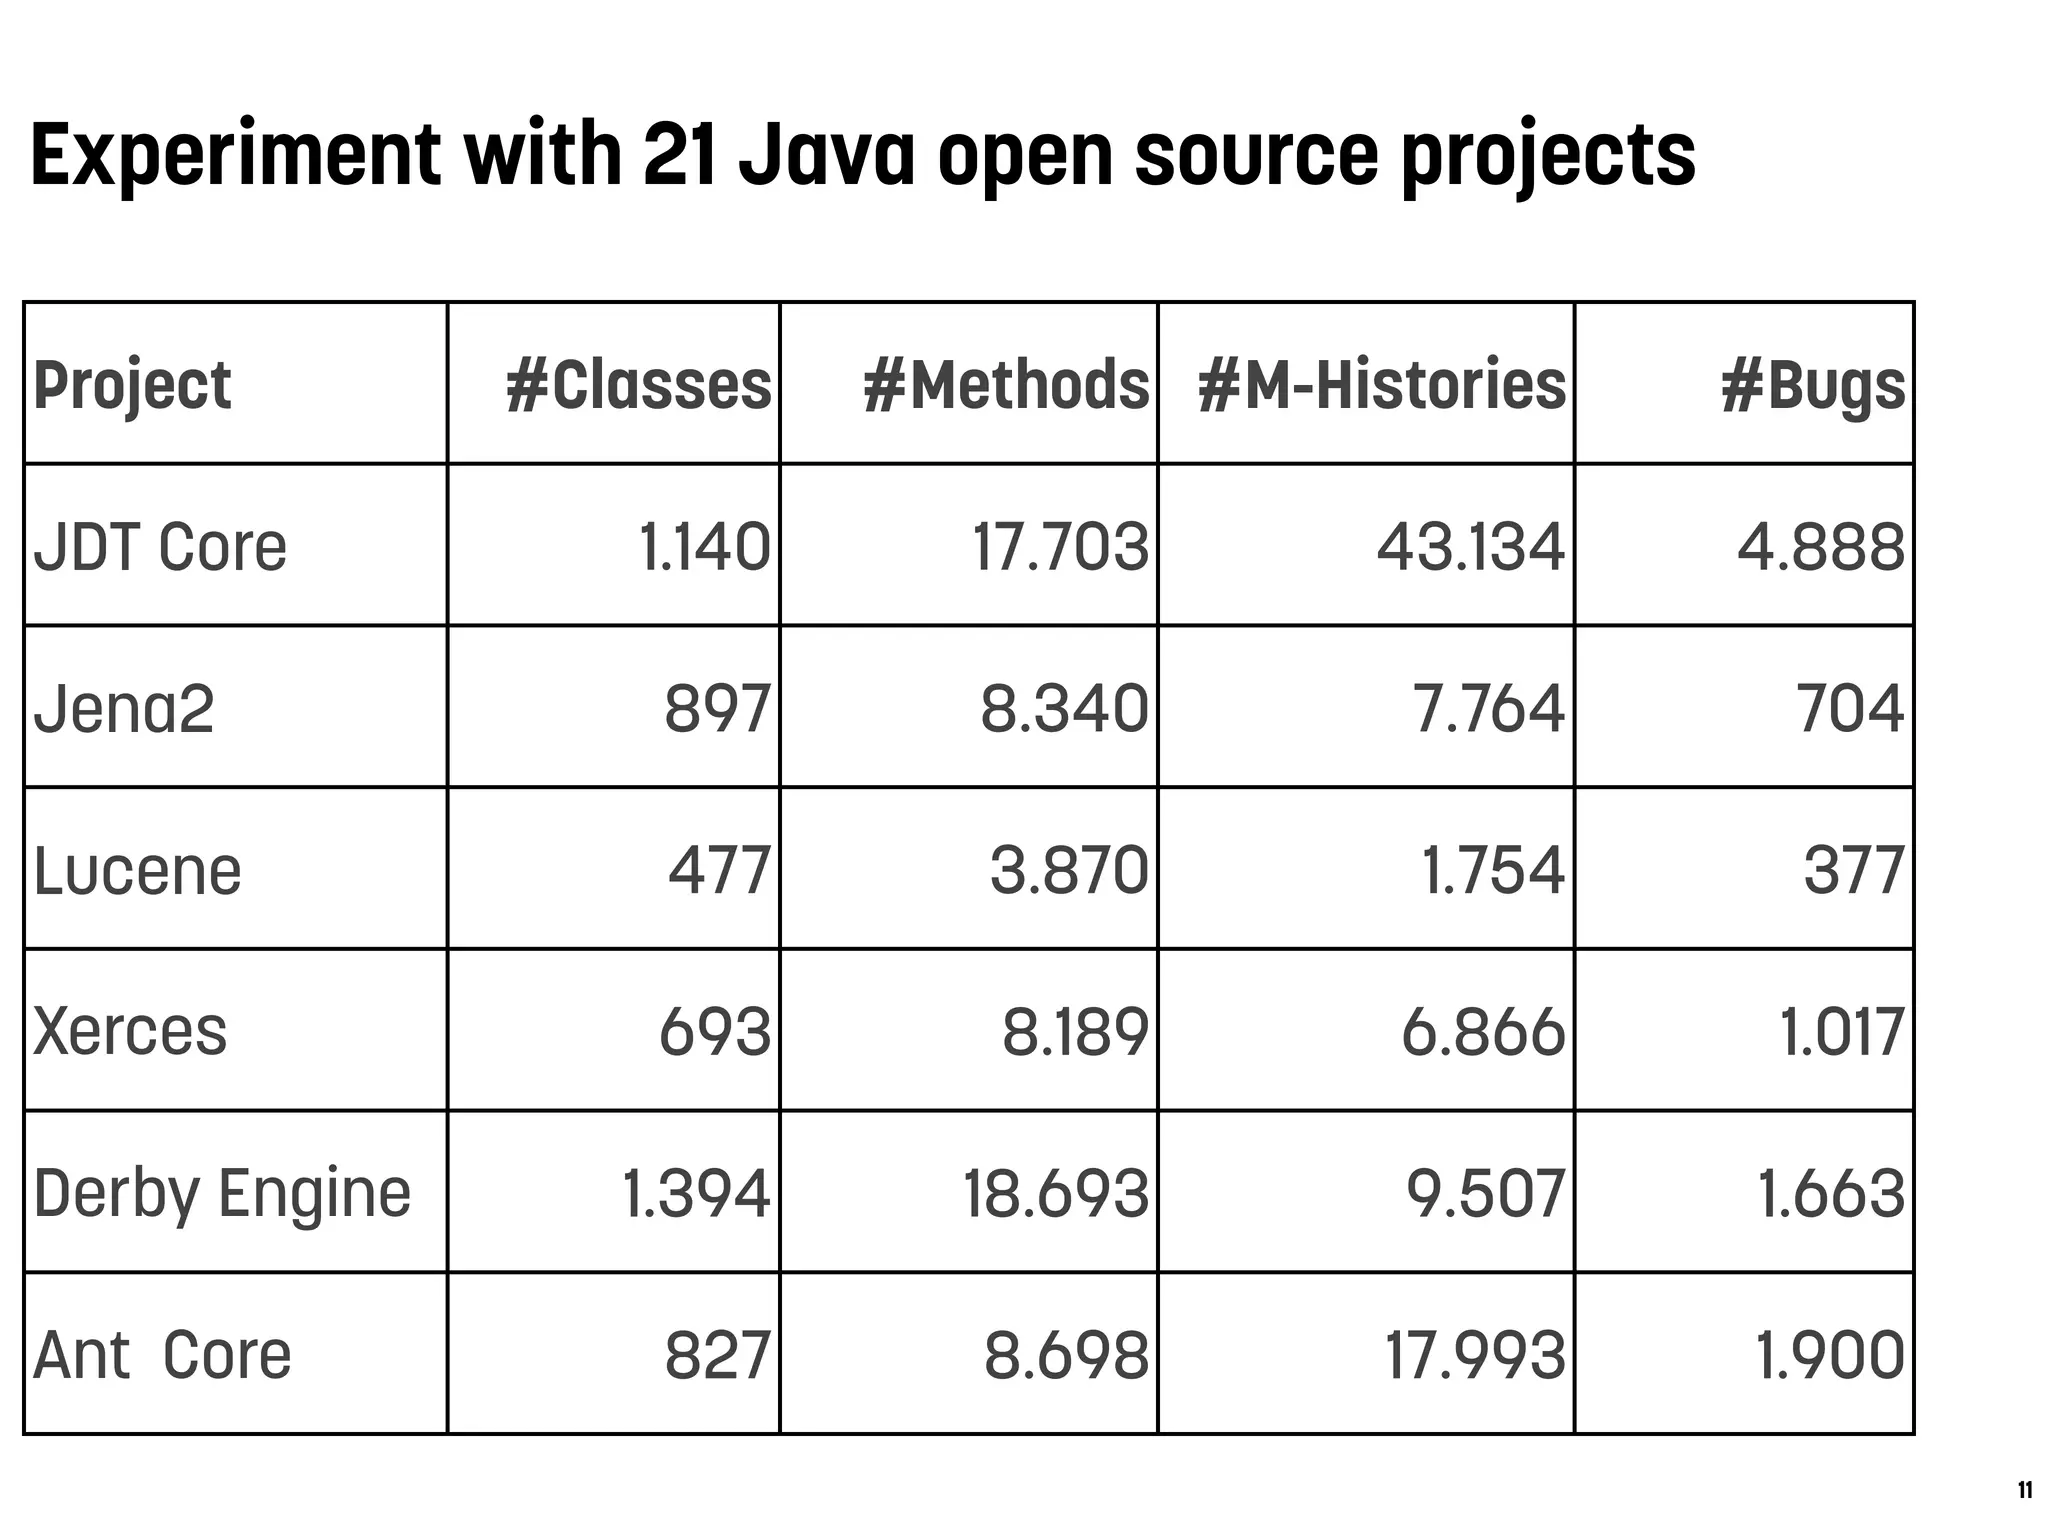
Bug-prone vs. not bug-prone
14
.1 Experimental Setup
Prior to model building and classification we labeled
ethod in our dataset either as bug-prone or not bug-p
s follows:
bugClass =
not bug − prone : #bugs = 0
bug − prone : #bugs >= 1
hese two classes represent the binary target classes
aining and validating the prediction models. Using 0
pectively 1) as cut-point is a common approach applie
any studies covering bug prediction models, e.g., [30
7, 4, 27, 37]. Other cut-points are applied in litera
r instance, a statistical lower confidence bound [33] or
edian [16]. Those varying cut-points as well as the div](https://image.slidesharecdn.com/antwerpen-ataleofexperimentsonbugprediction-160206091401/75/A-Tale-of-Experiments-on-Bug-Prediction-14-2048.jpg)
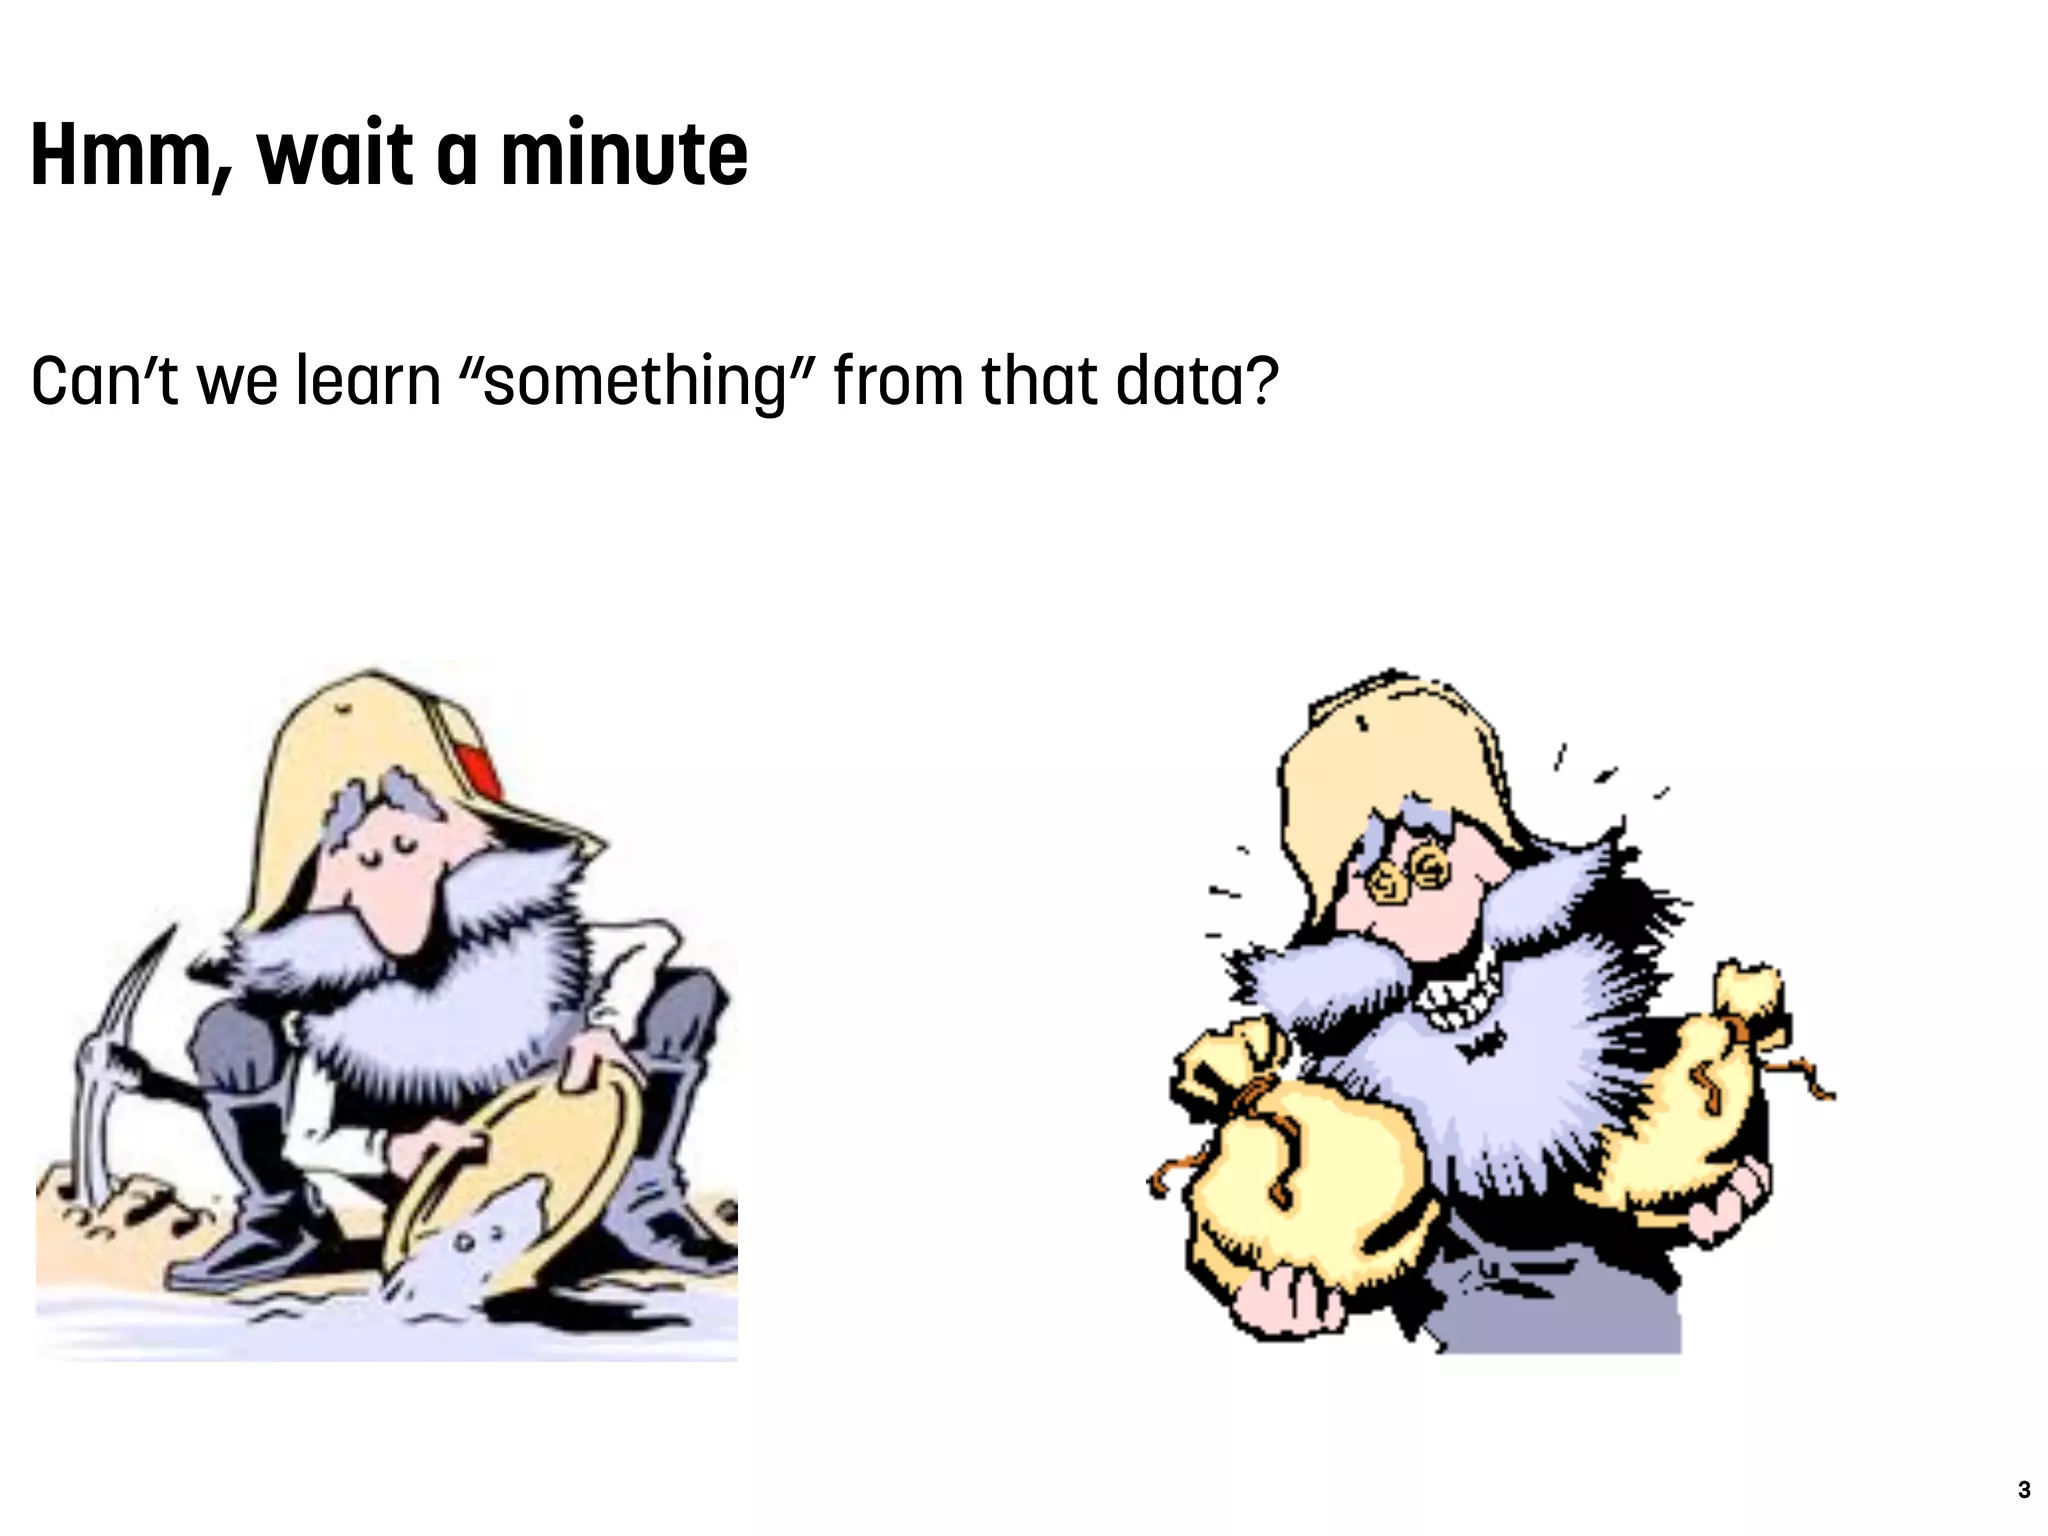
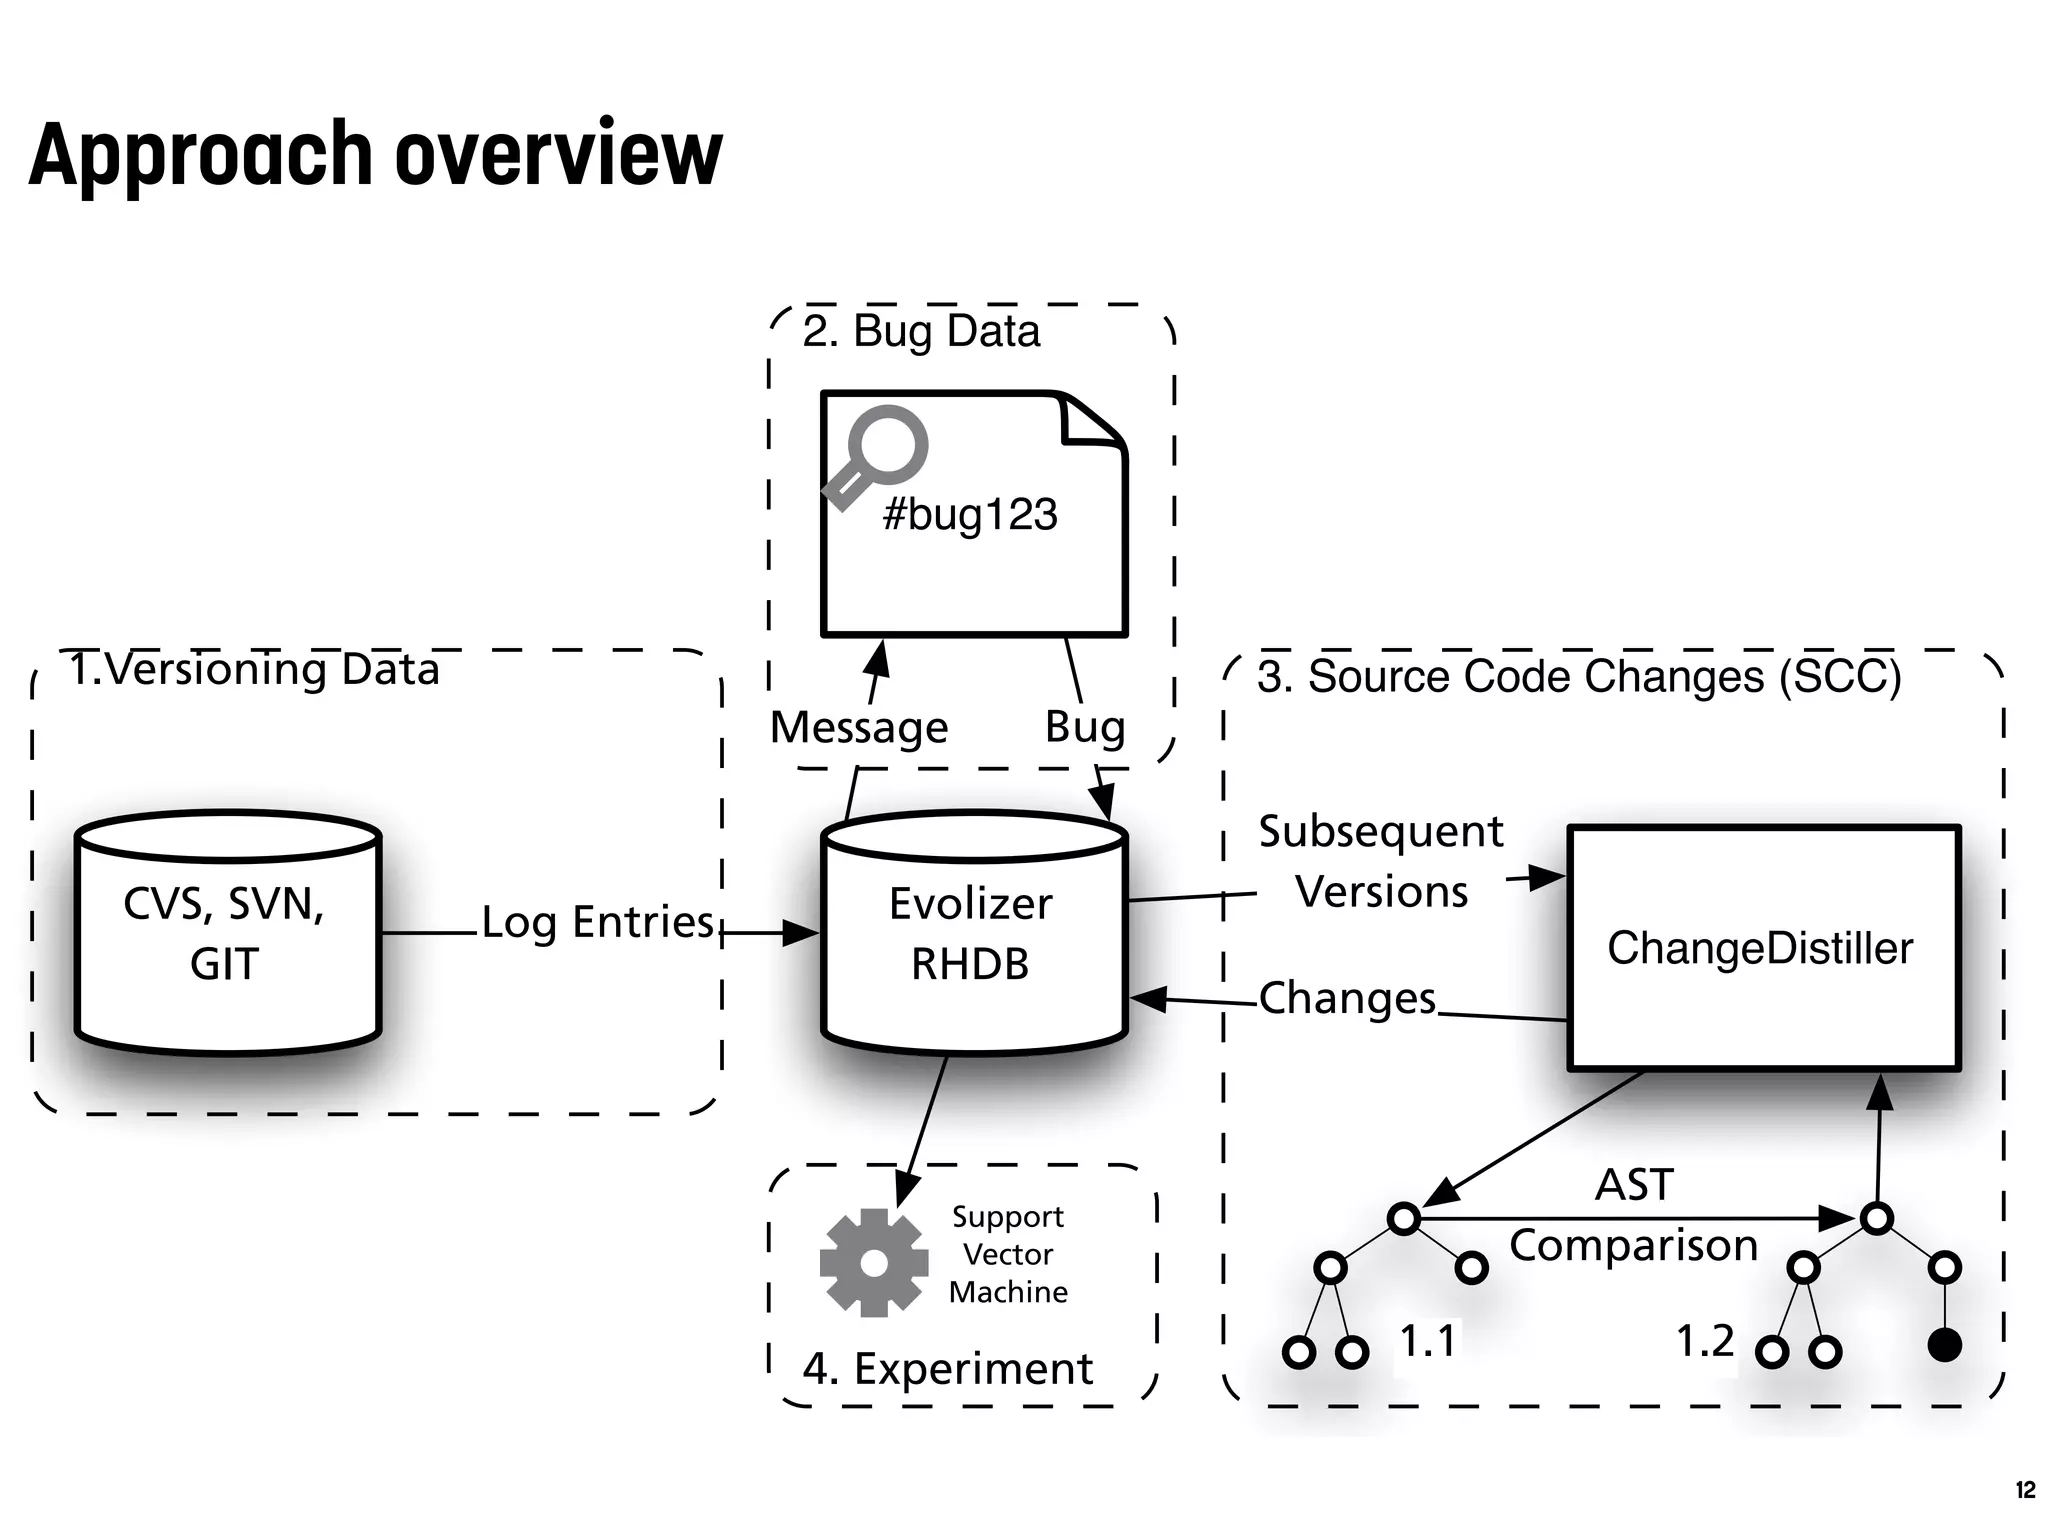
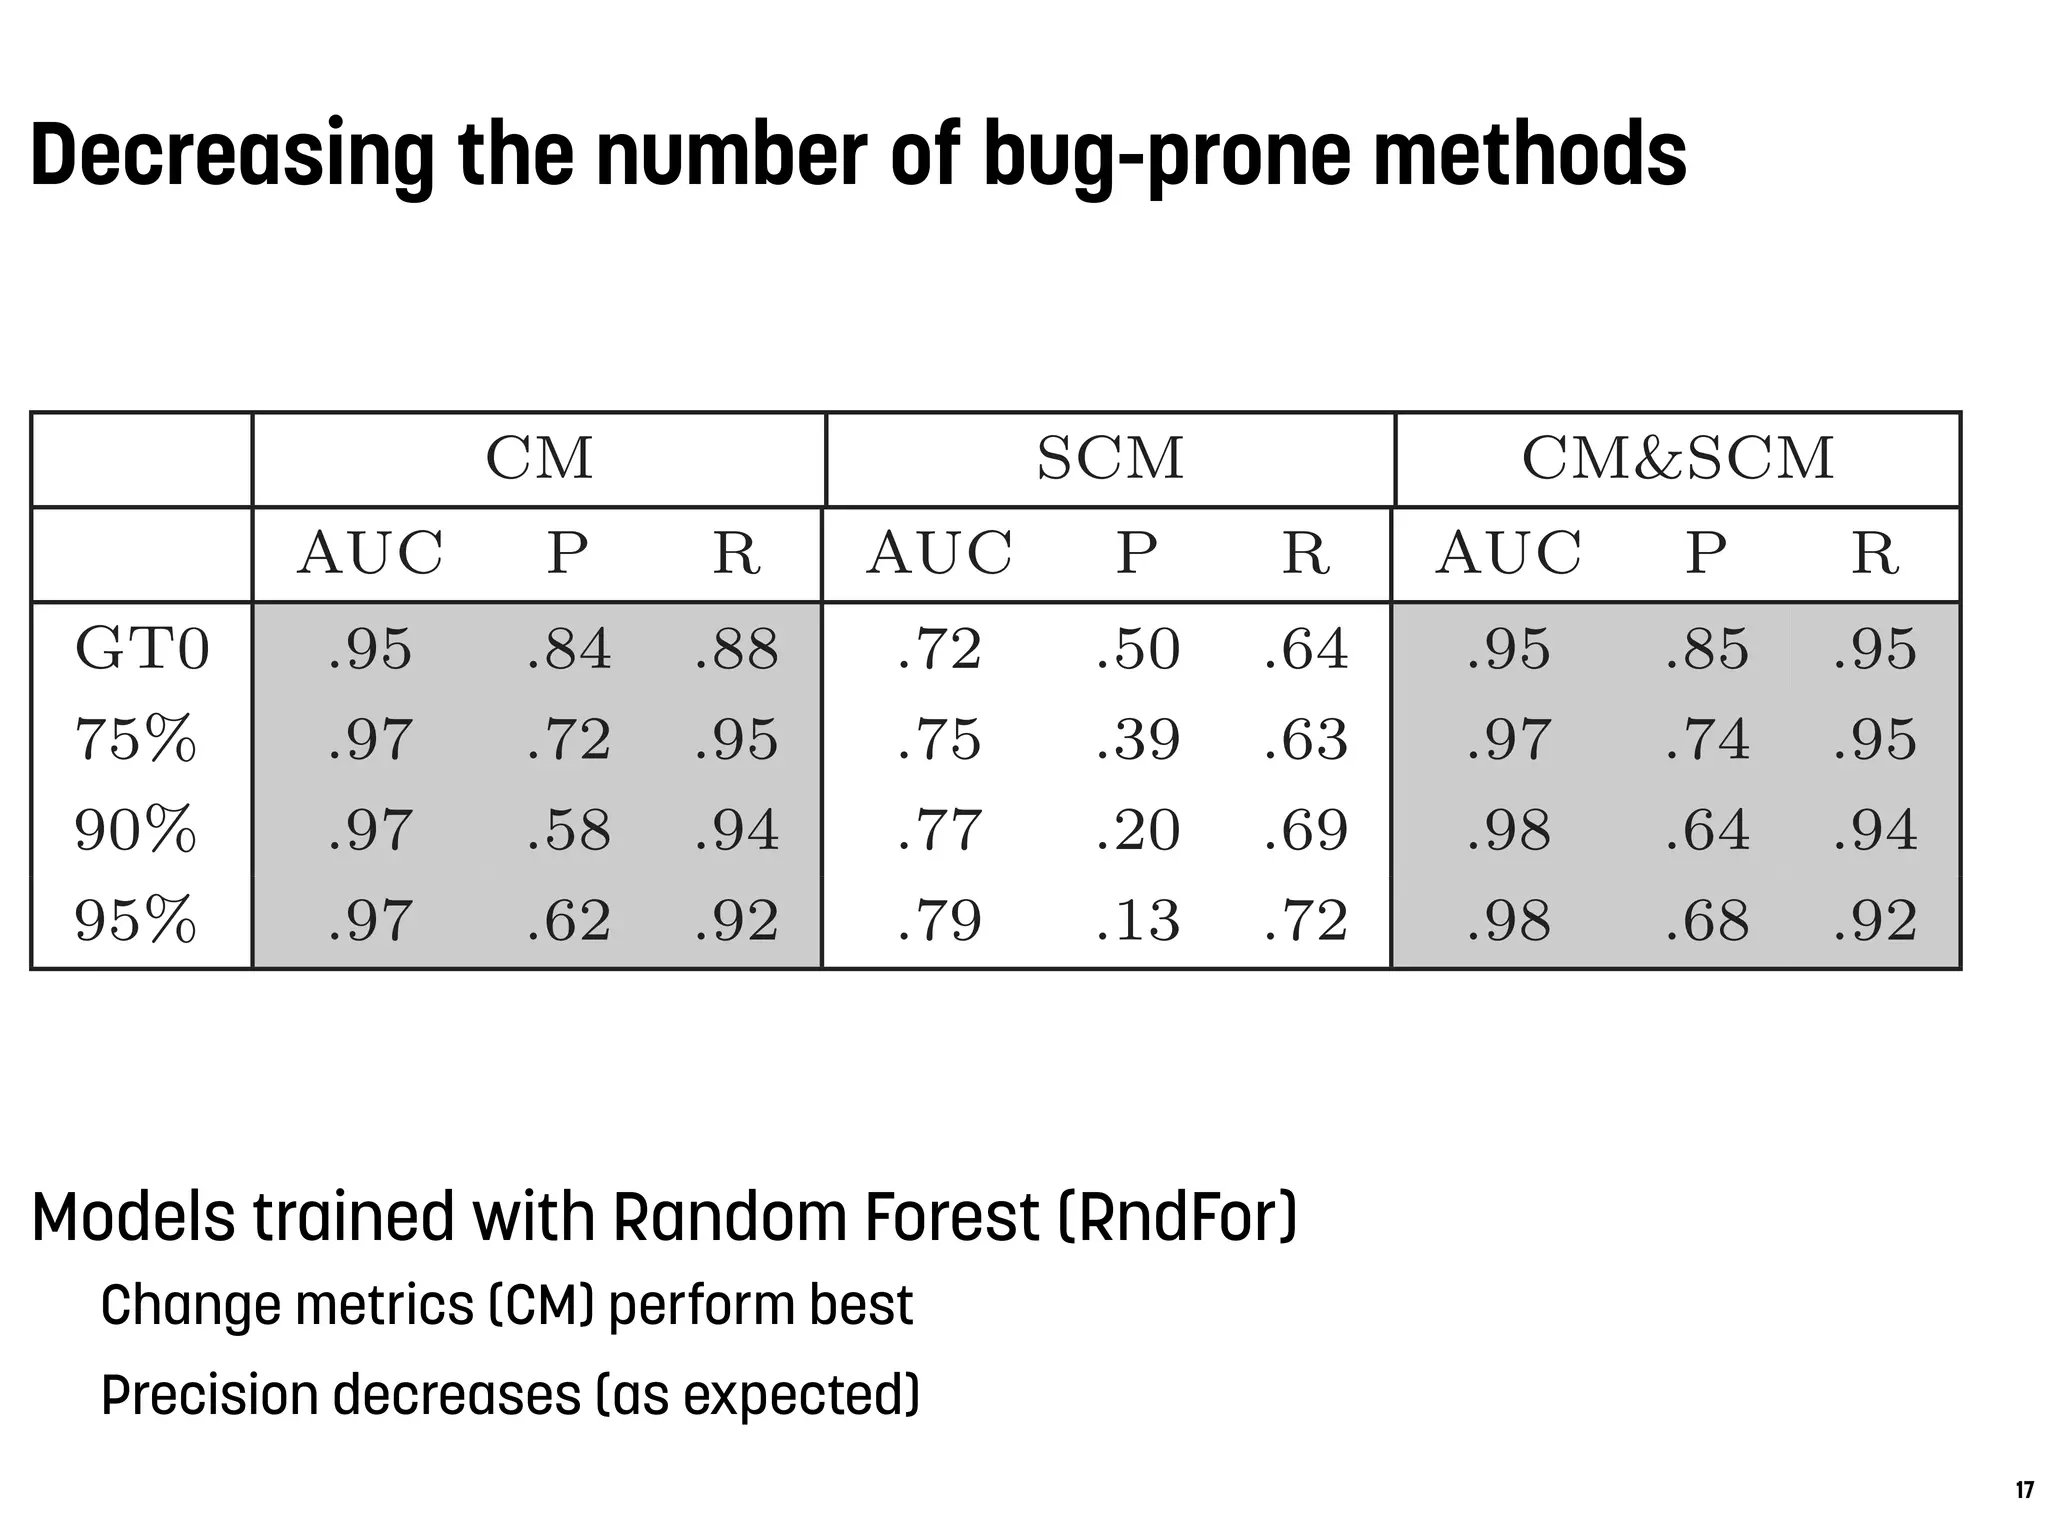
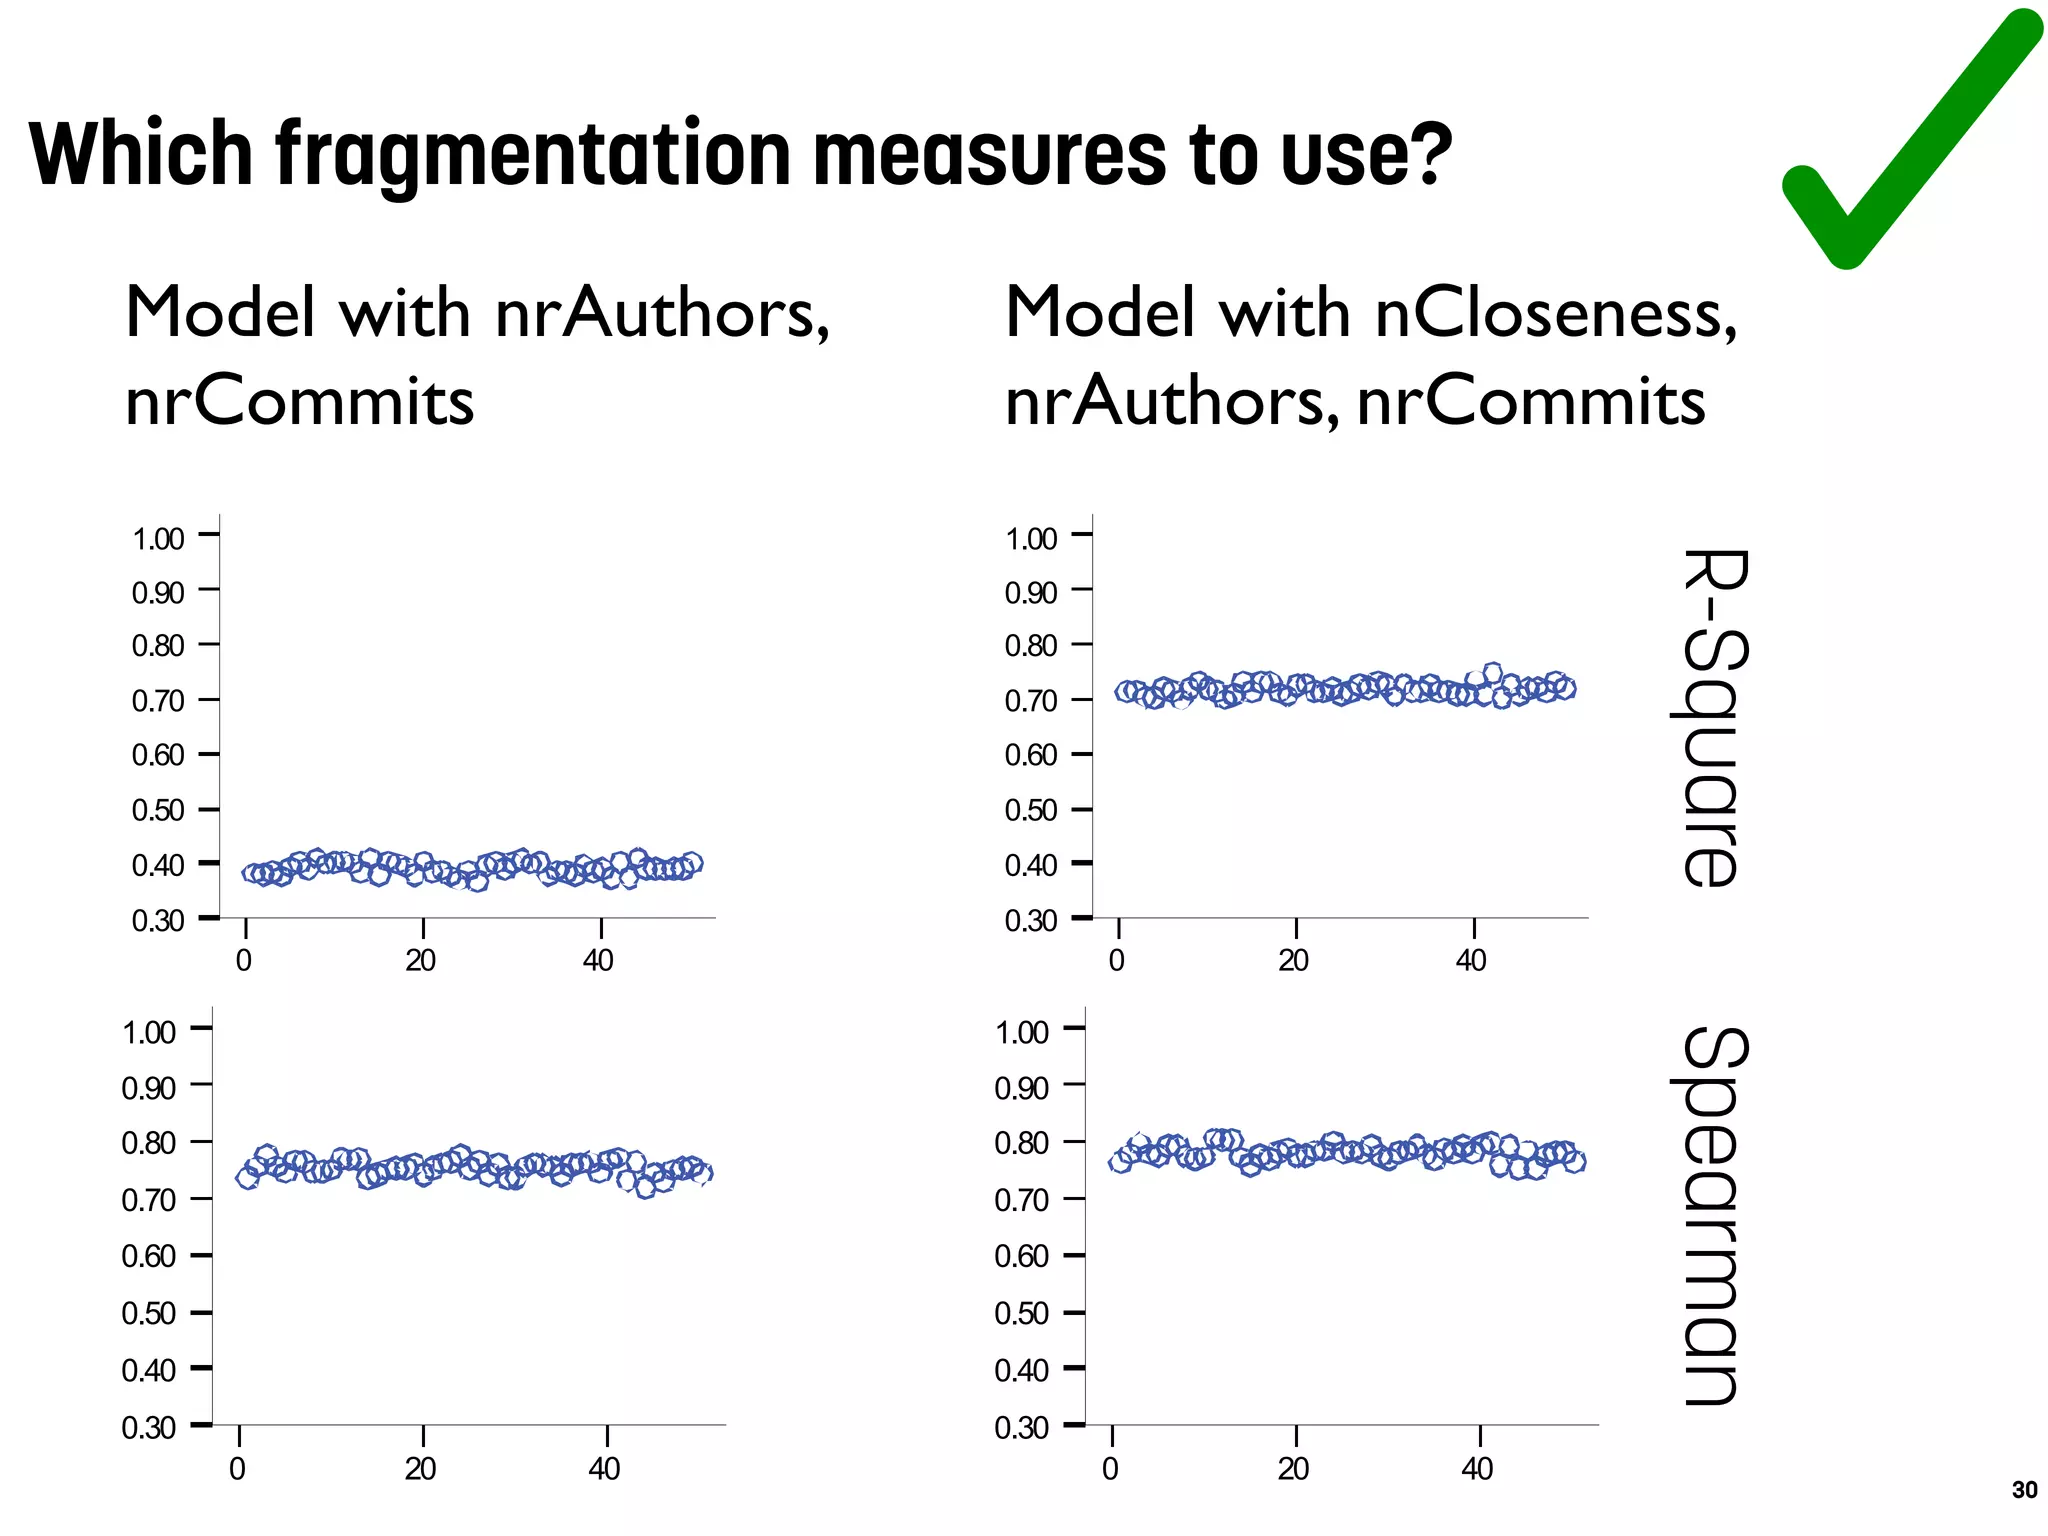
![Models computed with change metrics (CM) perform best
authors and methodHistories are the most important measures
Accuracy of prediction models
15
Table 4: Median classification results over all pro-
jects per classifier and per model
CM SCM CM&SCM
AUC P R AUC P R AUC P R
RndFor .95 .84 .88 .72 .5 .64 .95 .85 .95
SVM .96 .83 .86 .7 .48 .63 .95 .8 .96
BN .96 .82 .86 .73 .46 .73 .96 .81 .96
J48 .95 .84 .82 .69 .56 .58 .91 .83 .89
values of the code metrics model are approximately 0.7 for
each classifier—what is defined by Lessman et al. as ”promis-
ing” [26]. However, the source code metrics suffer from con-
siderably low precision values. The highest median precision](https://image.slidesharecdn.com/antwerpen-ataleofexperimentsonbugprediction-160206091401/75/A-Tale-of-Experiments-on-Bug-Prediction-15-2048.jpg)


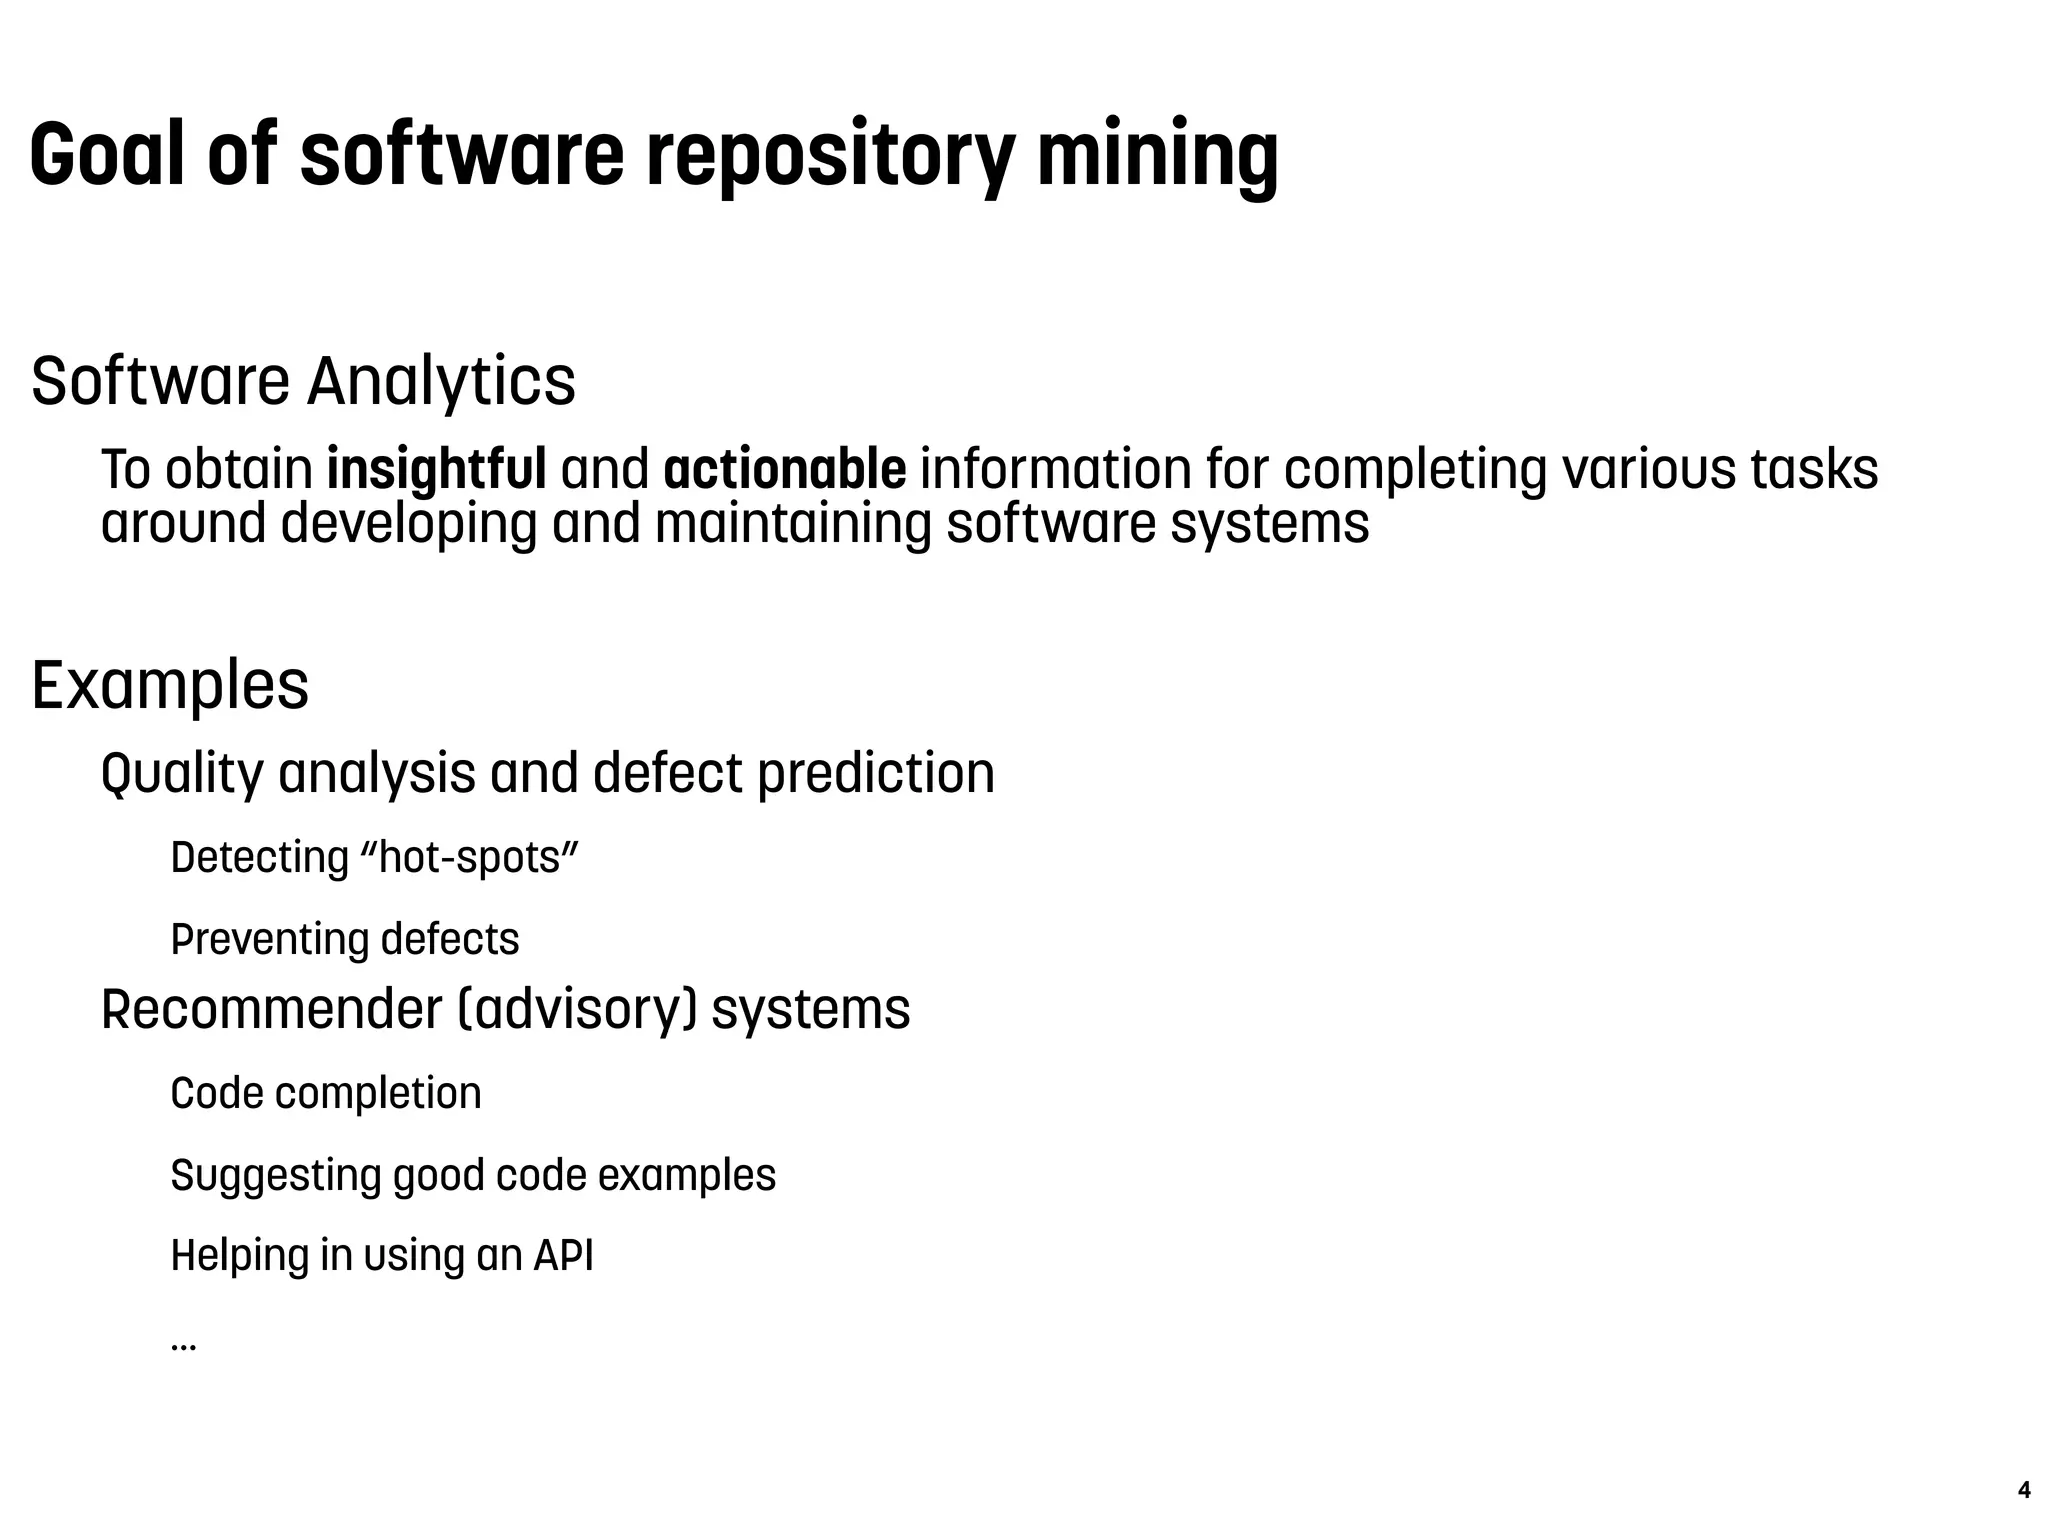
![Conclusions
44
Questions?
Martin Pinzger
martin.pinzger@aau.at
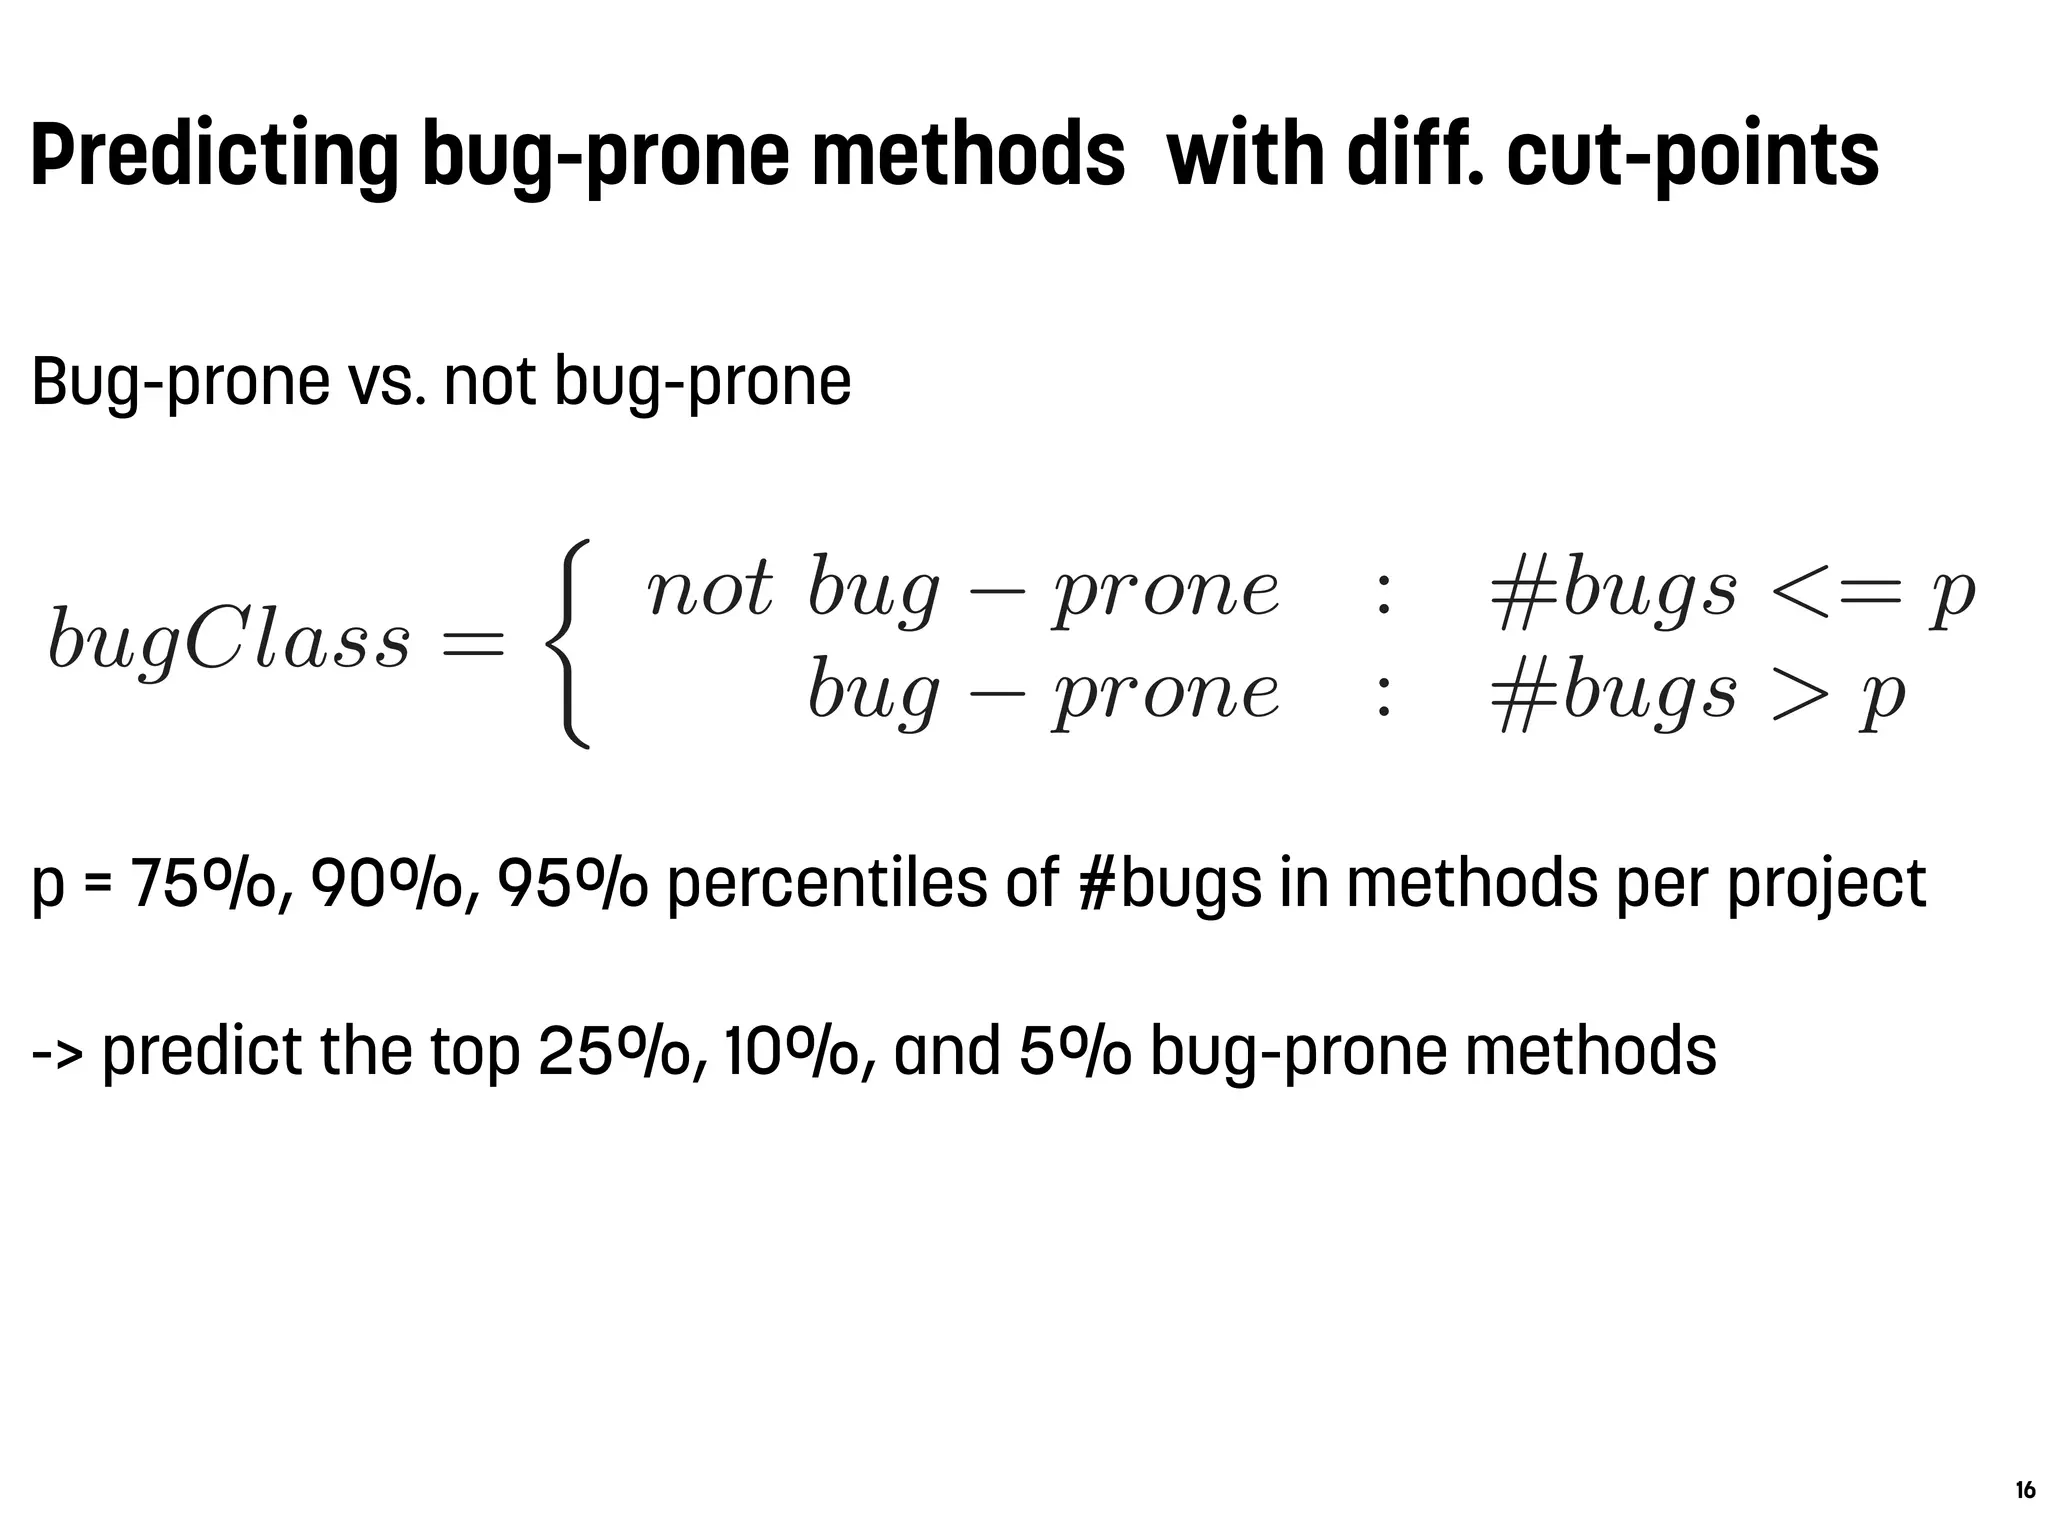
the history of a software system to assemble the dataset for
our experiments: (1) versioning data including lines modi-
fied (LM), (2) bug data, i.e., which files contained bugs and
how many of them (Bugs), and (3) fine-grained source code
changes (SCC).
4. Experiment
2. Bug Data
3. Source Code Changes (SCC)1.Versioning Data
CVS, SVN,
GIT
Evolizer
RHDB
Log Entries
ChangeDistiller
Subsequent
Versions
Changes
#bug123
Message Bug
Support
Vector
Machine
1.1 1.2
AST
Comparison
Figure 1: Stepwise overview of the data extraction process.
1. Versioning Data. We use EVOLIZER [14] to access the ver-
sioning repositories , e.g., CVS, SVN, or GIT. They provide
log entries that contain information about revisions of files
that belong to a system. From the log entries we extract the
revision number (to identify the revisions of a file in correct
temporal order), the revision timestamp, the name of the de-
veloper who checked-in the new revision, and the commit
message. We then compute LM for a source file as the sum of
lines added, lines deleted, and lines changed per file revision.
2. Bug Data. Bug reports are stored in bug repositories such
as Bugzilla. Traditional bug tracking and versioning repos-
Update Core 595 8’496 251’434 36’151 532 Oct0
Debug UI 1’954 18’862 444’061 81’836 3’120 May
JDT Debug UI 775 8’663 168’598 45’645 2’002 Nov
Help 598 3’658 66’743 12’170 243 May
JDT Core 1’705 63’038 2’814K 451’483 6’033 Jun0
OSGI 748 9’866 335’253 56’238 1’411 Nov
single source code statements, e.g., method invocatio
ments, between two versions of a program by com
their respective abstract syntax trees (AST). Each chan
represents a tree edit operation that is required to tr
one version of the AST into the other. The algorithm i
mented in CHANGEDISTILLER [14] that pairwise co
the ASTs between all direct subsequent revisions of e
Based on this information, we then count the numbe
ferent source code changes (SCC) per file revision.
The preprocessed data from step 1-3 is stored into
lease History Database (RHDB) [10]. From that data,
compute LM, SCC, and Bugs for each source file by a
ing the values over the given observation period.
3. EMPIRICAL STUDY
In this section, we present the empirical study that
formed to investigate the hypotheses stated in Sectio
discuss the dataset, the statistical methods and machi
ing algorithms we used, and report on the results a
ings of the experiments.
3.1 Dataset and Data Preparation
We performed our experiments on 15 plugins of the
platform. Eclipse is a popular open source system
been studied extensively before [4,27,38,39].
Table 1 gives an overview of the Eclipse dataset
this study with the number of unique *.java files (Fi
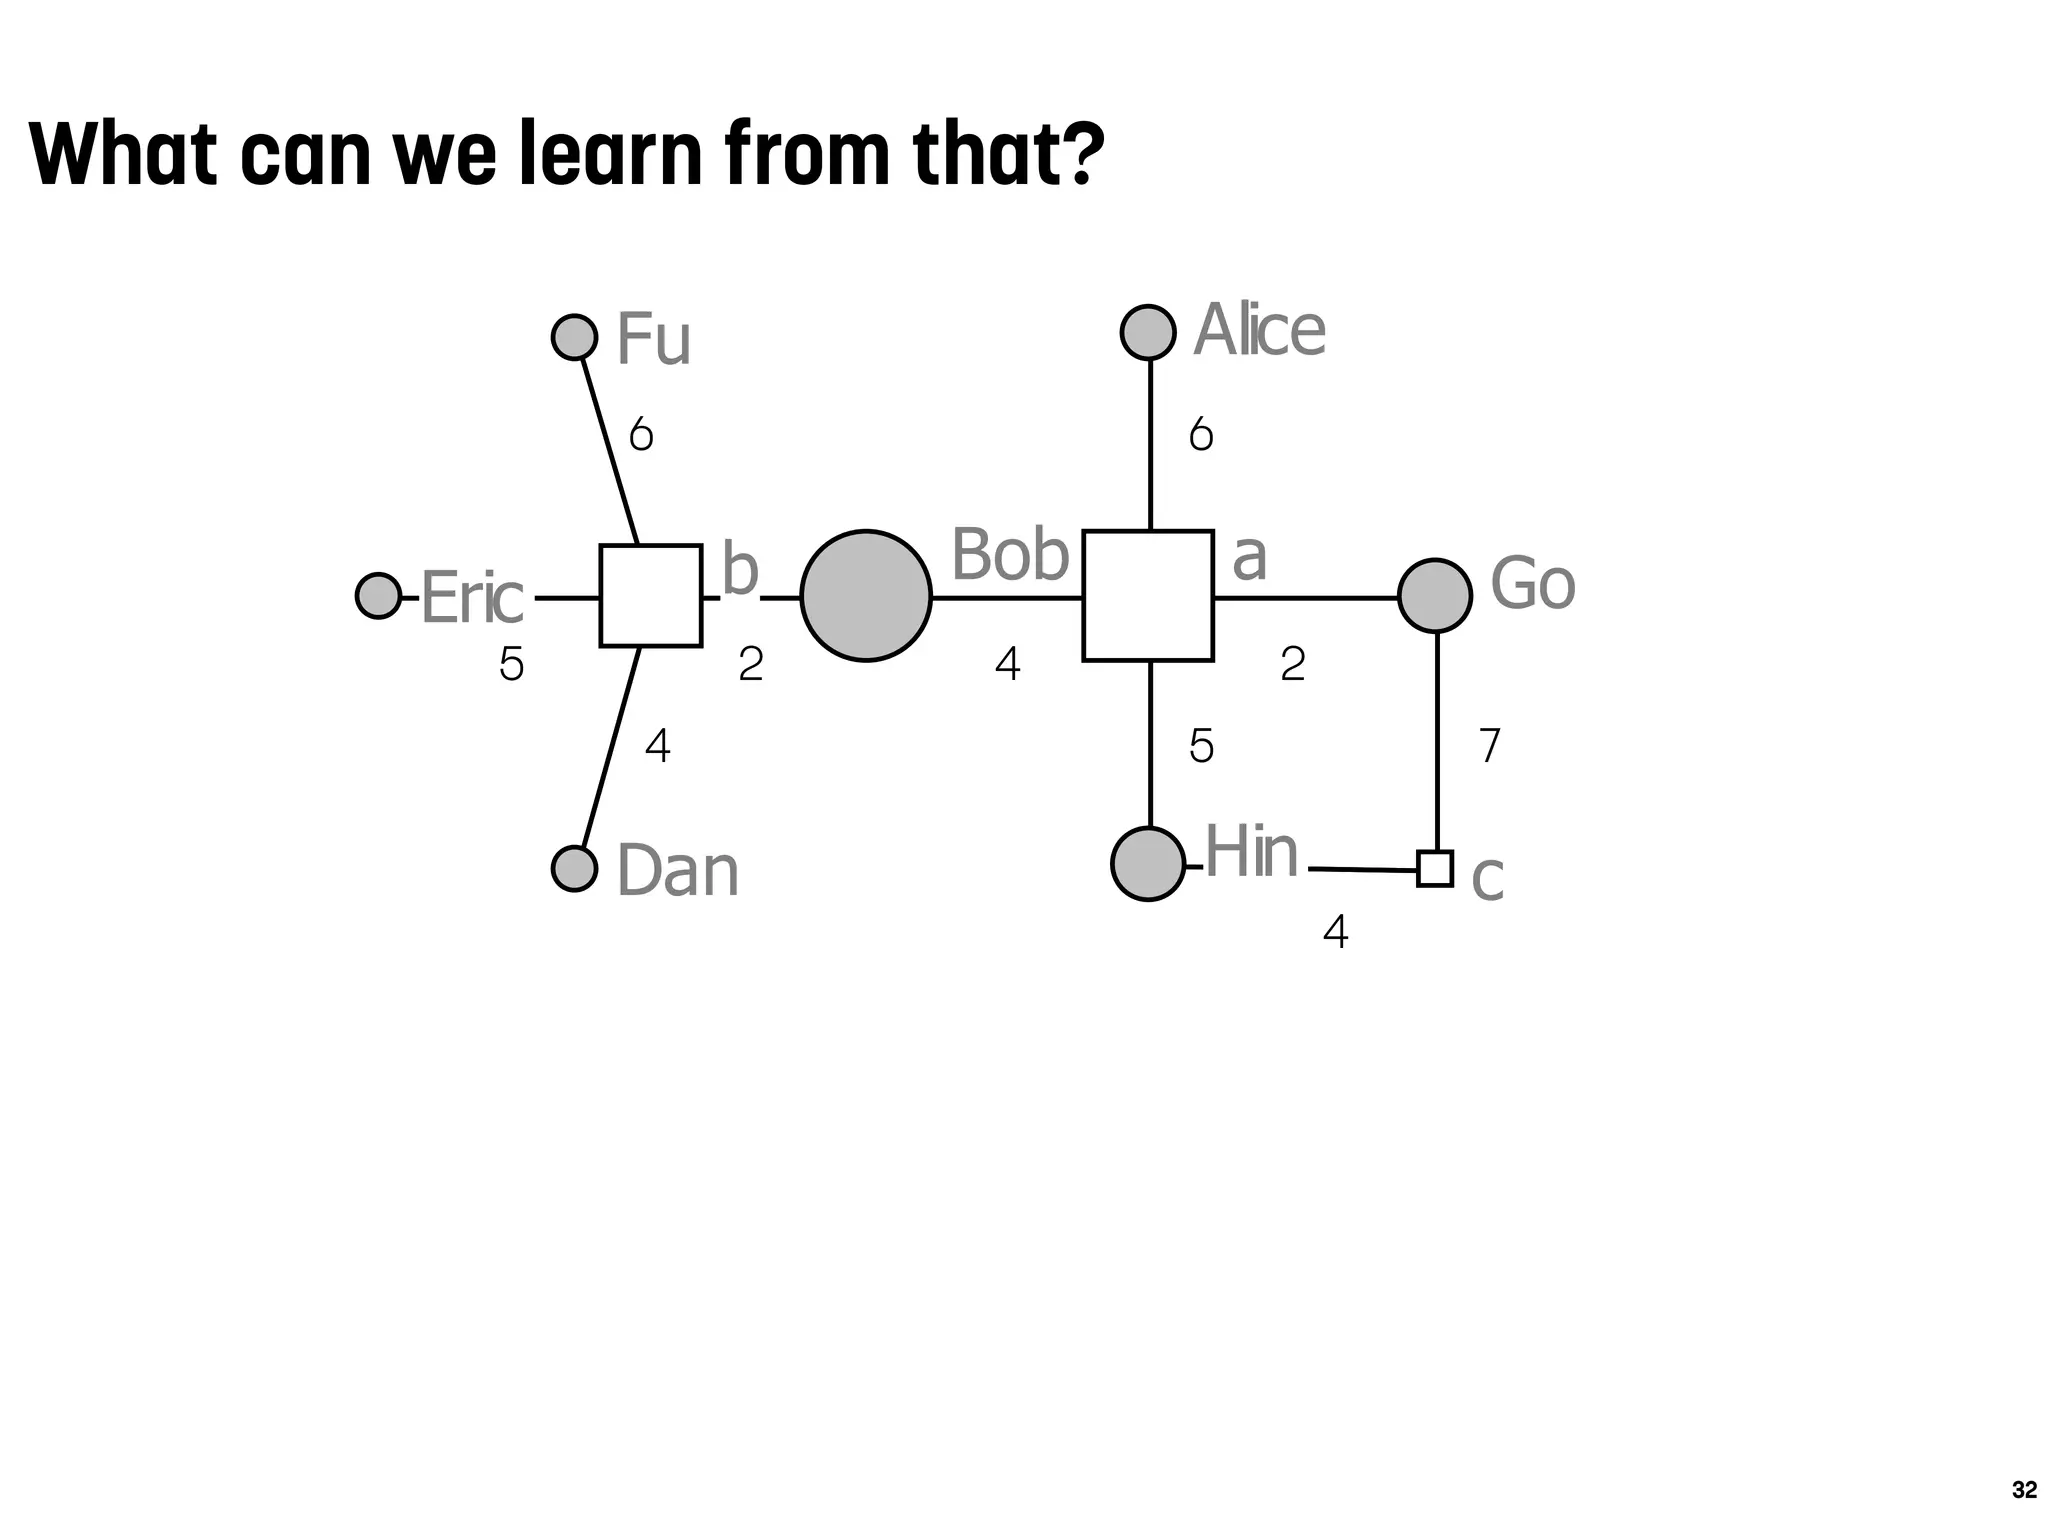
Alice
Bob
Dan
Eric
Fu
Go
Hin
ab
c
5
4
6
2 4
6
2
5 7
4
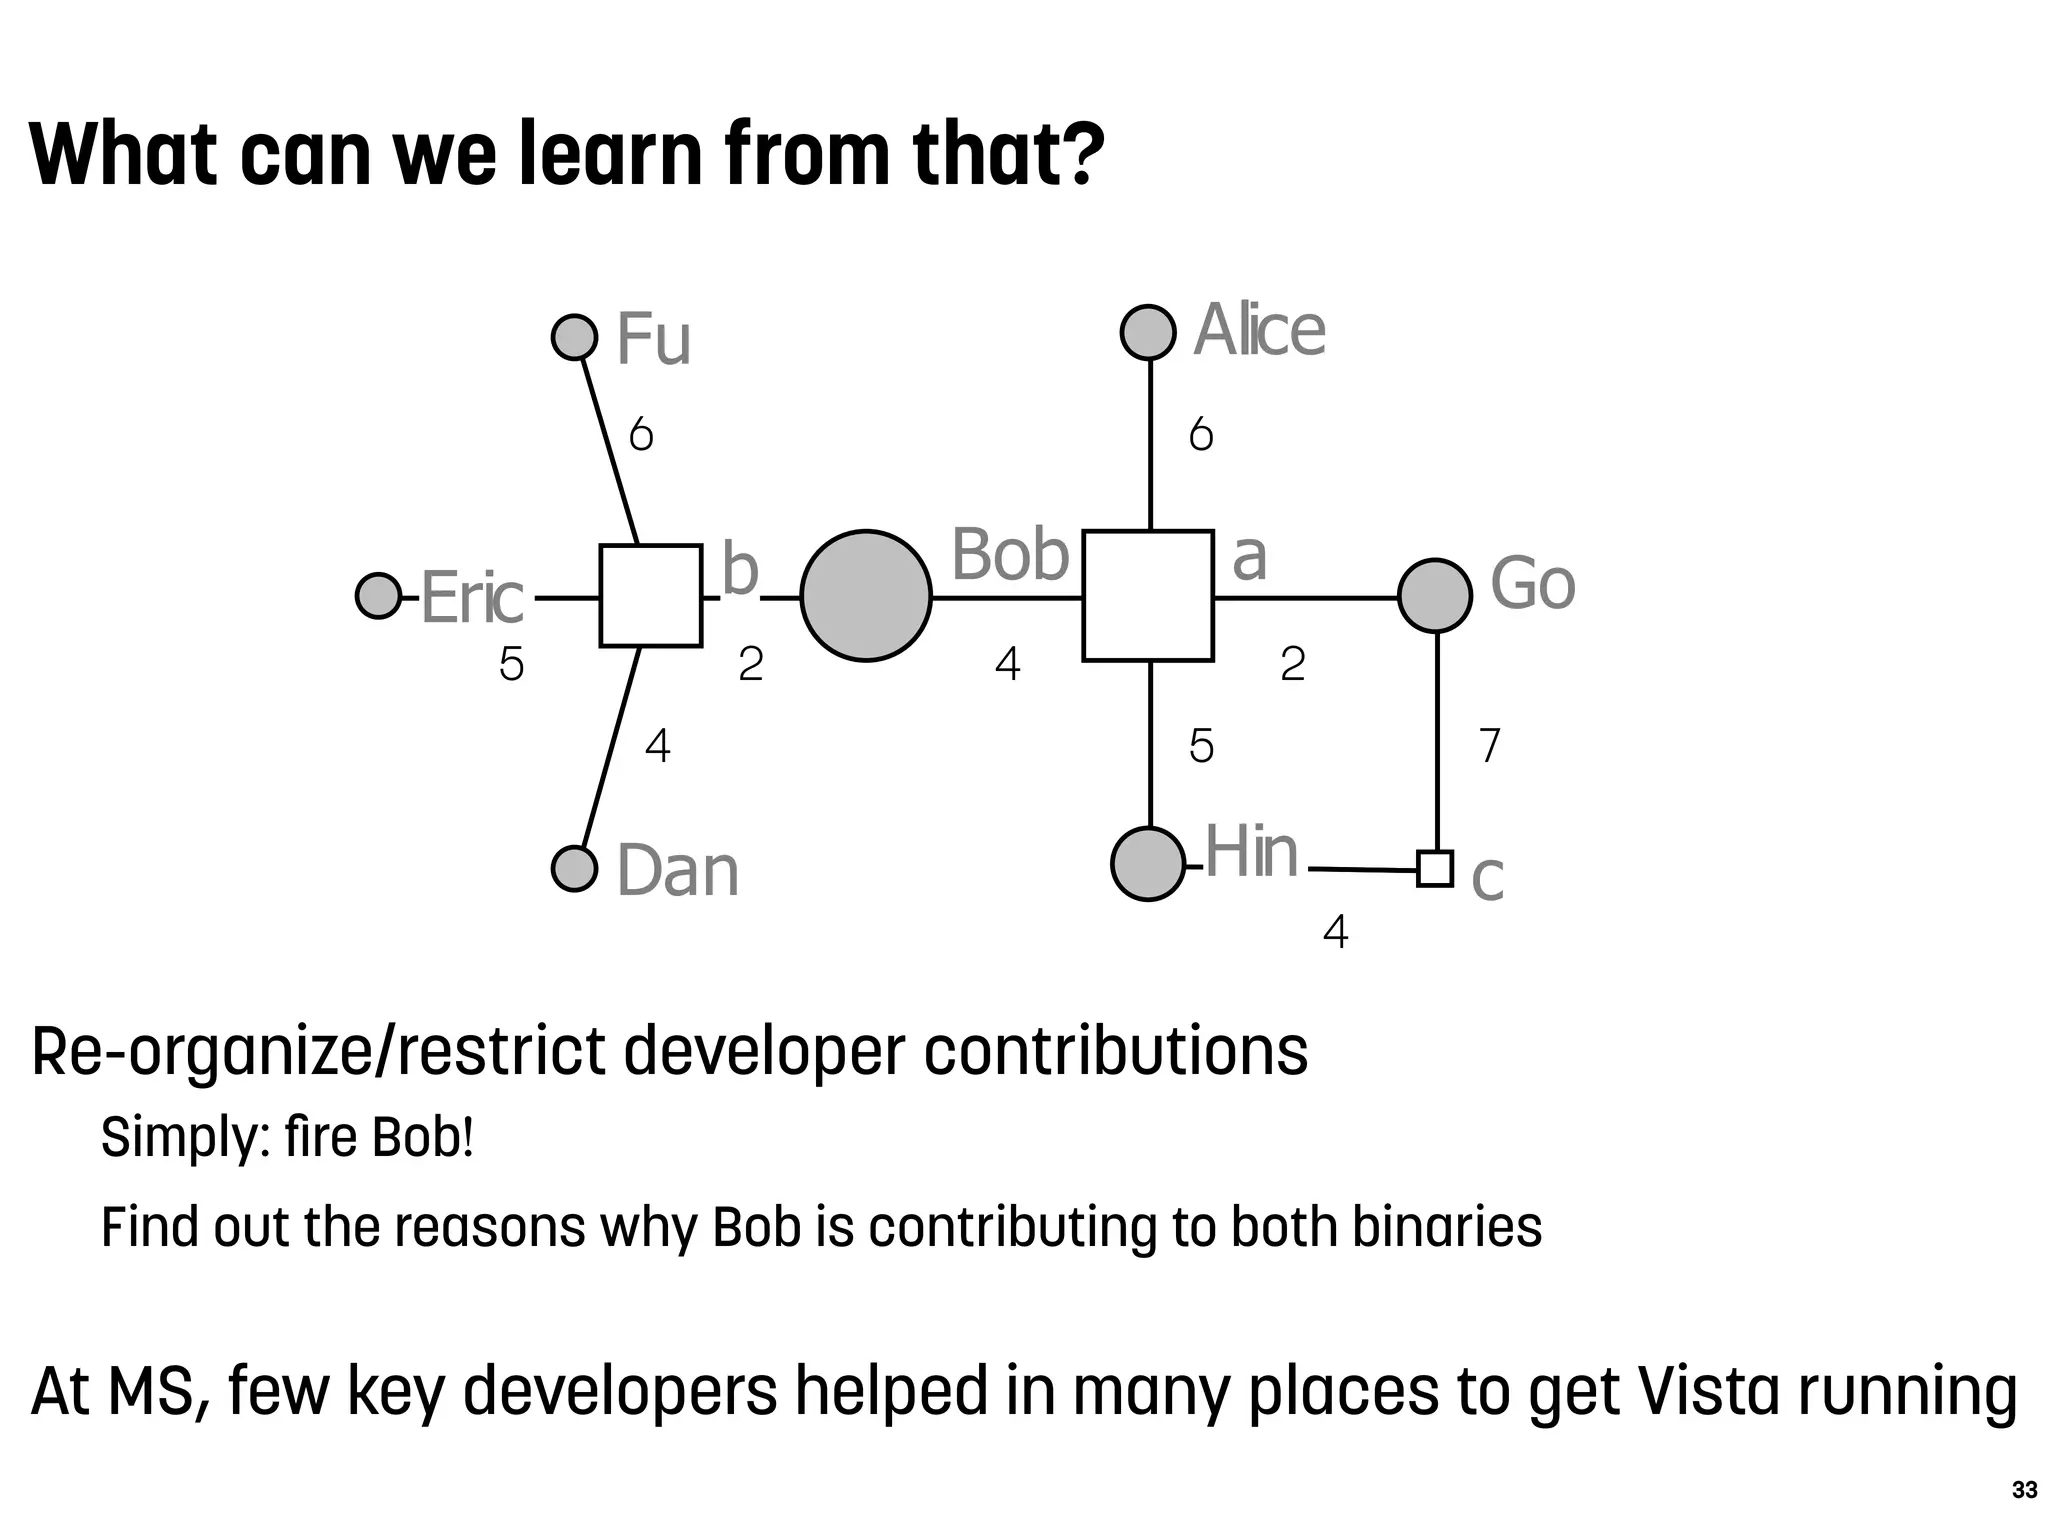
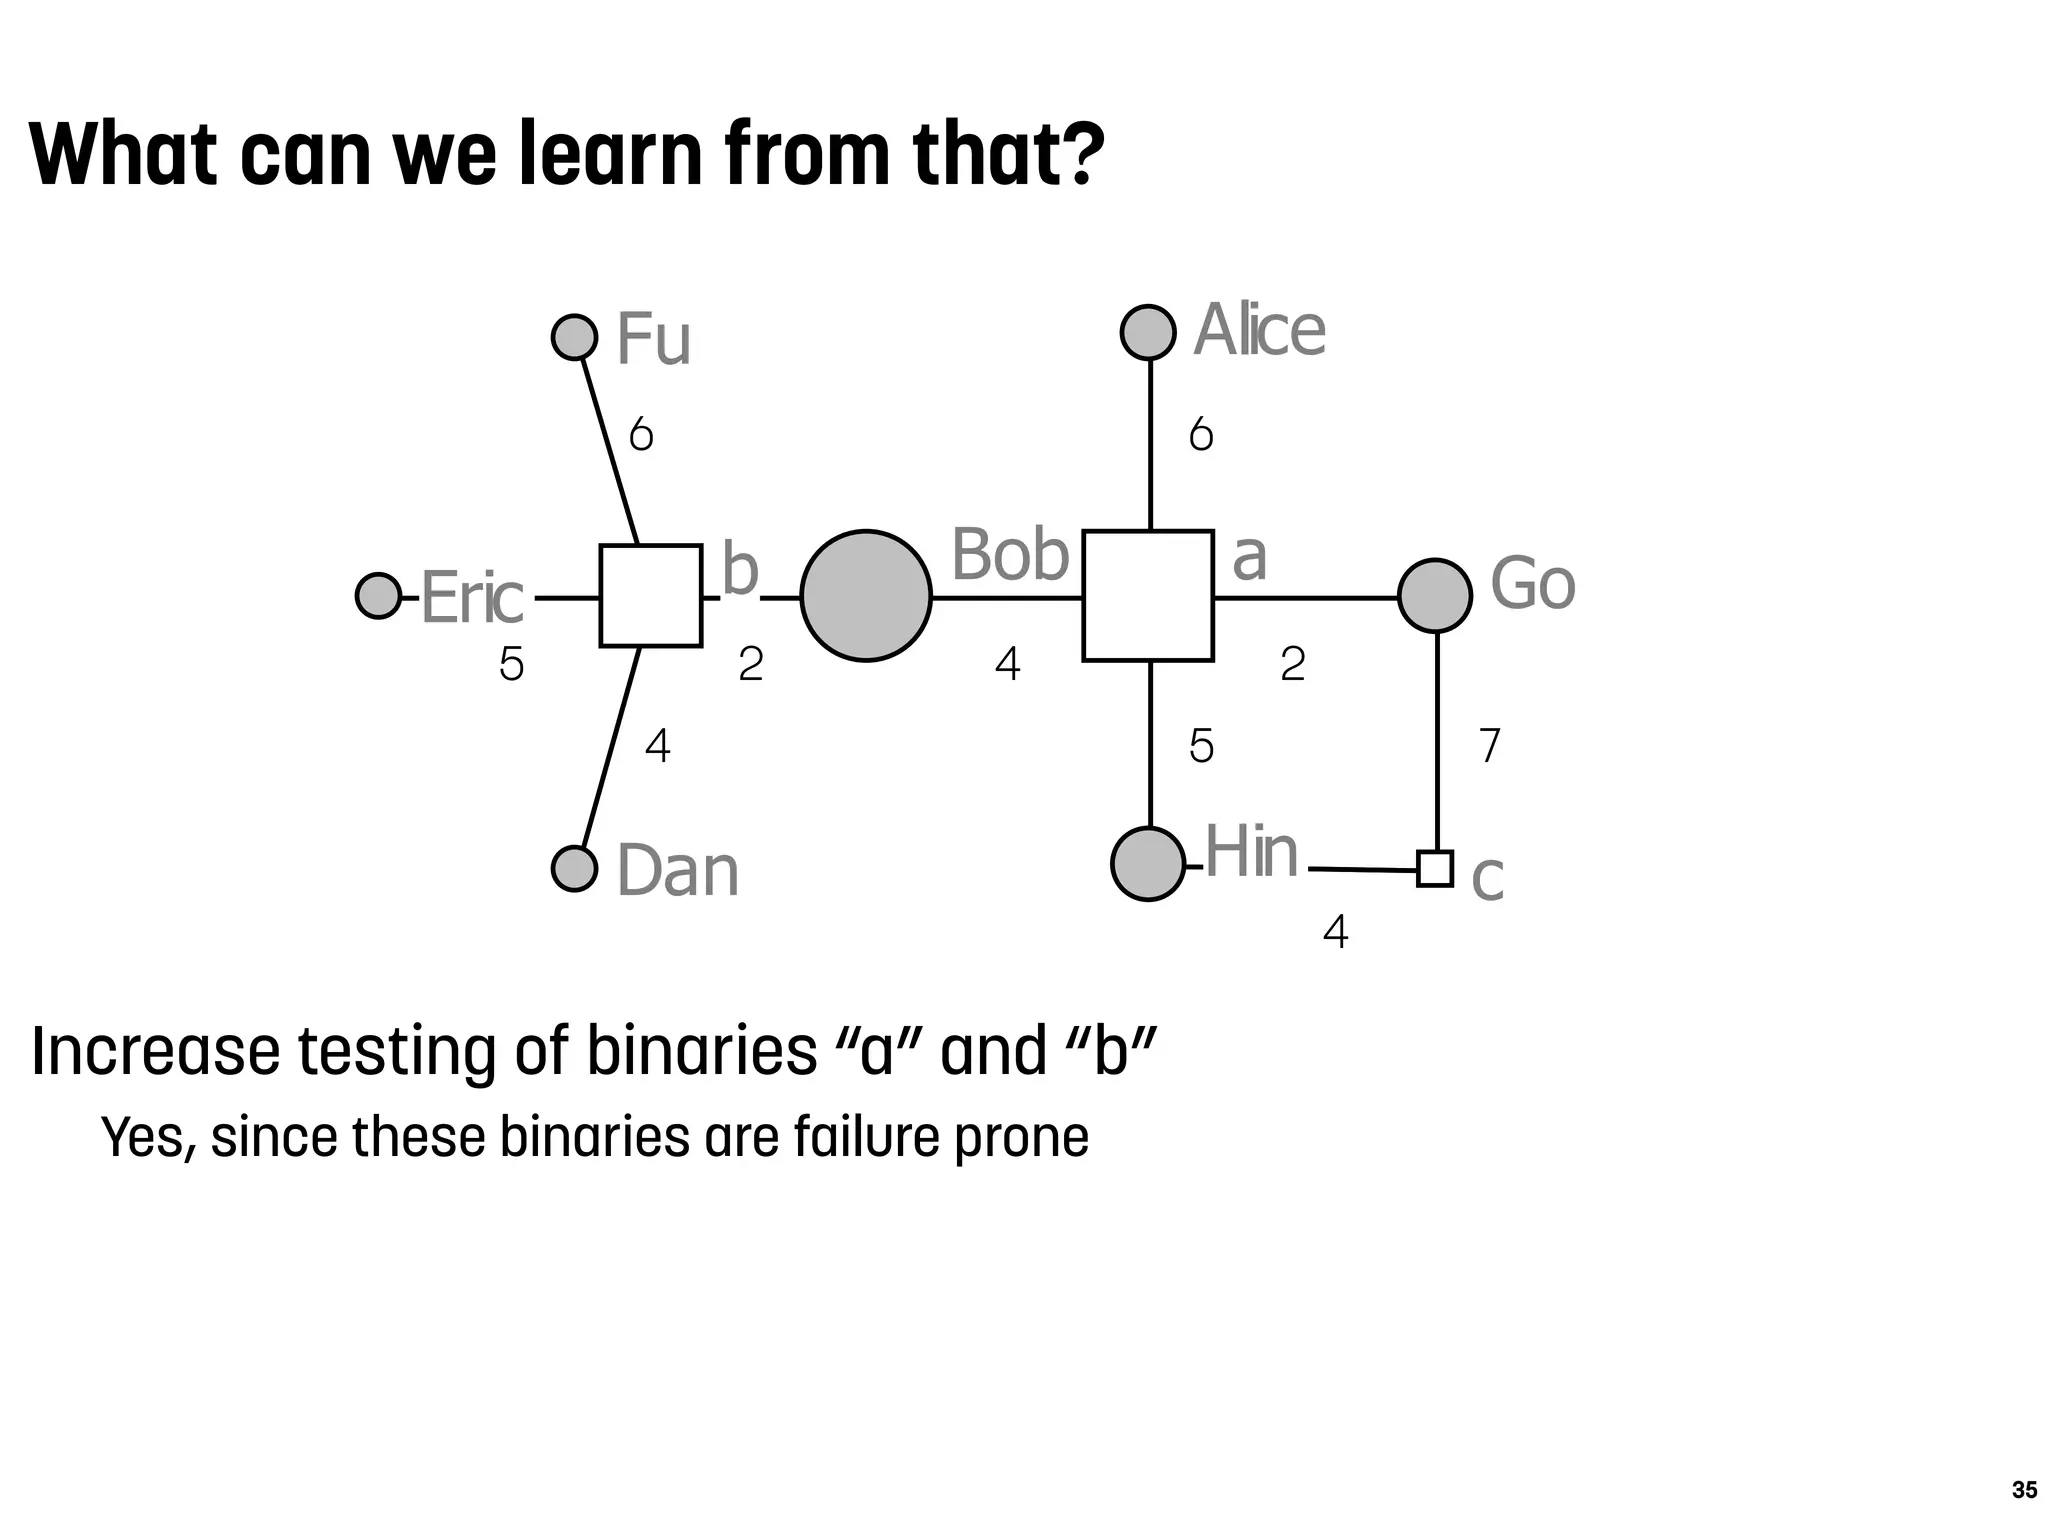
Academia wants/needs/must
collaborate with industry
Industry should invest in such
a collaboration](https://image.slidesharecdn.com/antwerpen-ataleofexperimentsonbugprediction-160206091401/75/A-Tale-of-Experiments-on-Bug-Prediction-44-2048.jpg)


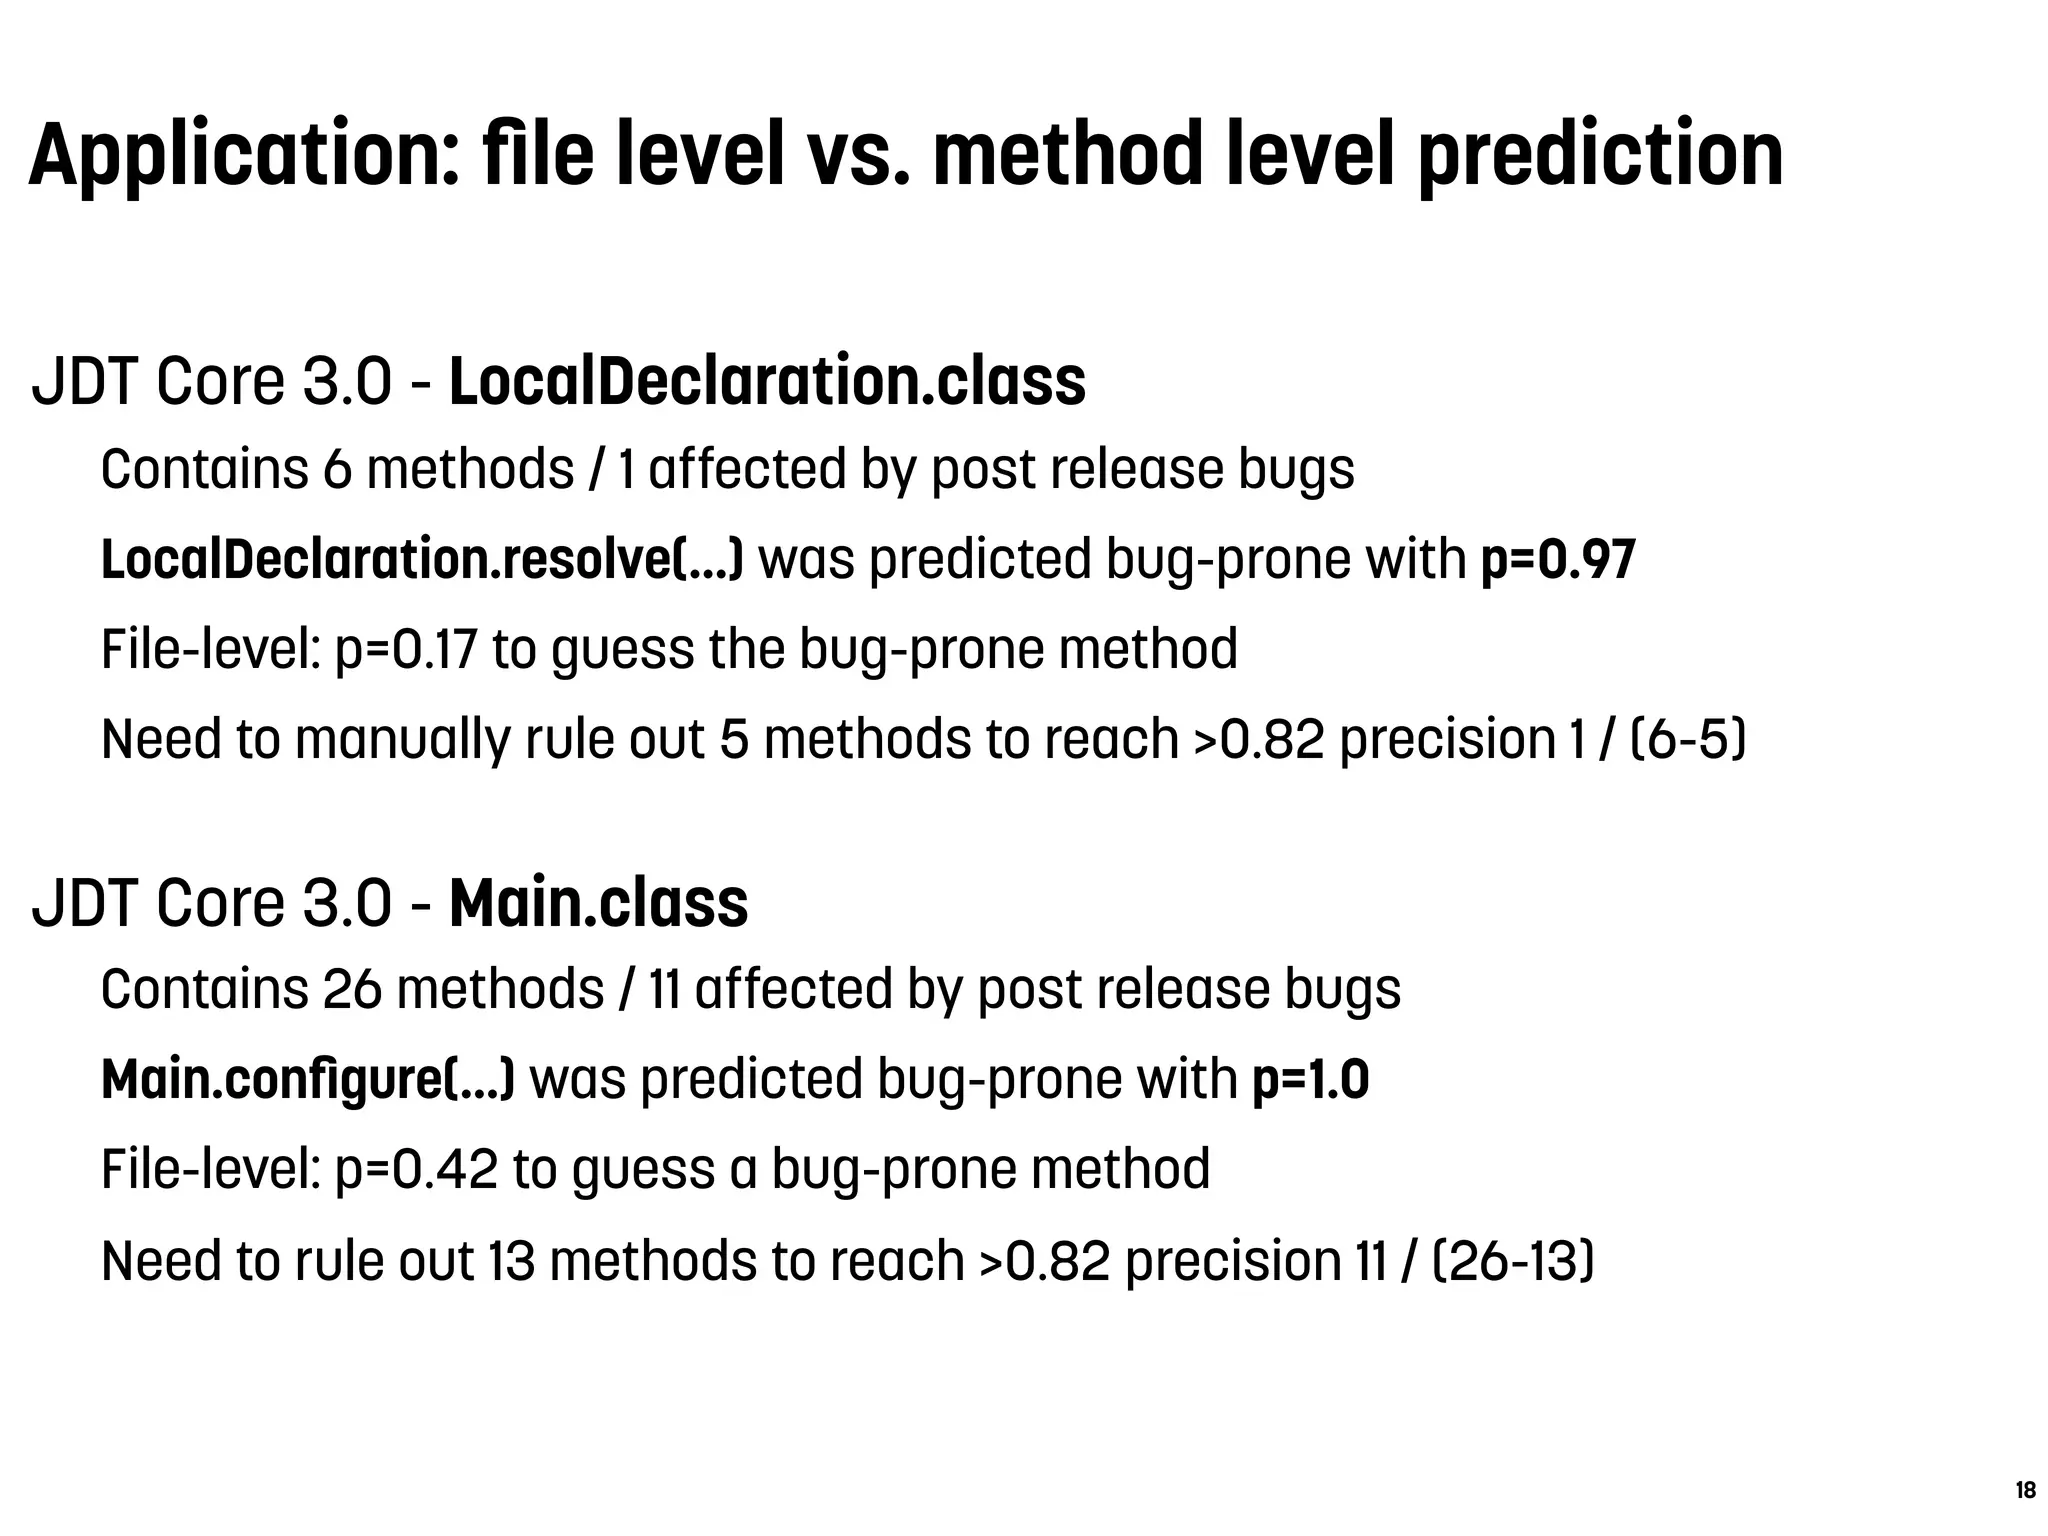
This document summarizes Martin Pinzger's research on predicting buggy methods using software repository mining. The key points are: 1. Pinzger and colleagues conducted experiments on 21 Java projects to predict buggy methods using source code and change metrics. Change metrics like authors and method histories performed best with up to 96% accuracy. 2. Predicting buggy methods at a finer granularity than files can save manual inspection and testing effort. Accuracy decreases as fewer methods are predicted but change metrics maintain higher precision. 3. Case studies on two classes show that method-level prediction achieves over 82% precision compared to only 17-42% at the file level. This demonstrates the benefit of finer-