Download as PDF, PPTX
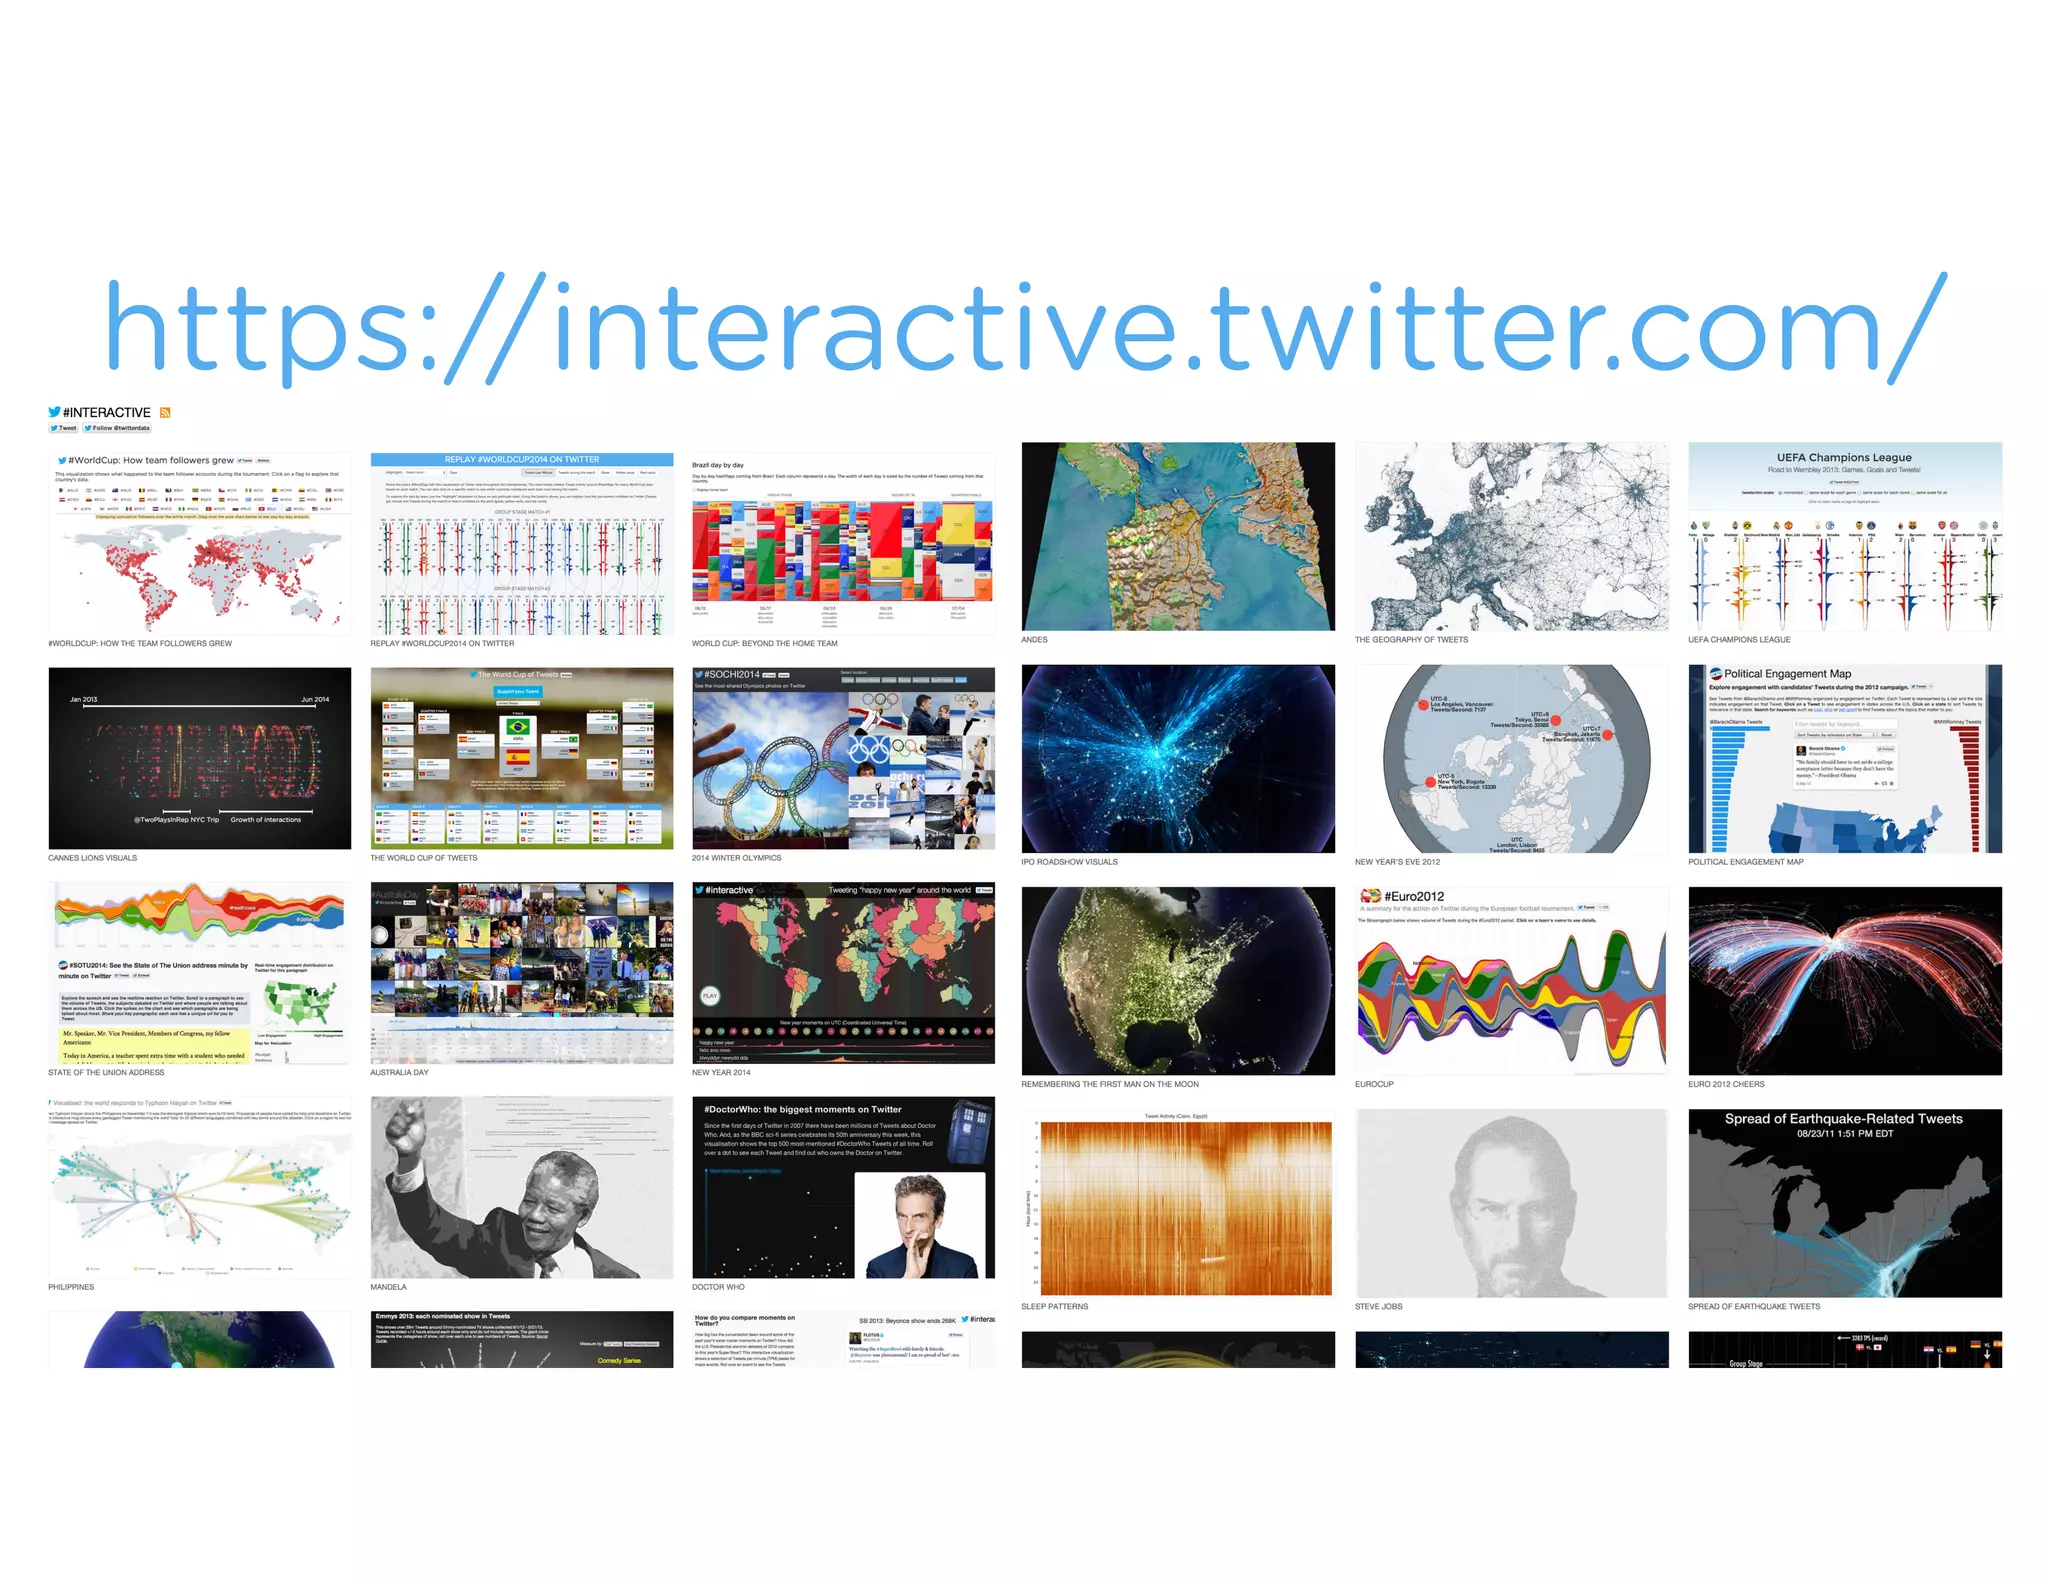
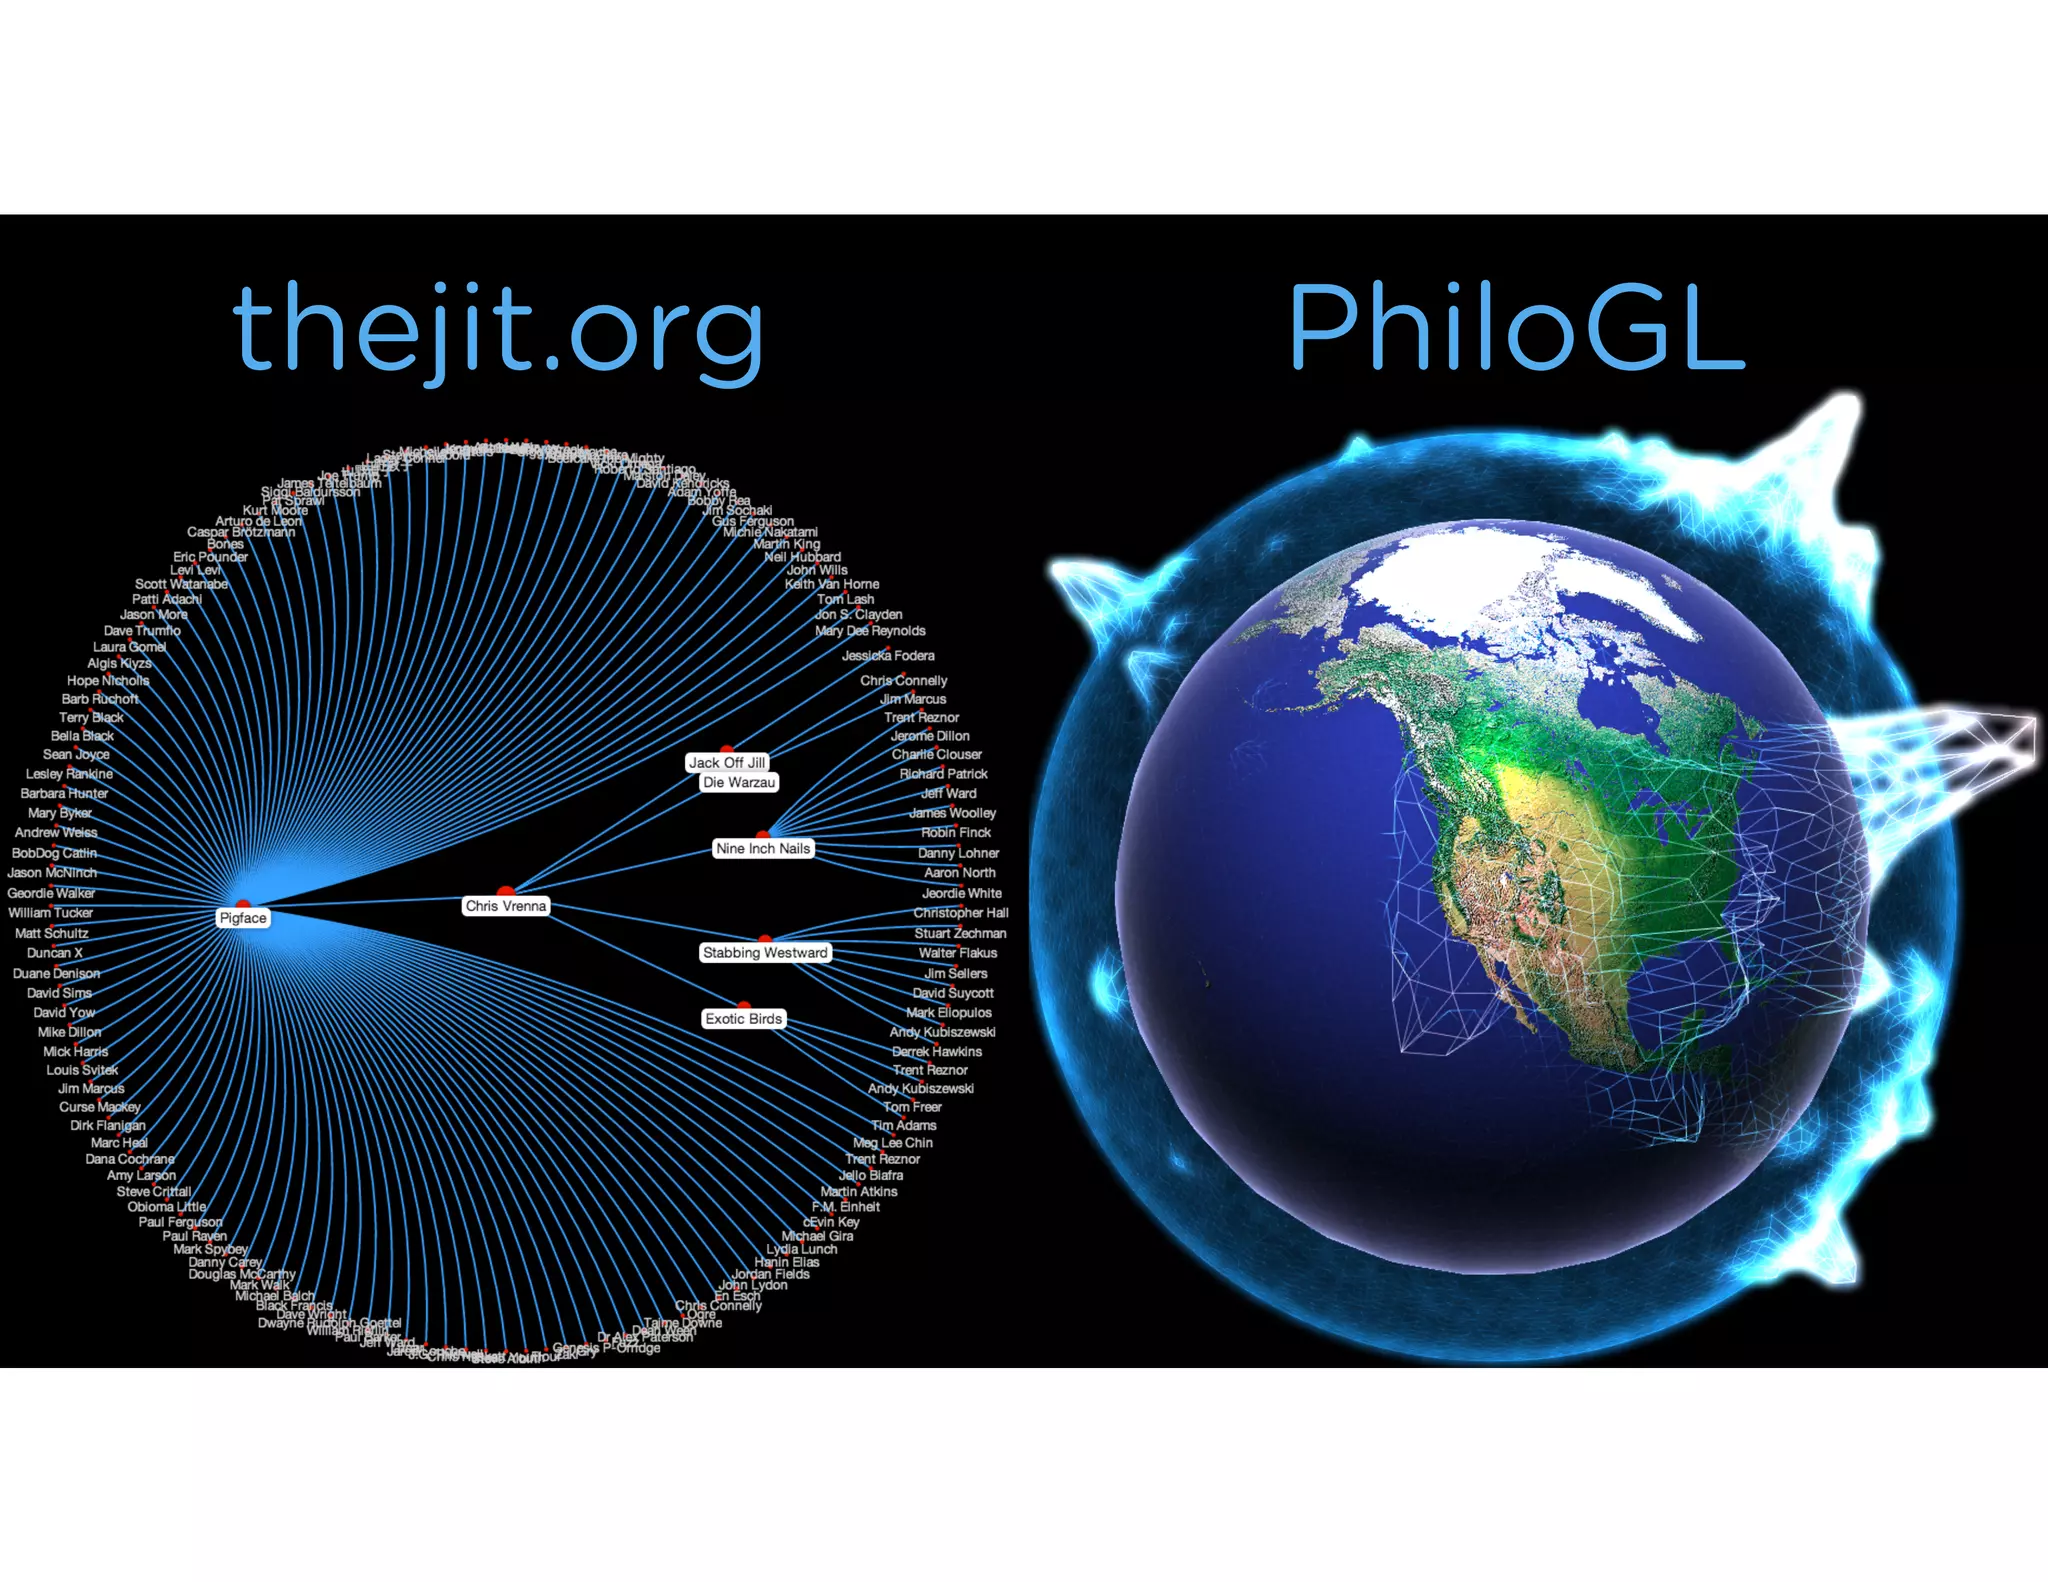
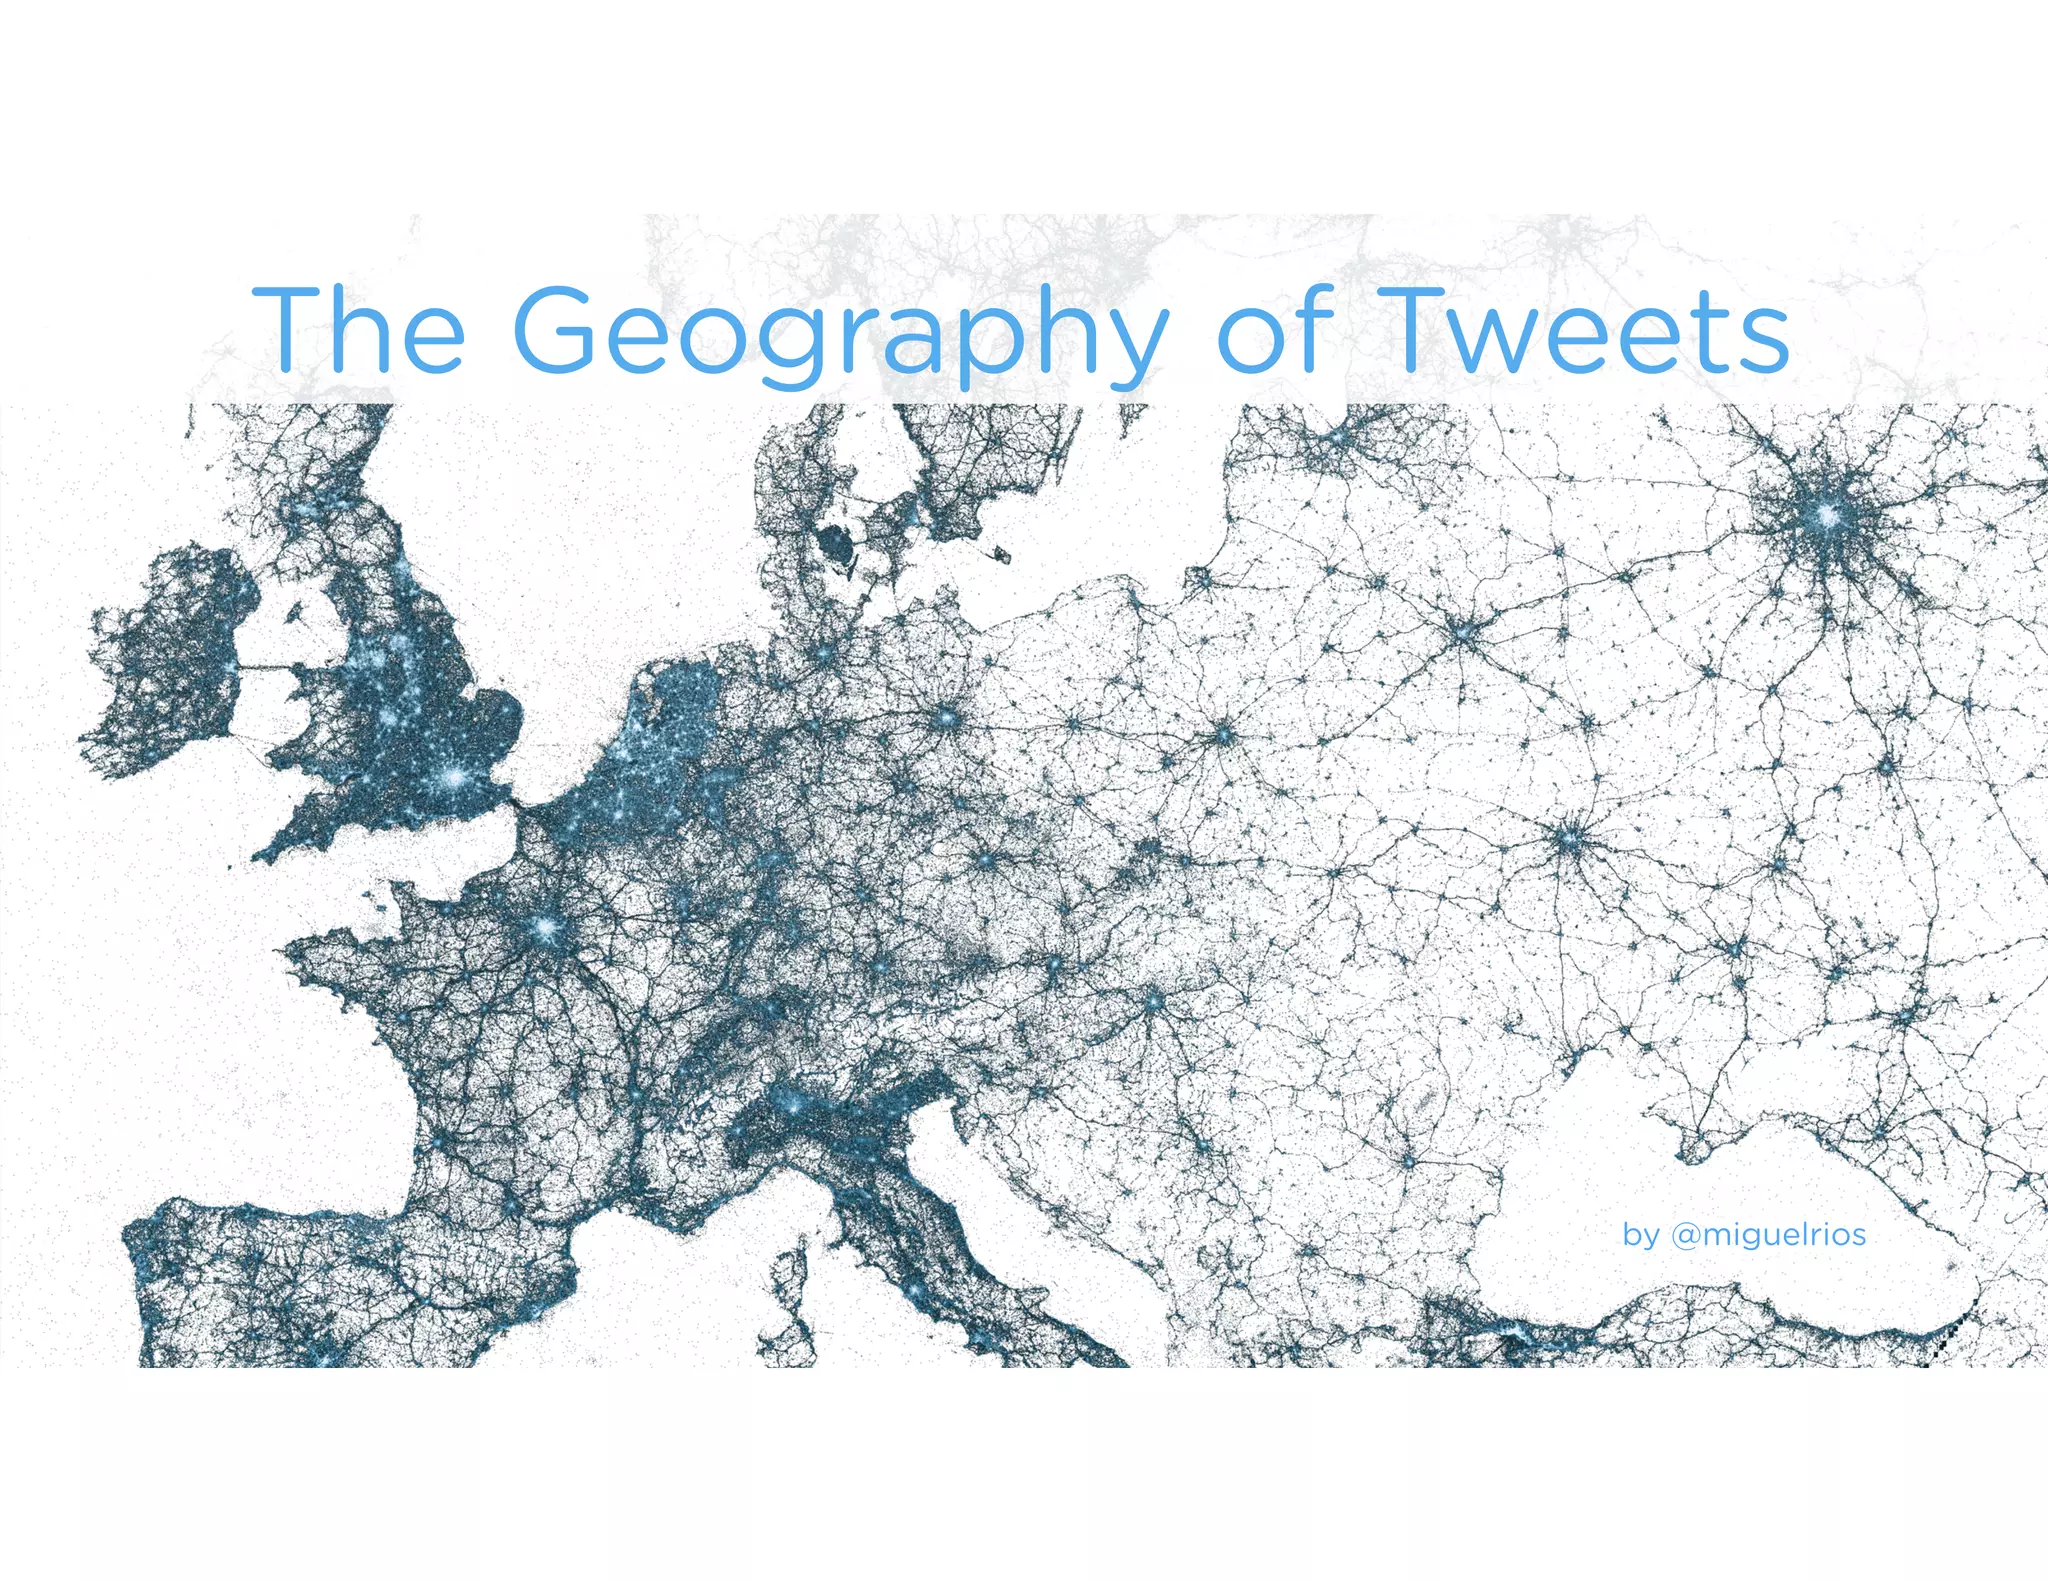
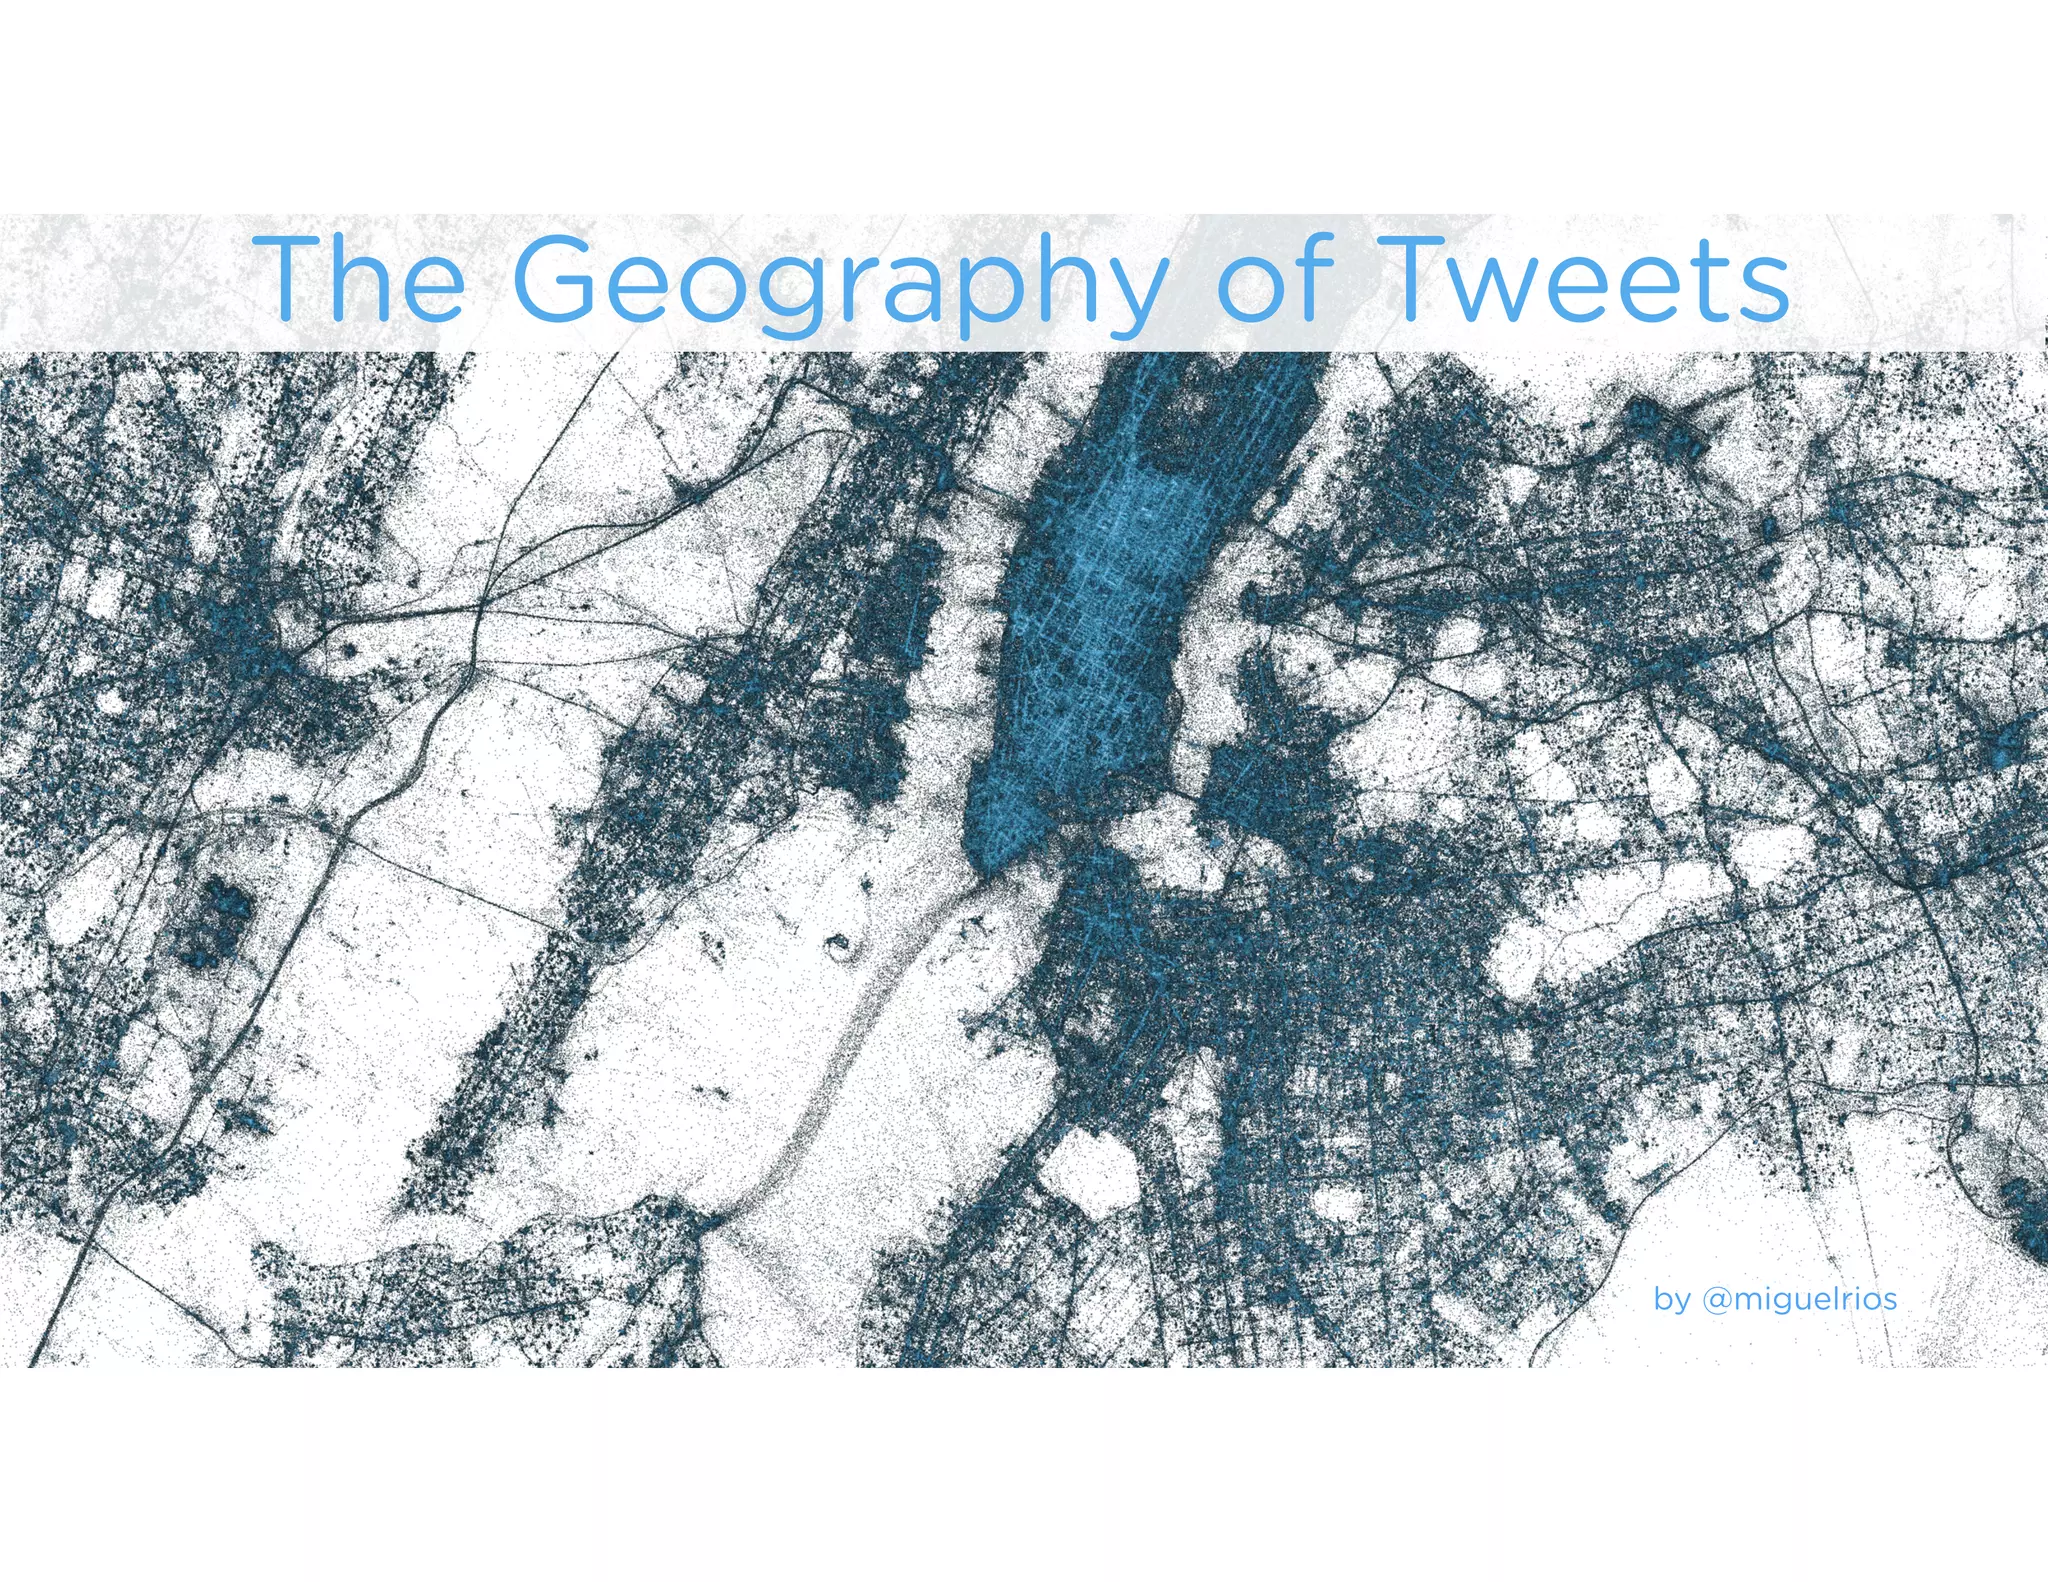
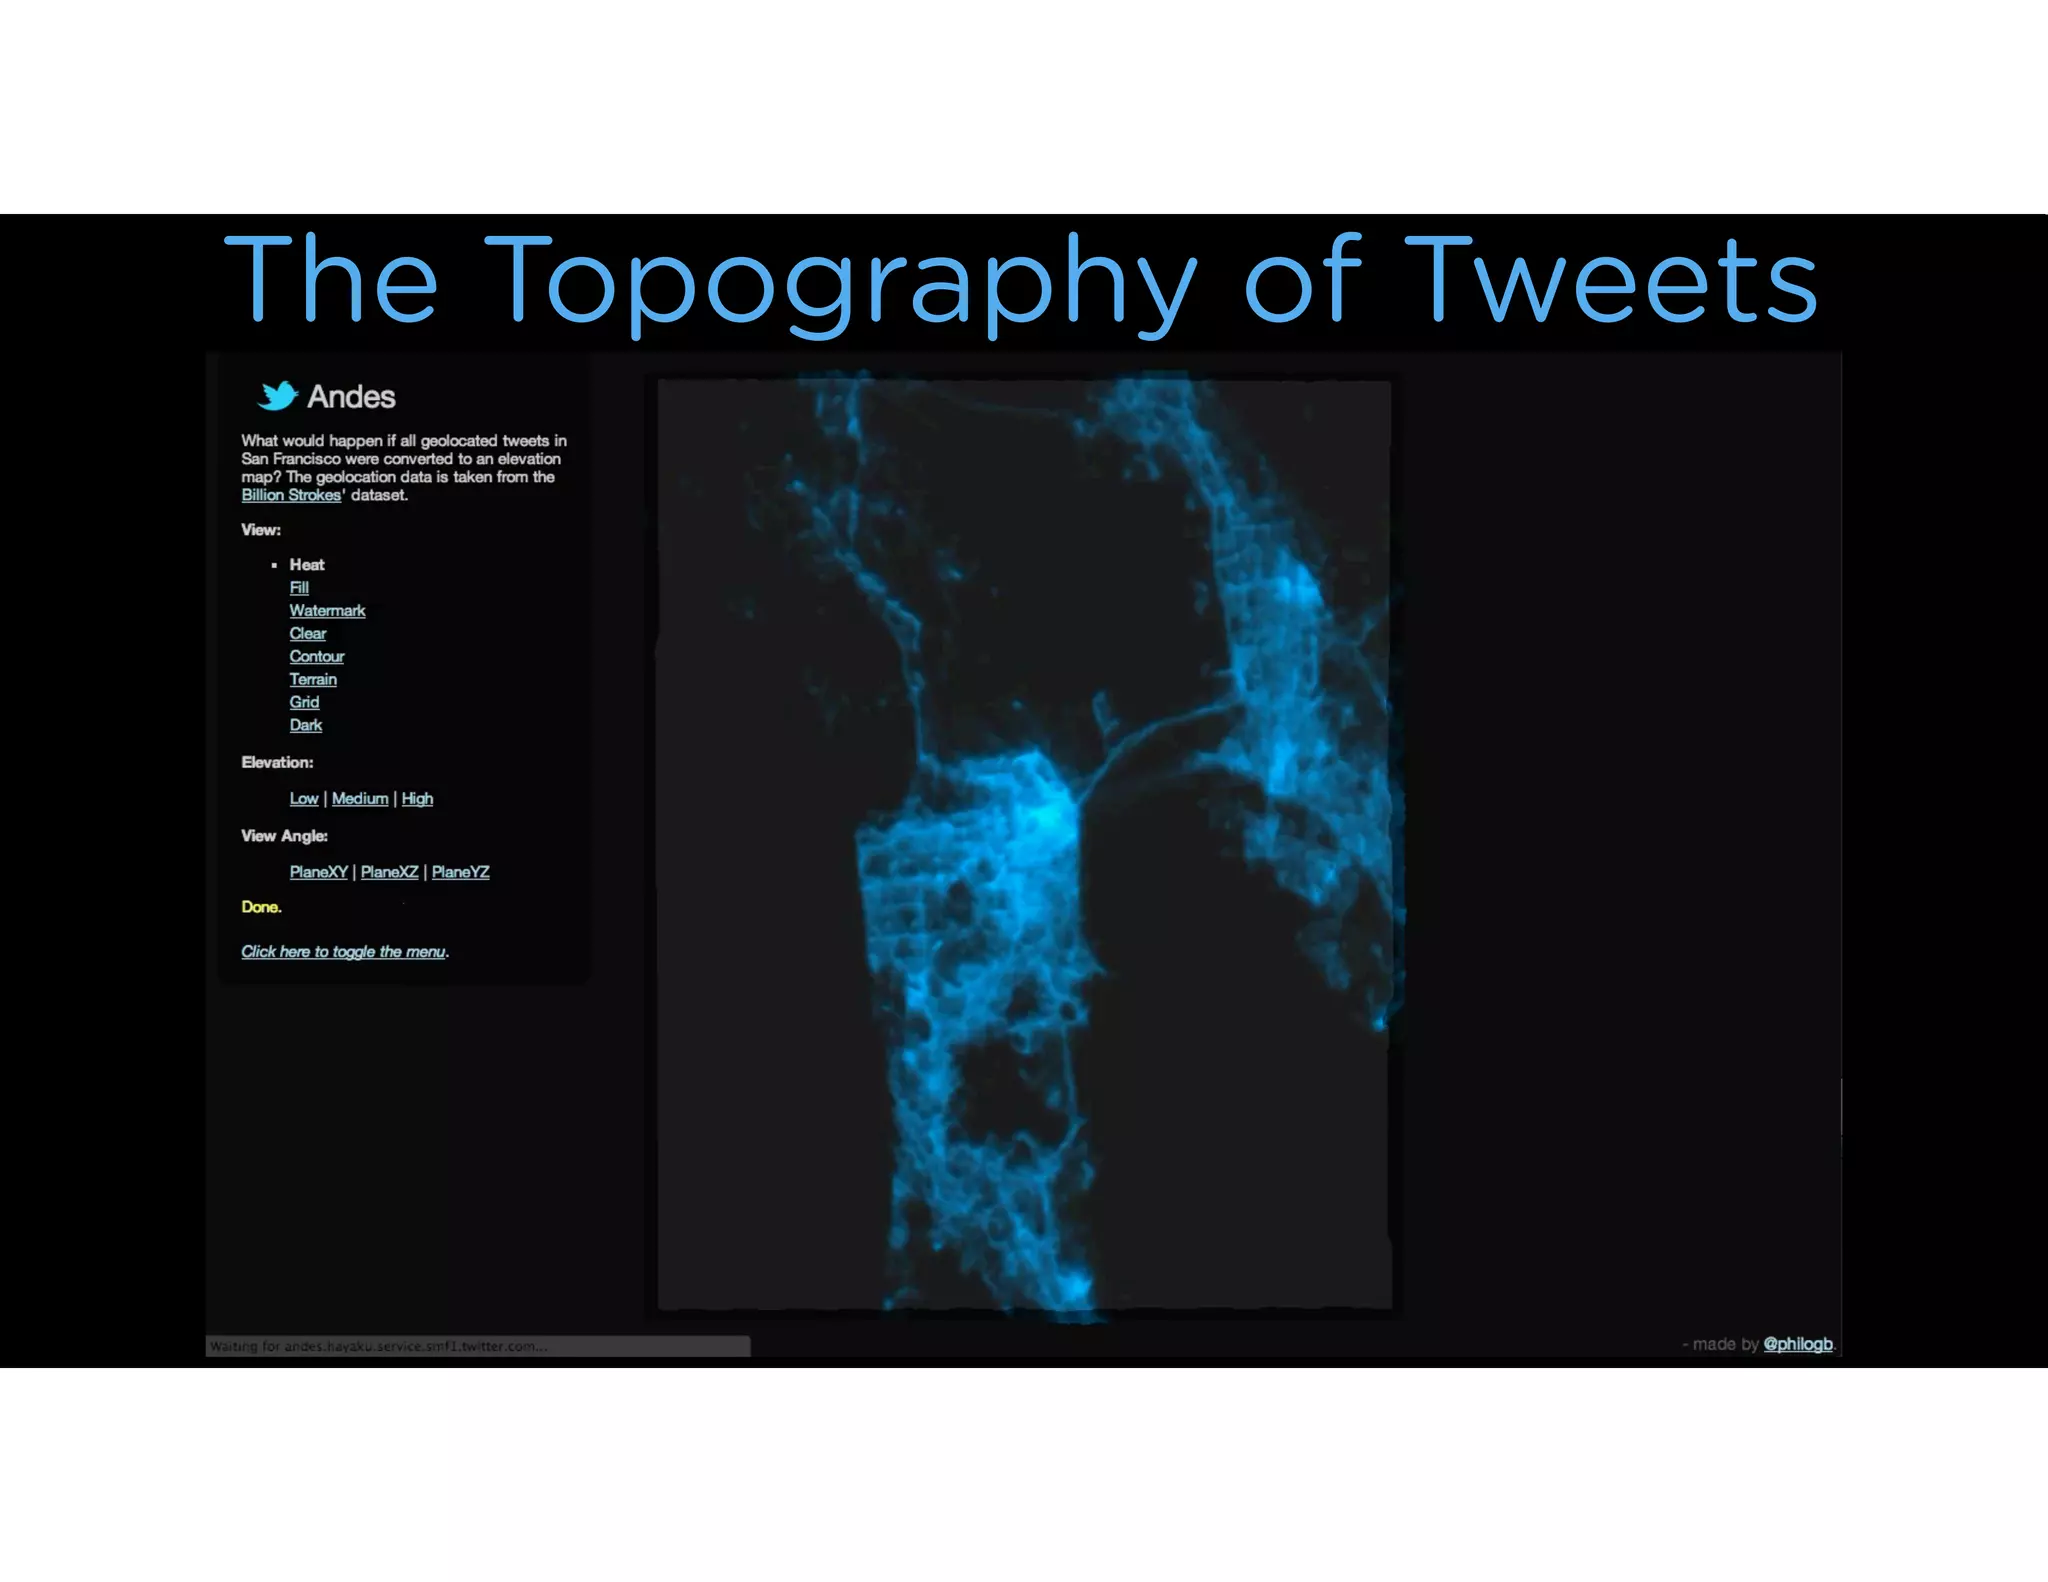
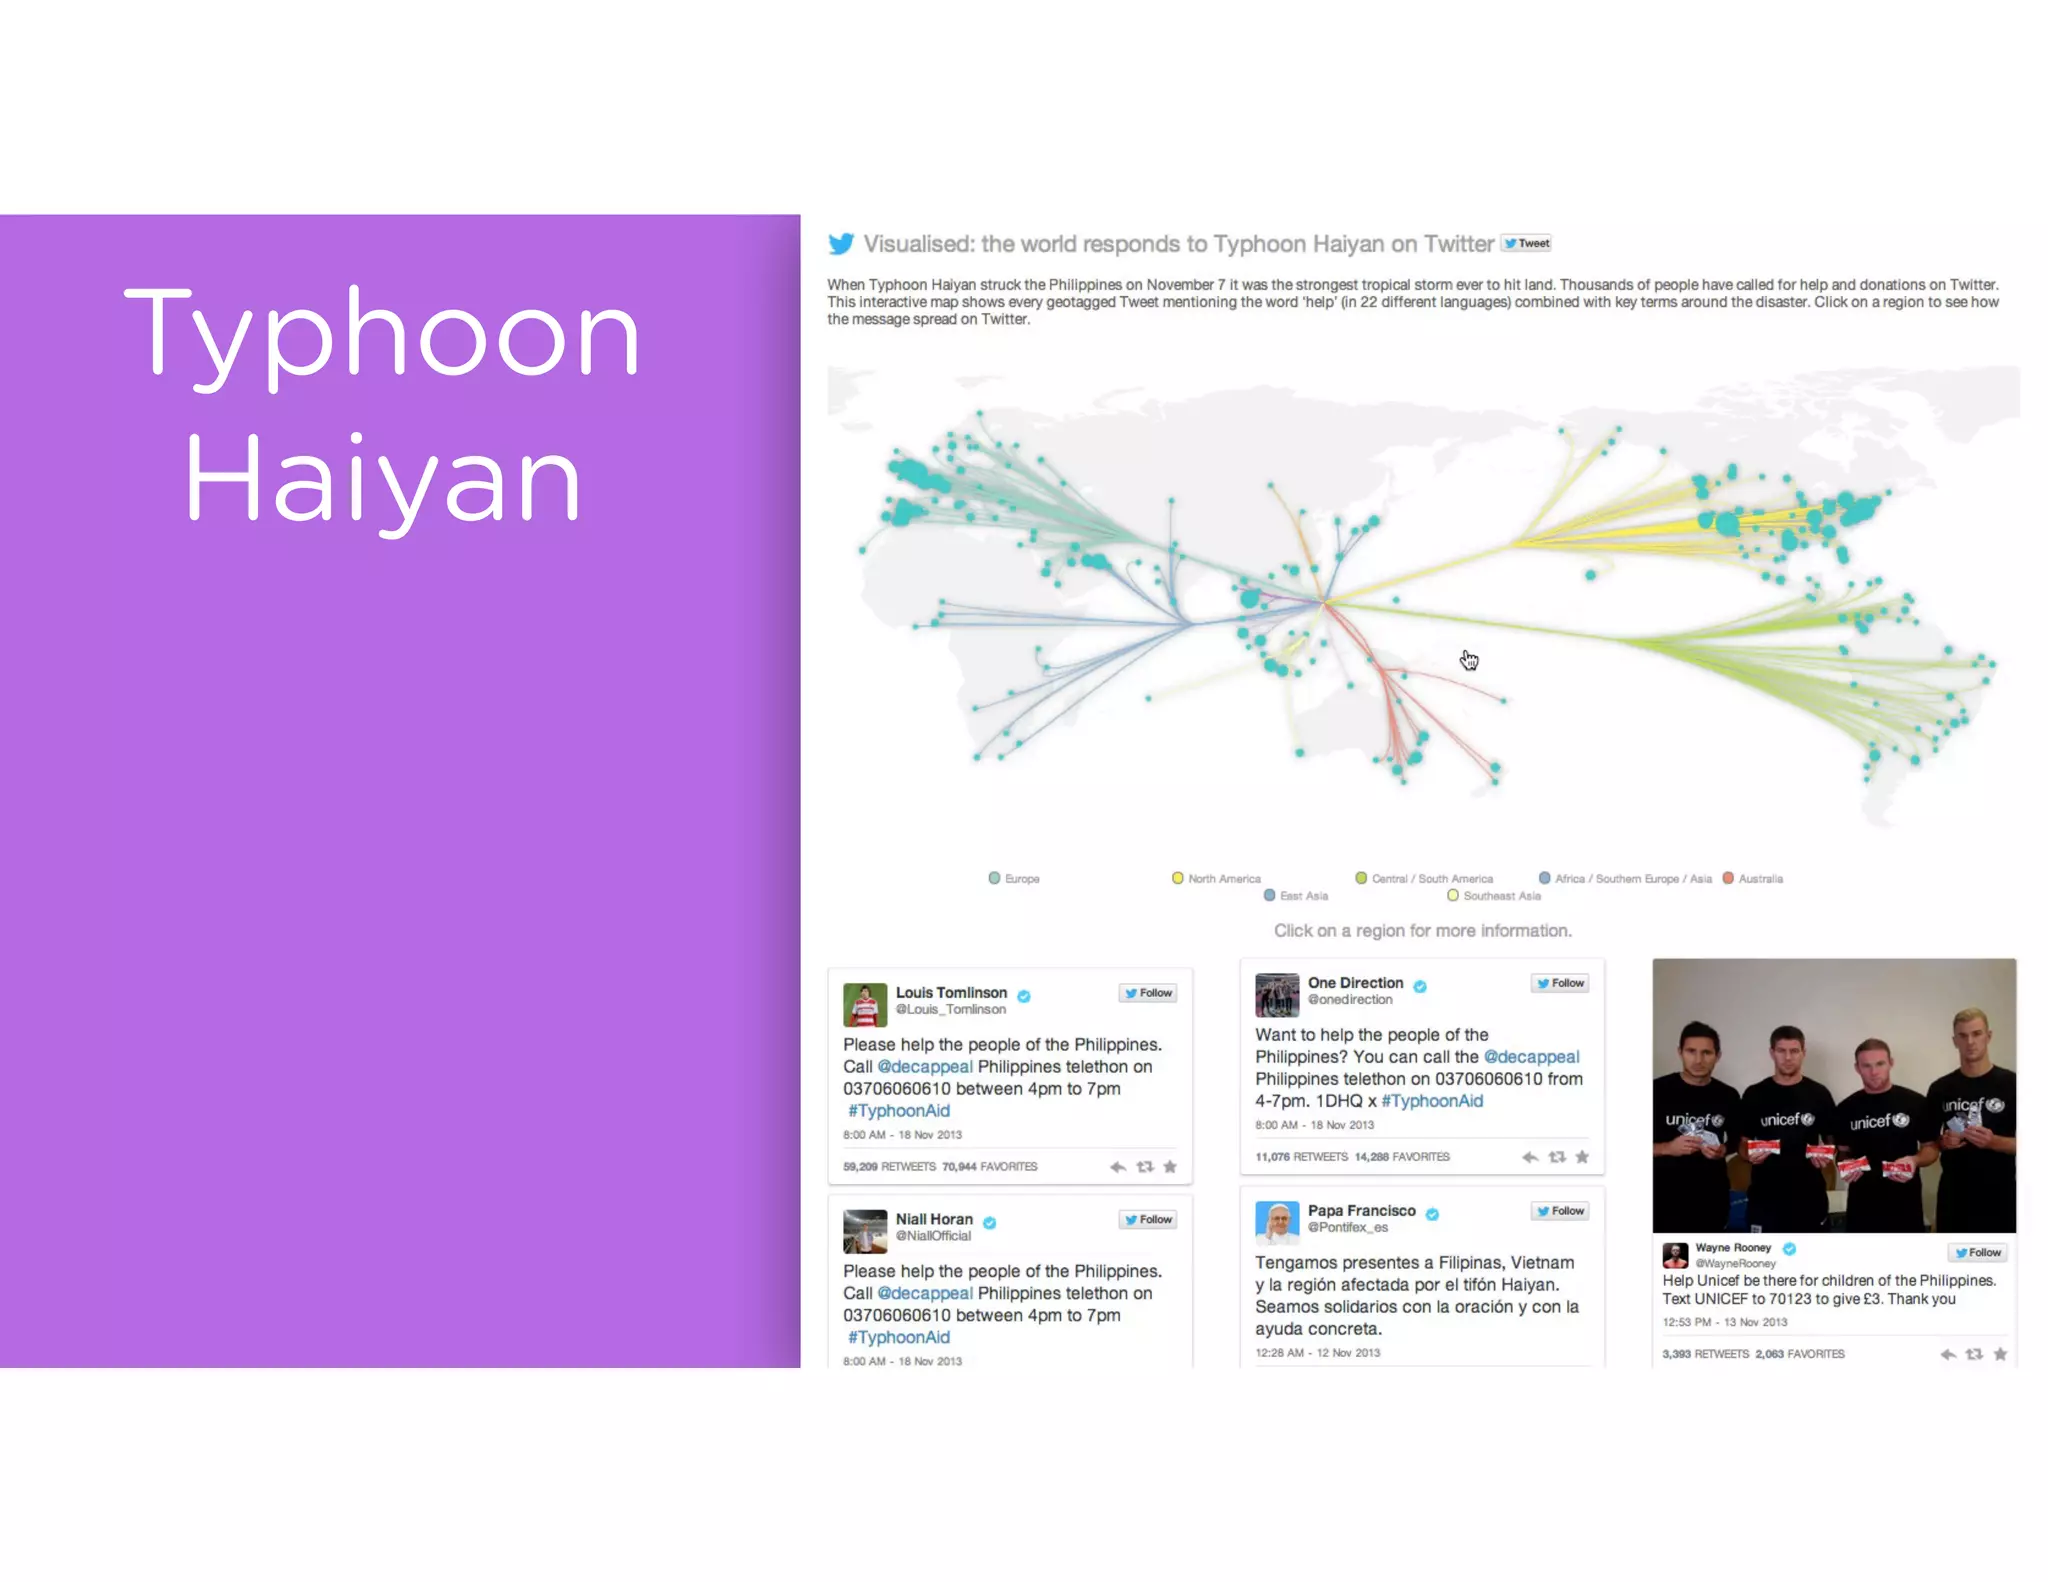

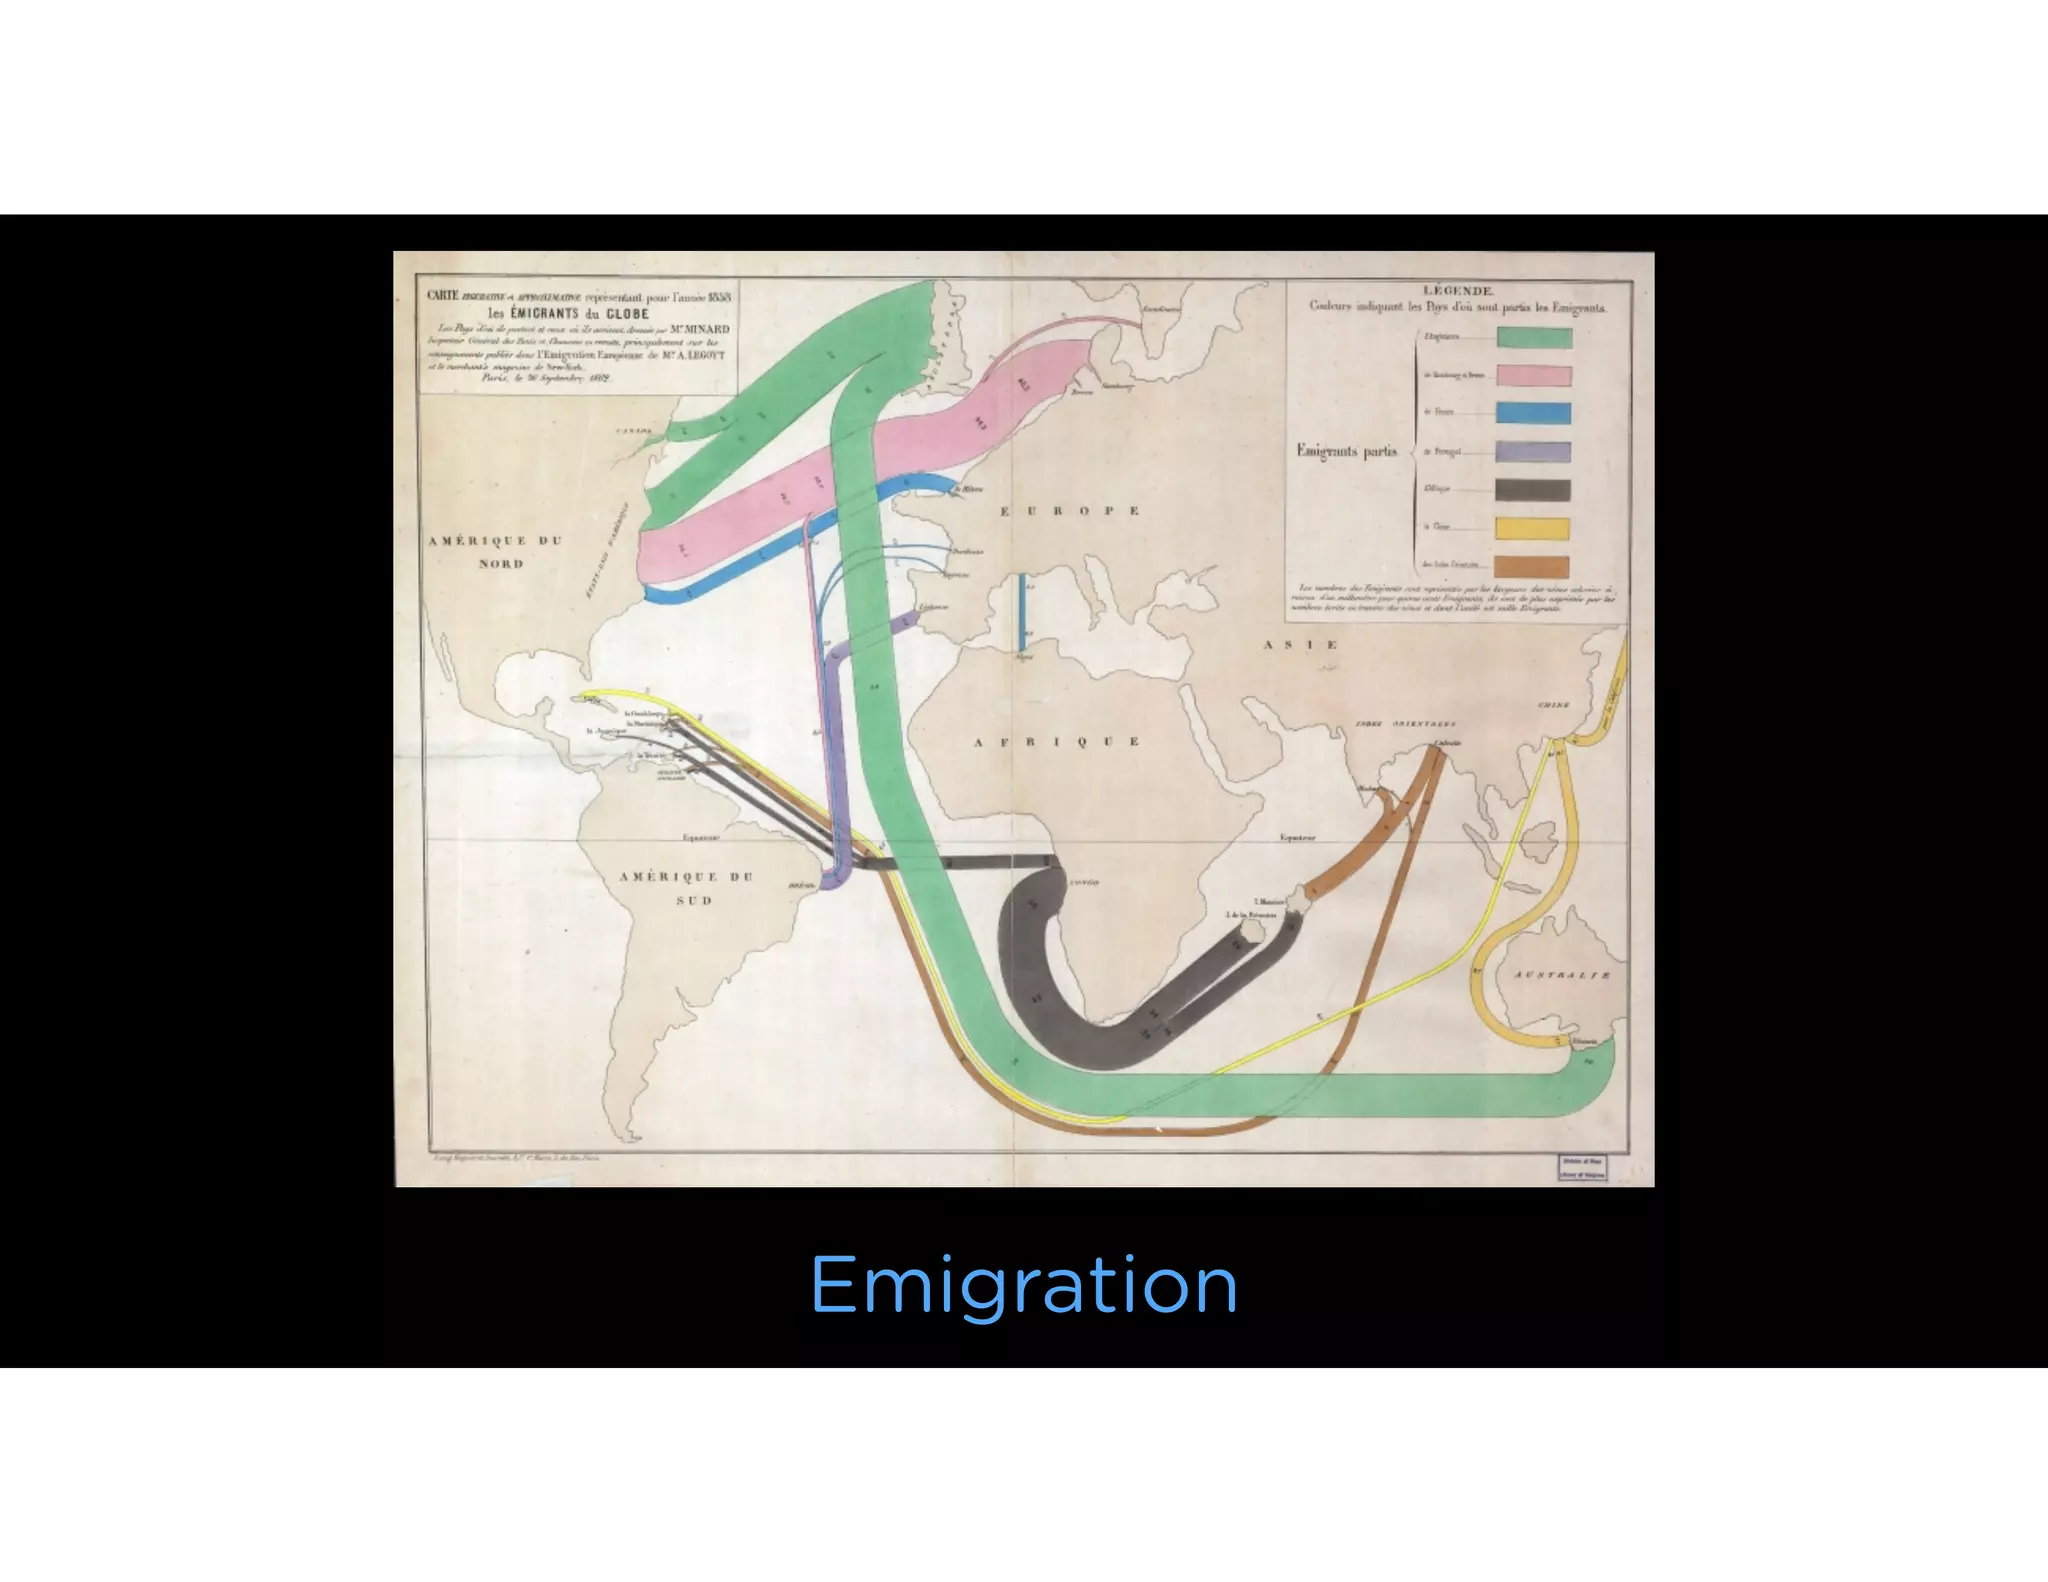
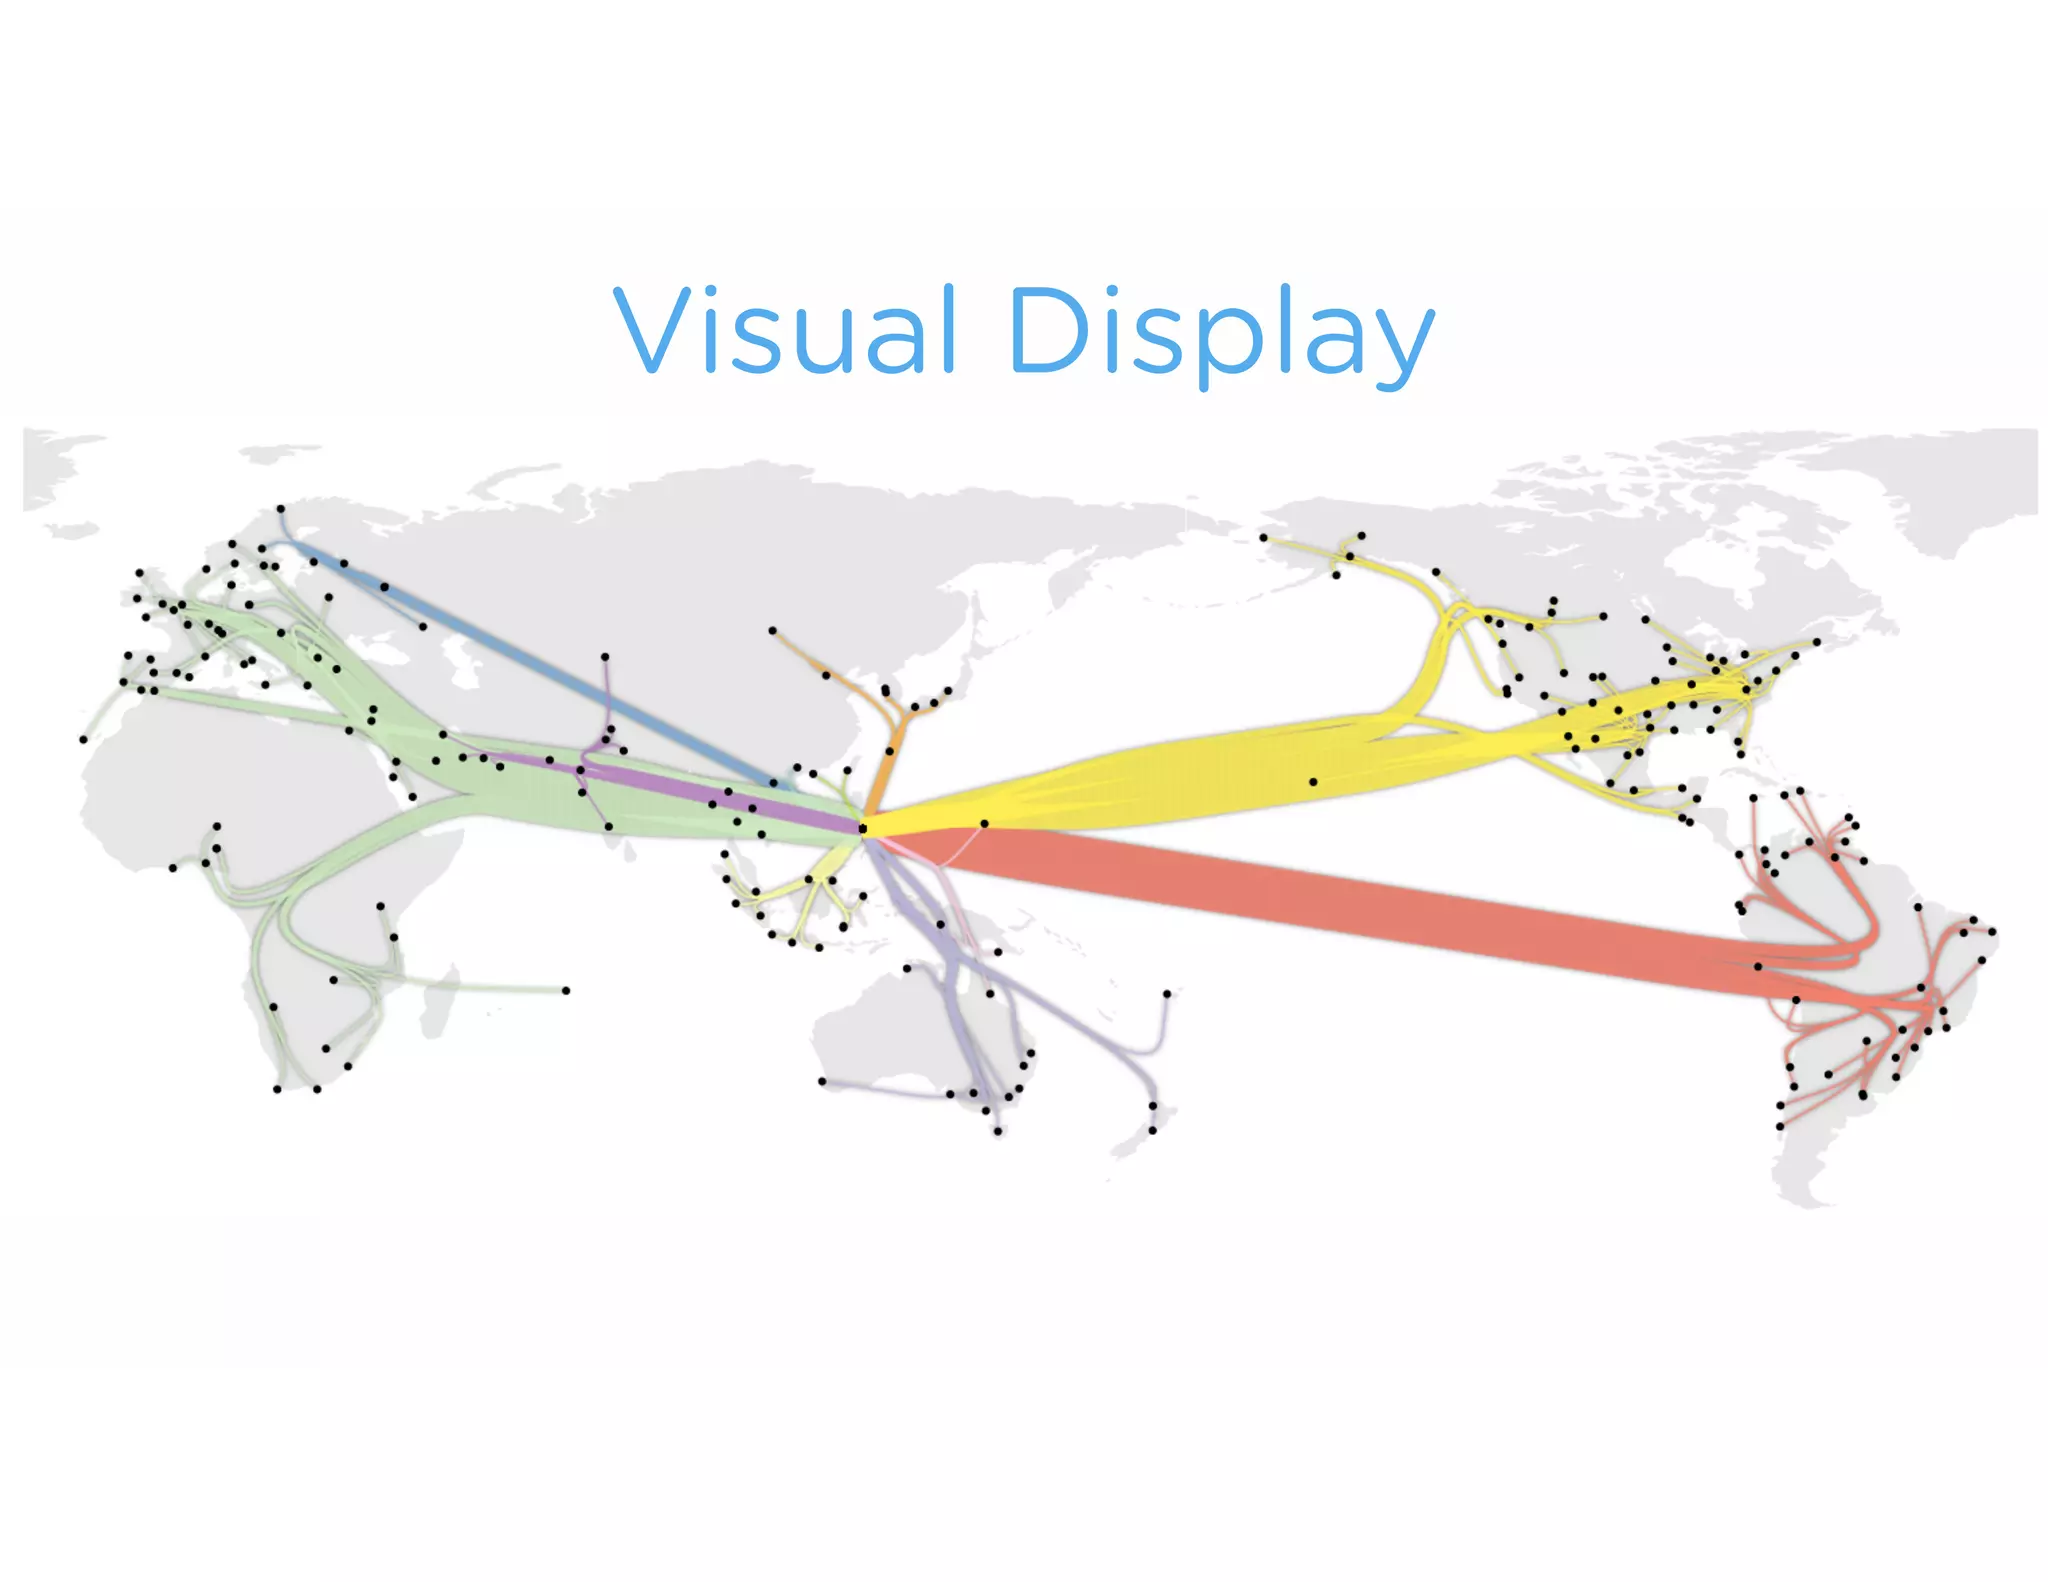
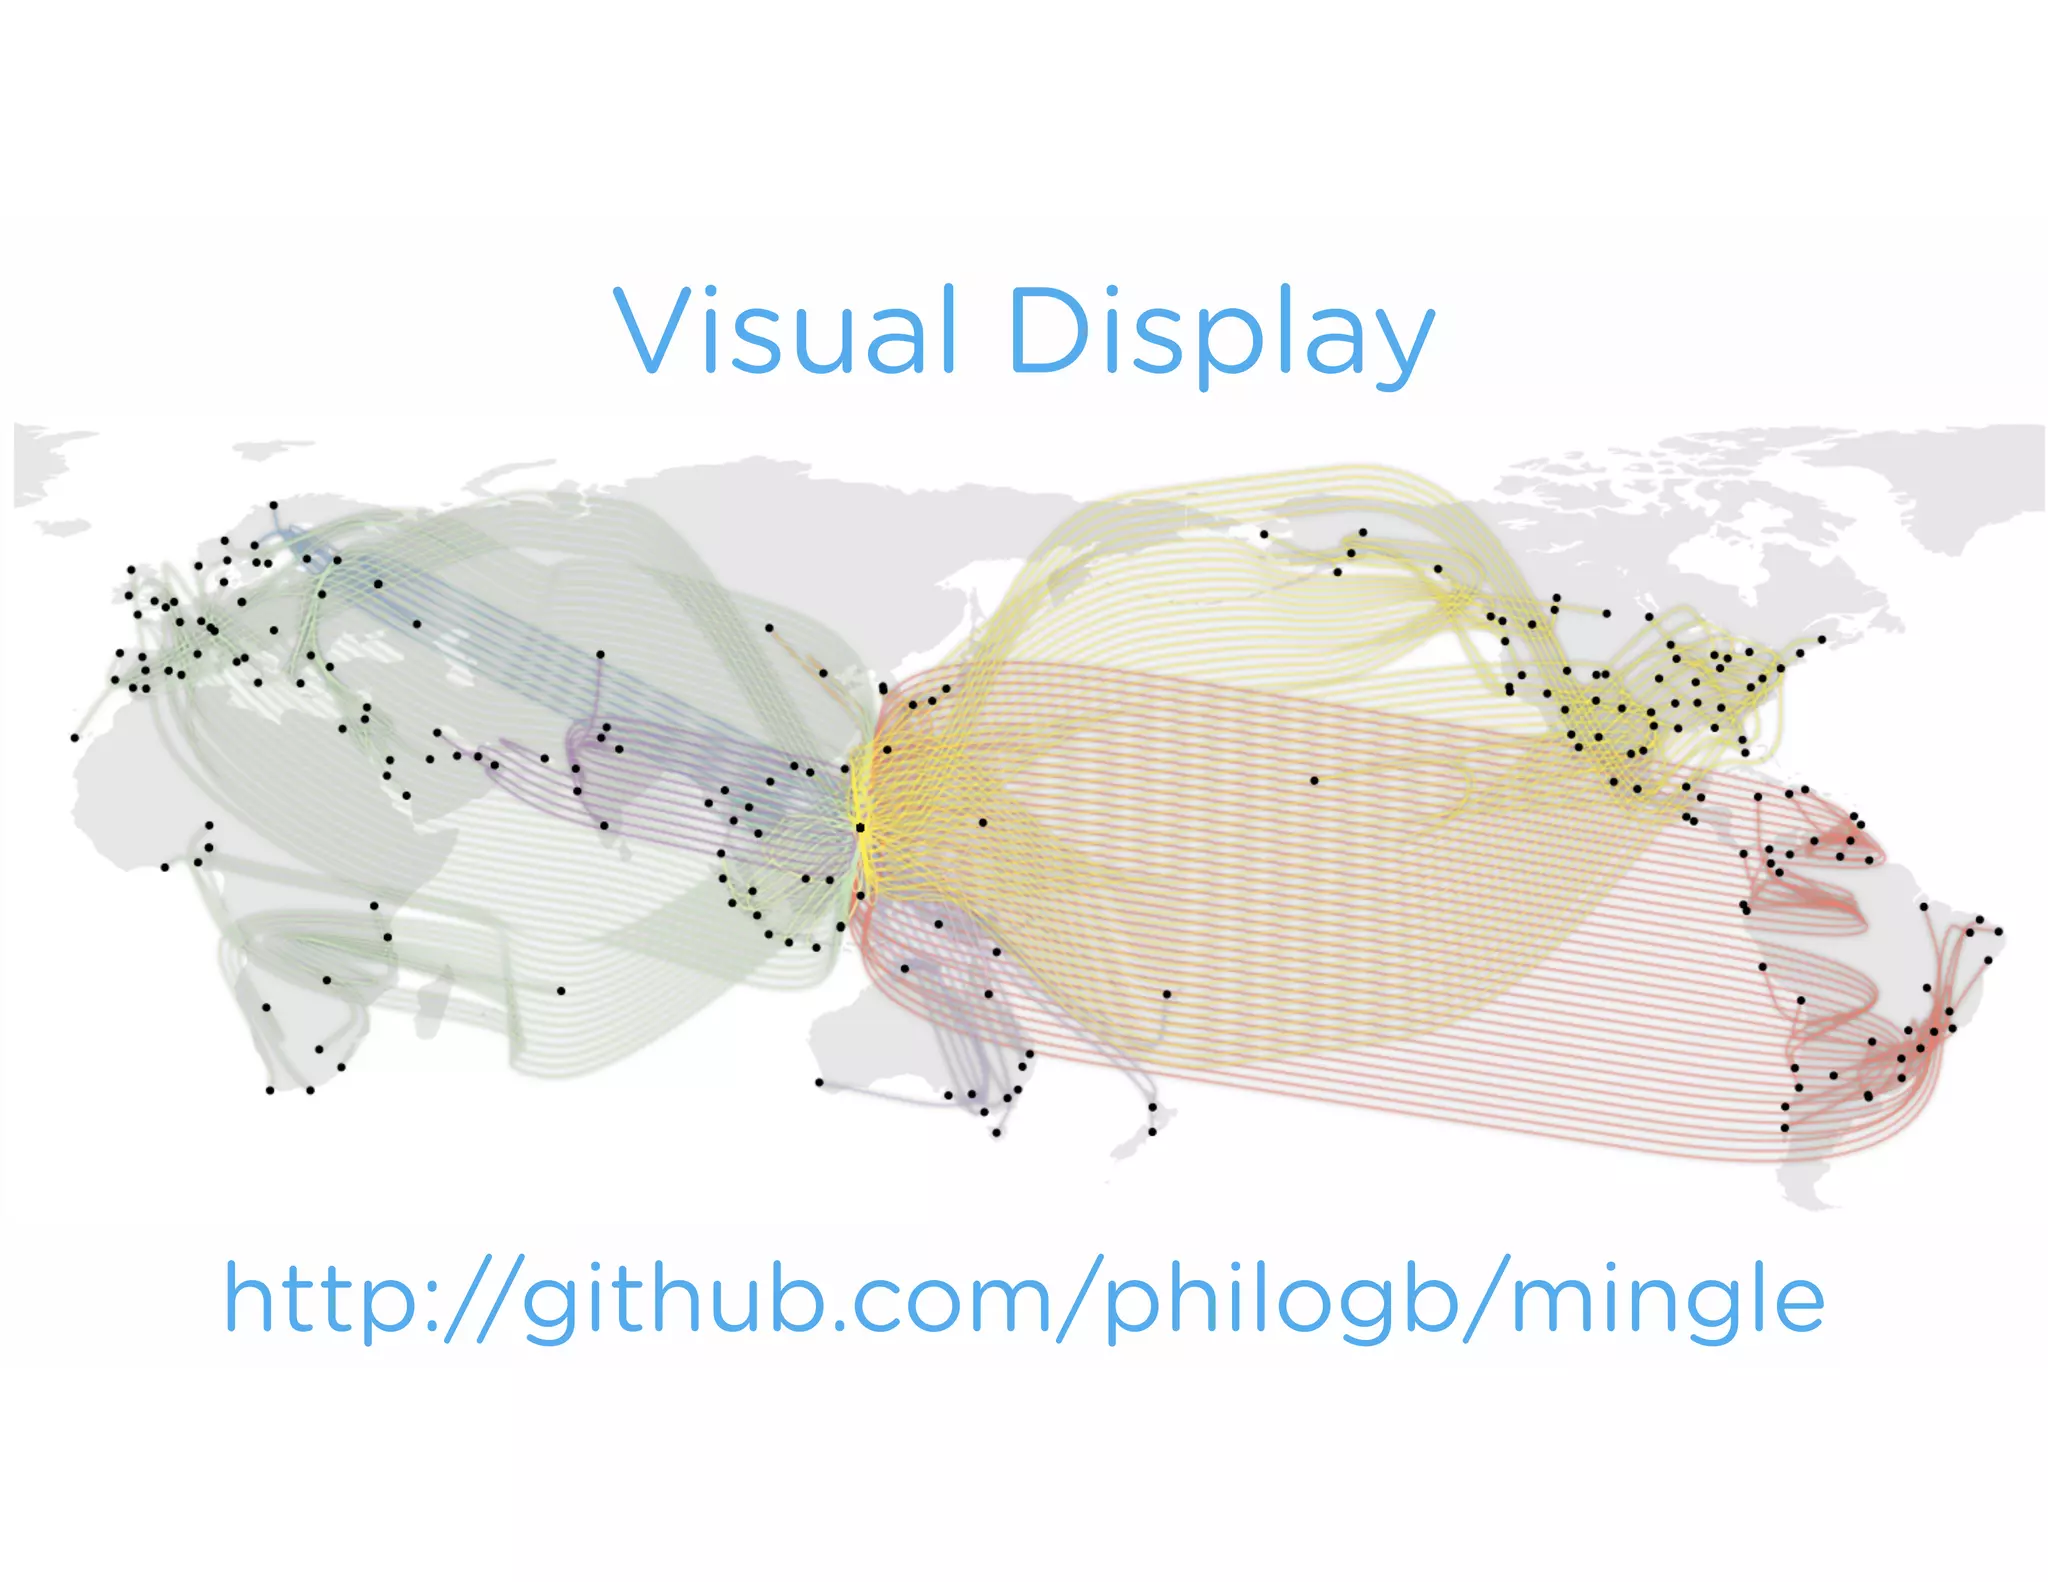
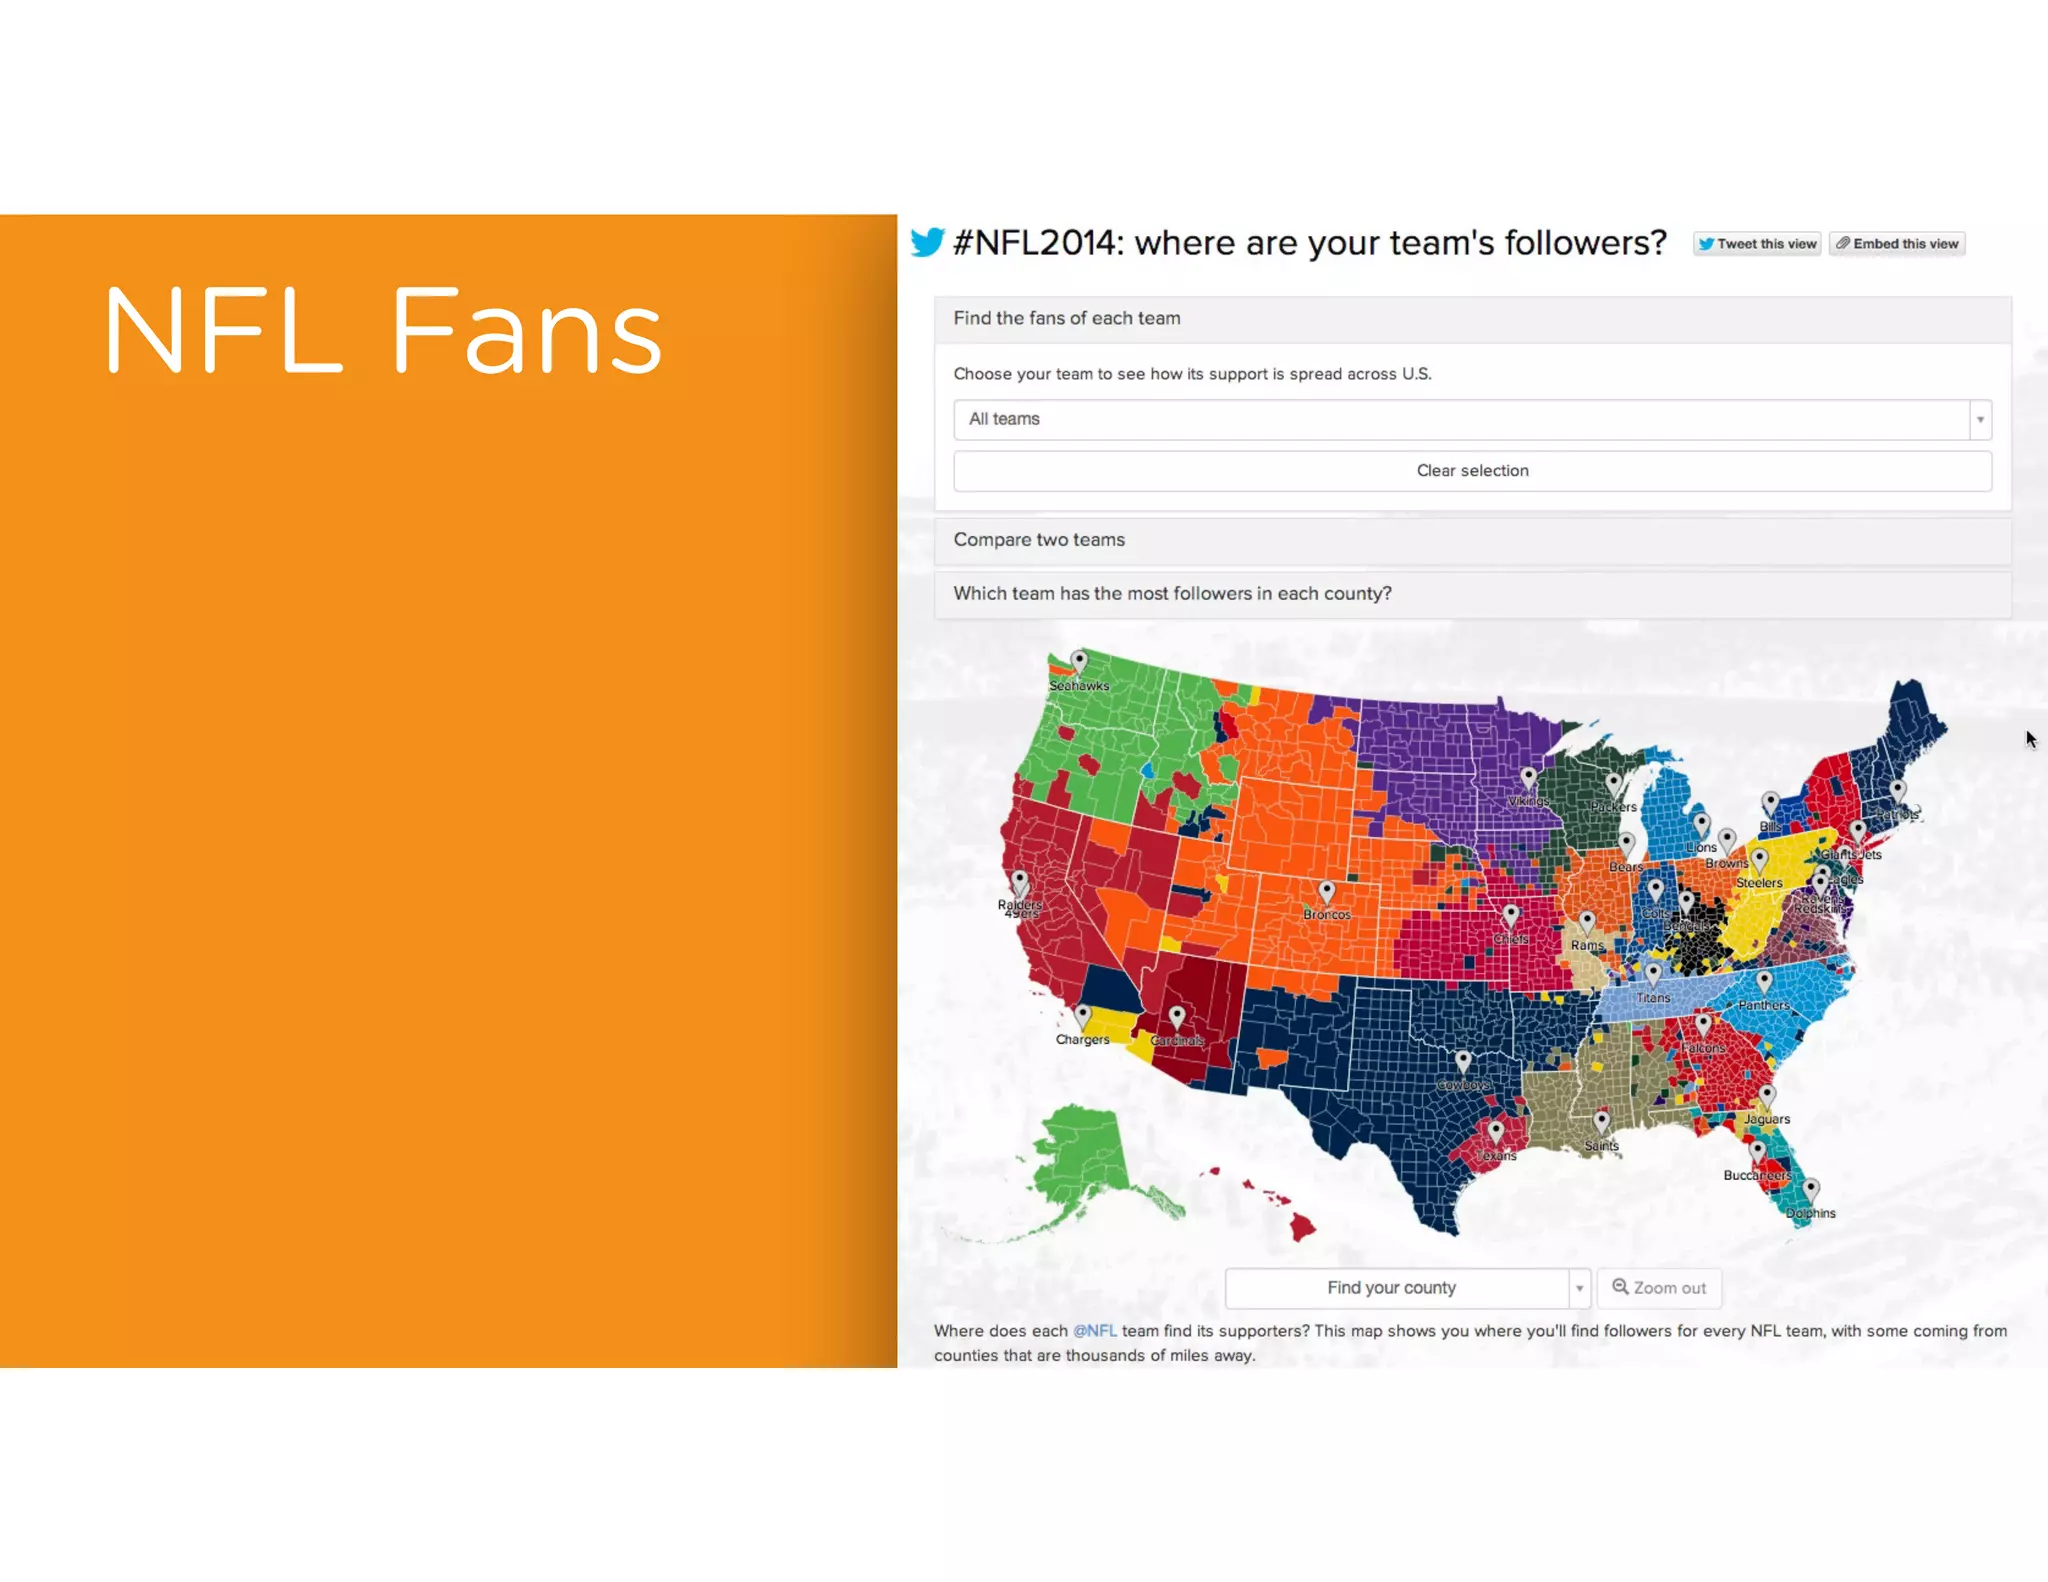
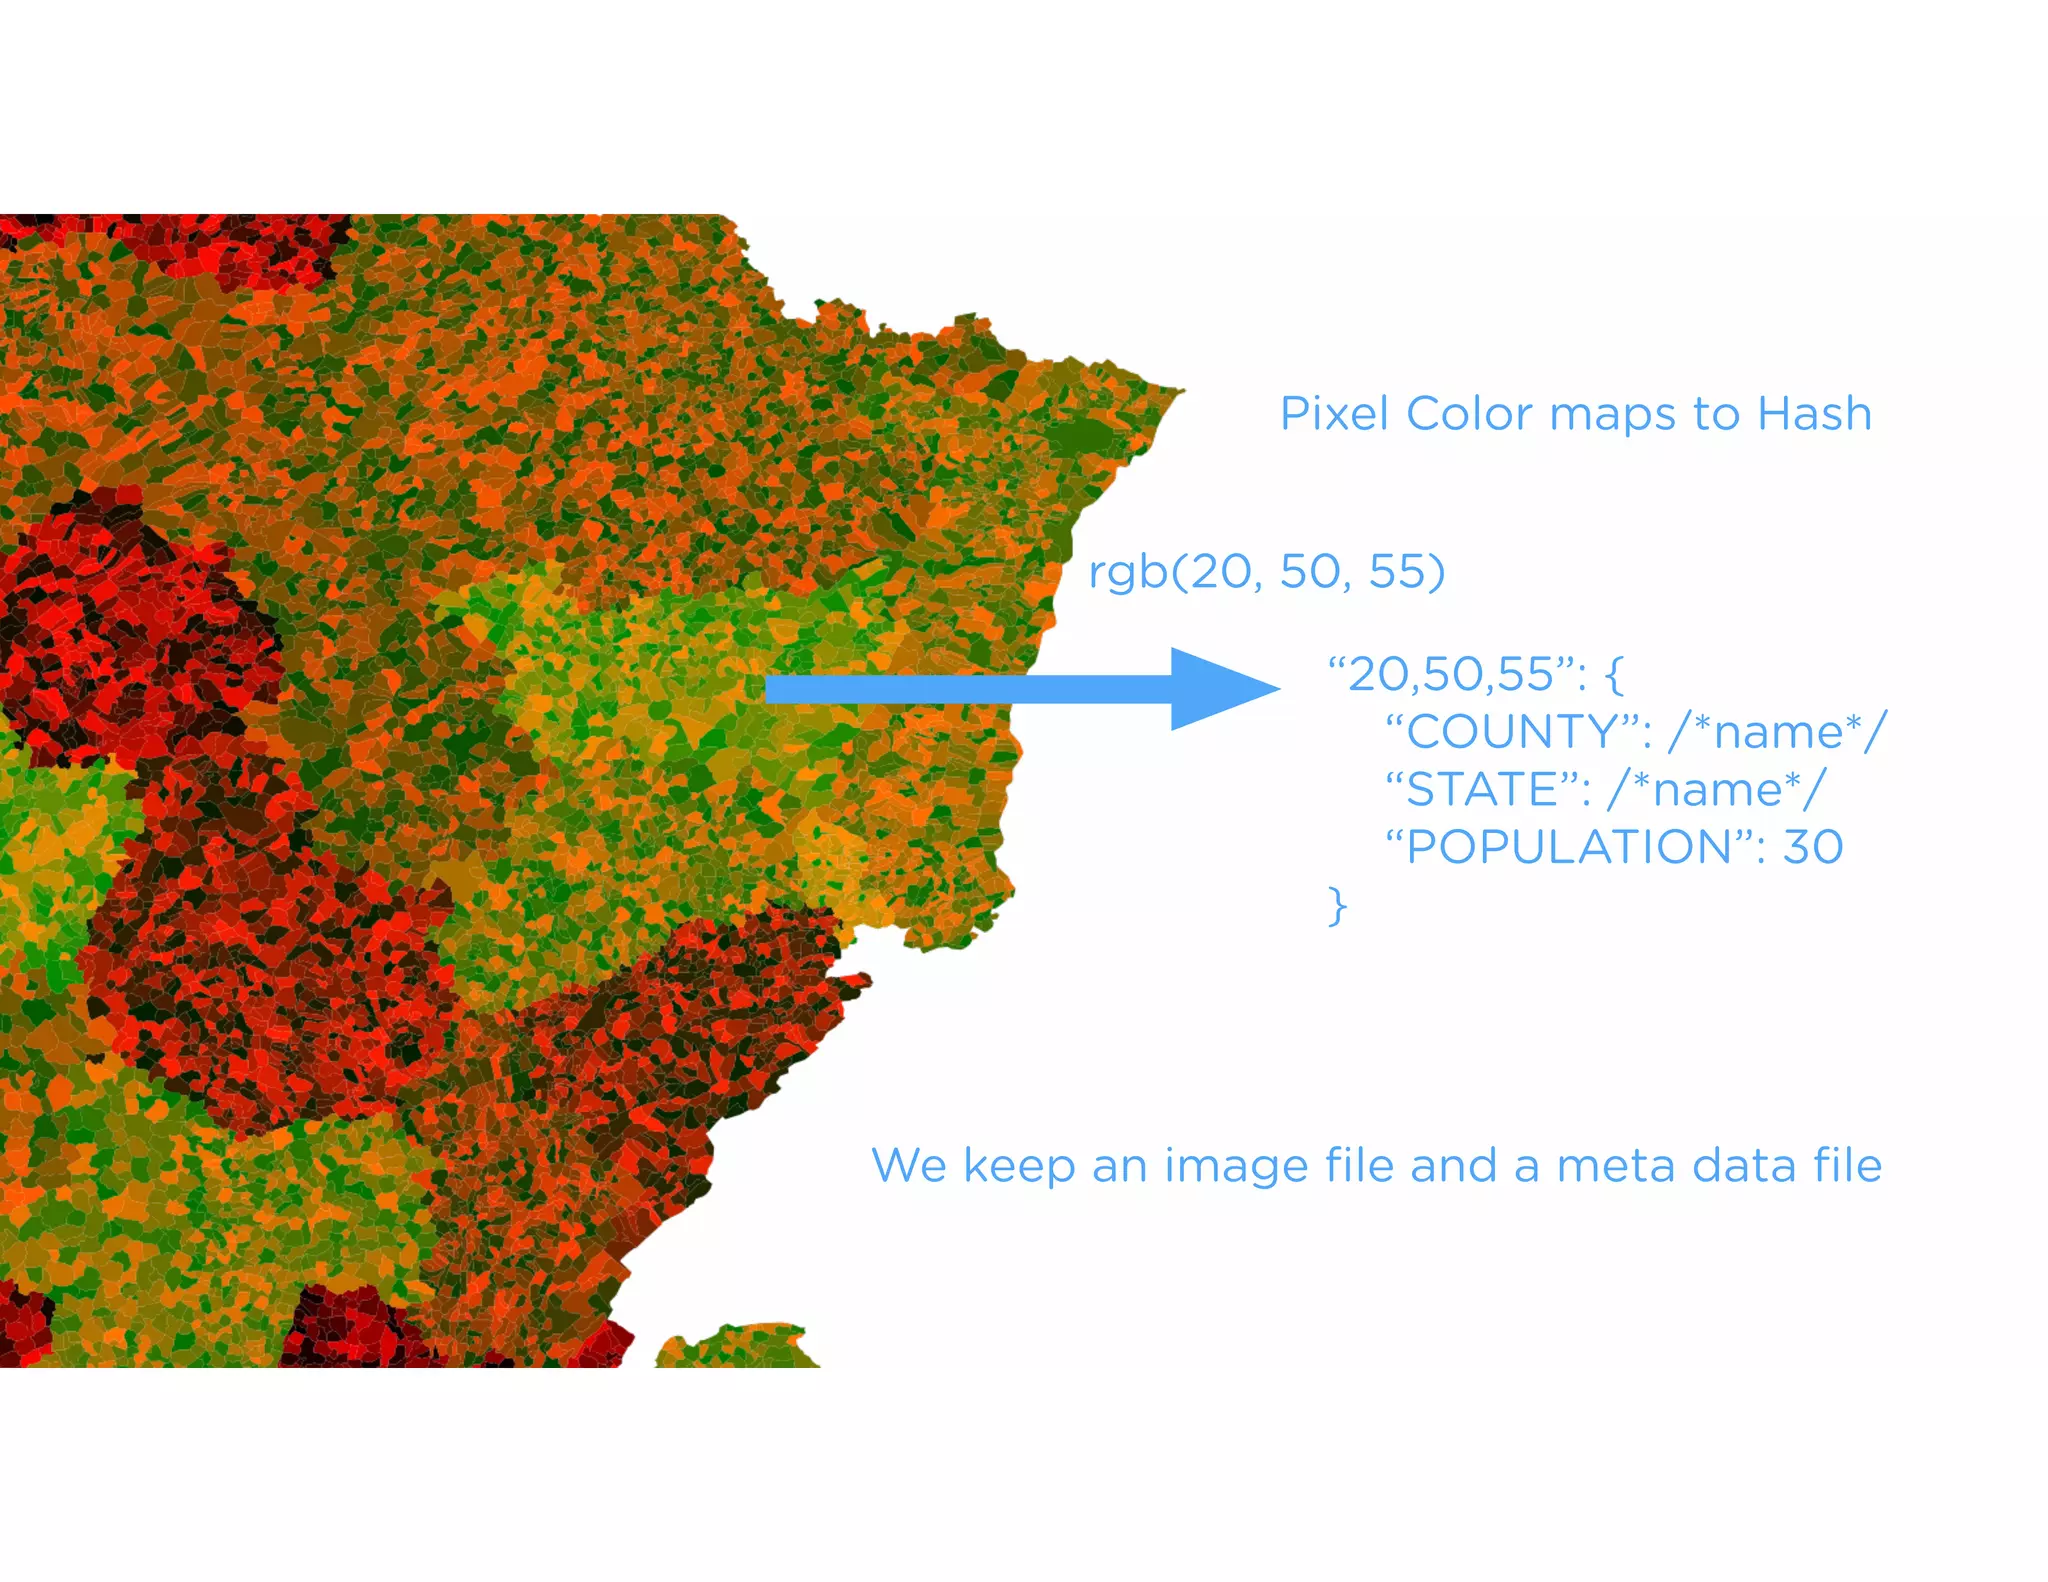
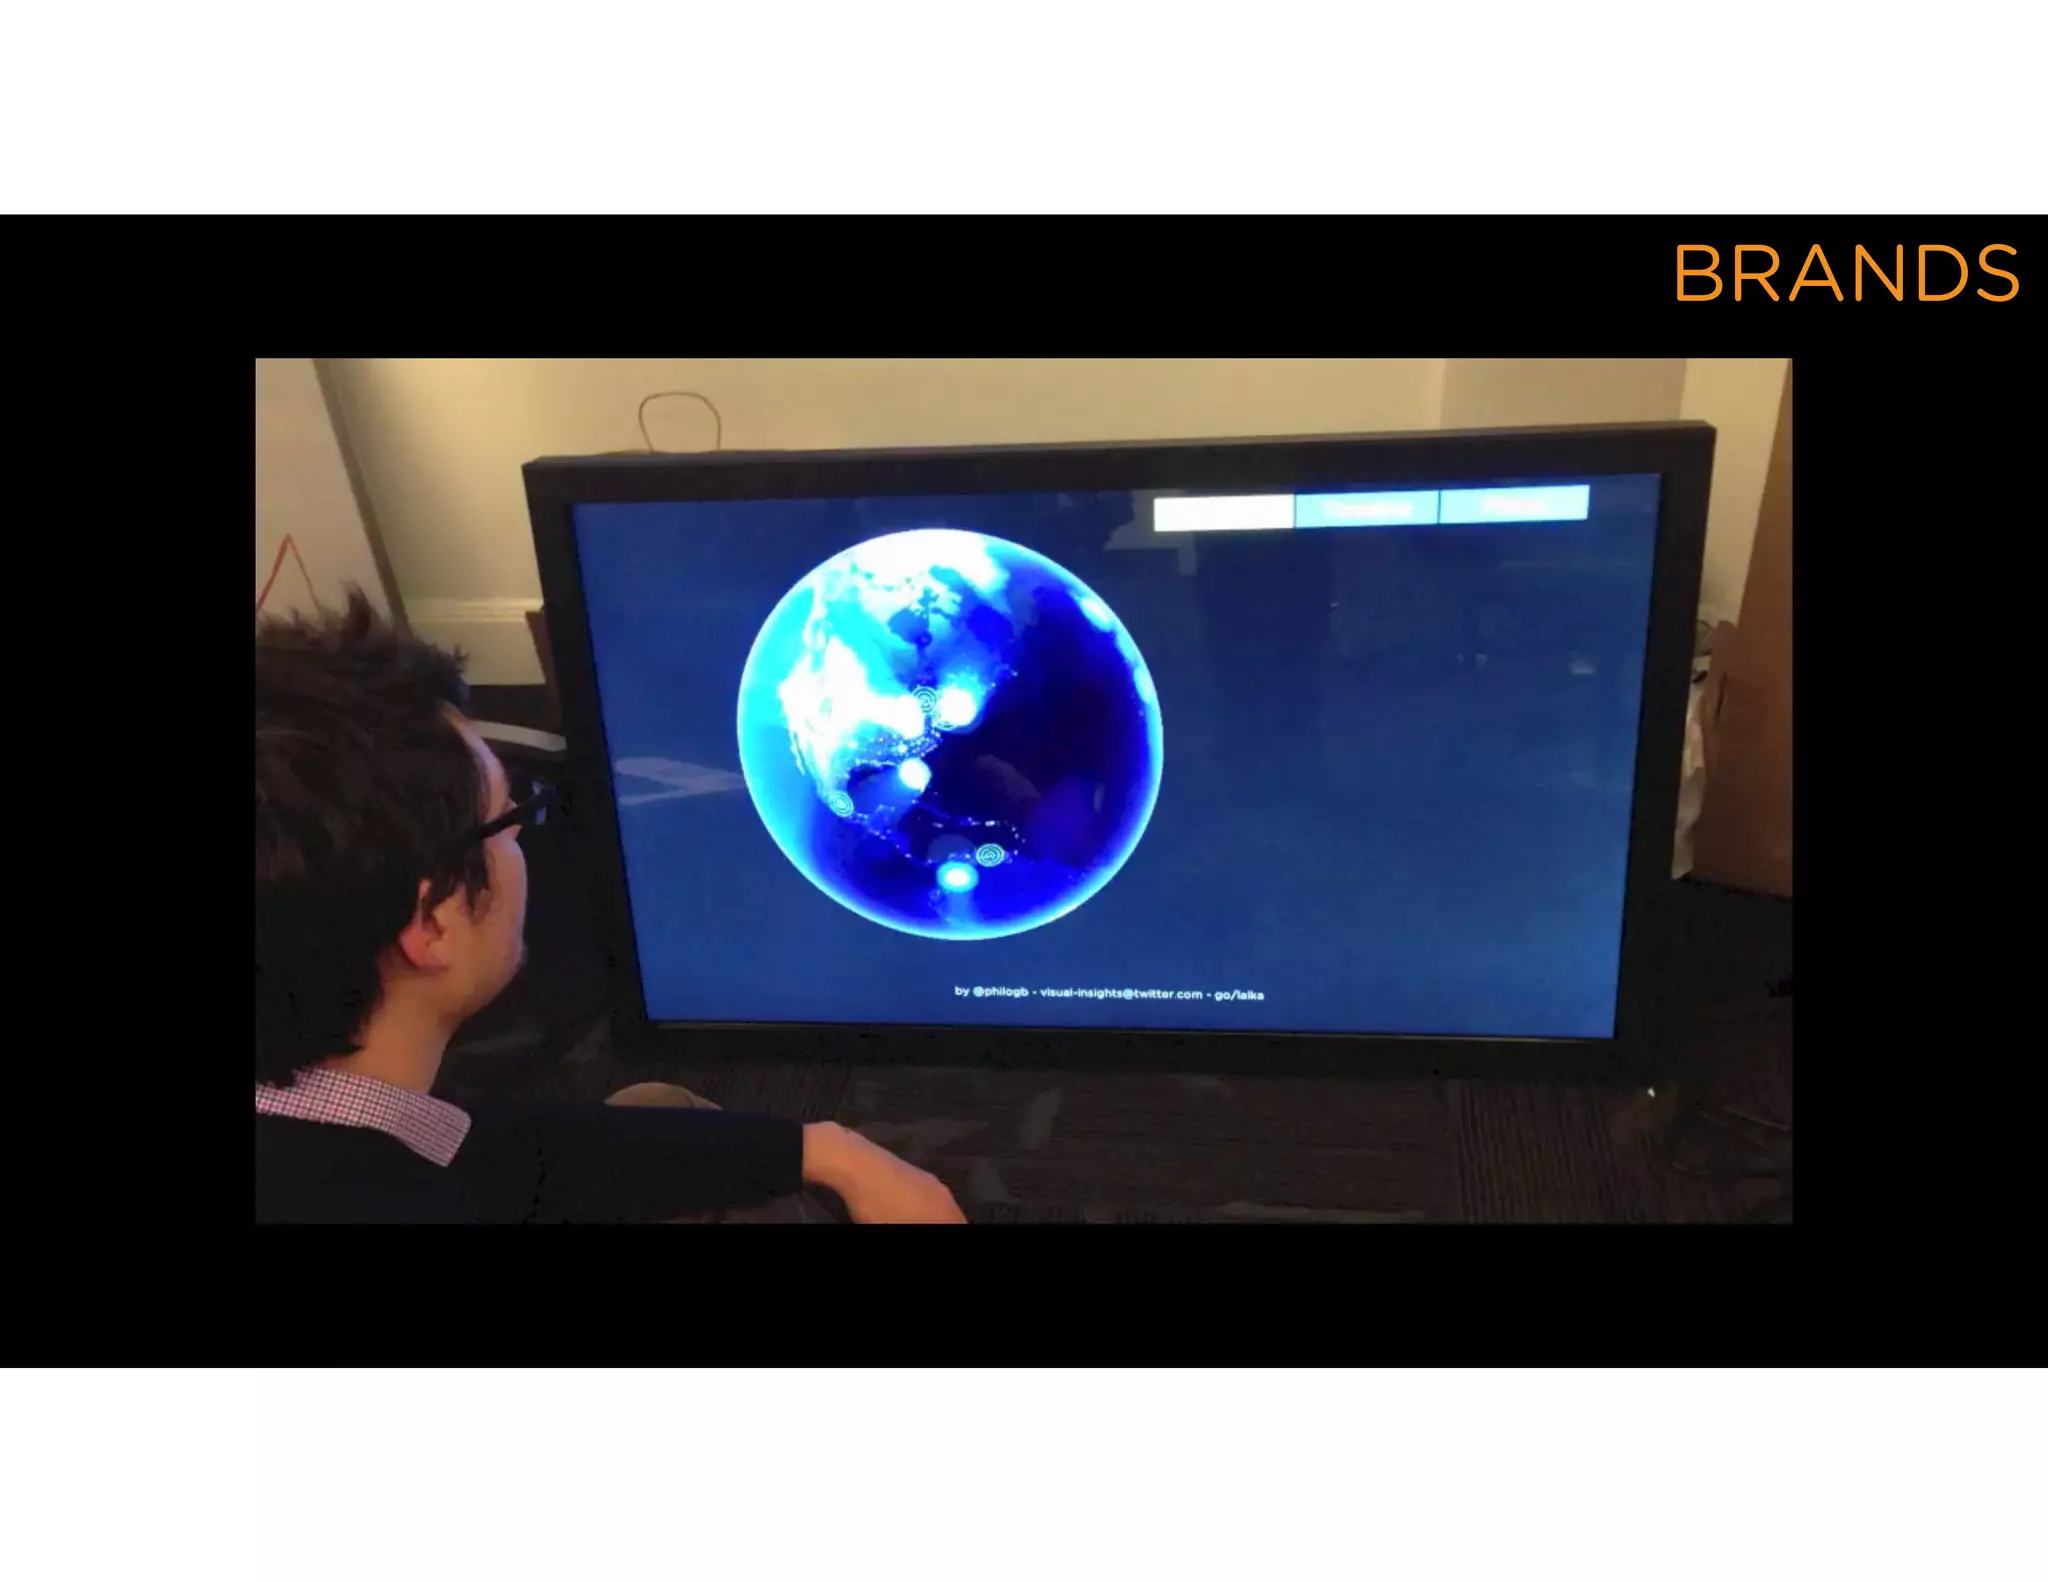
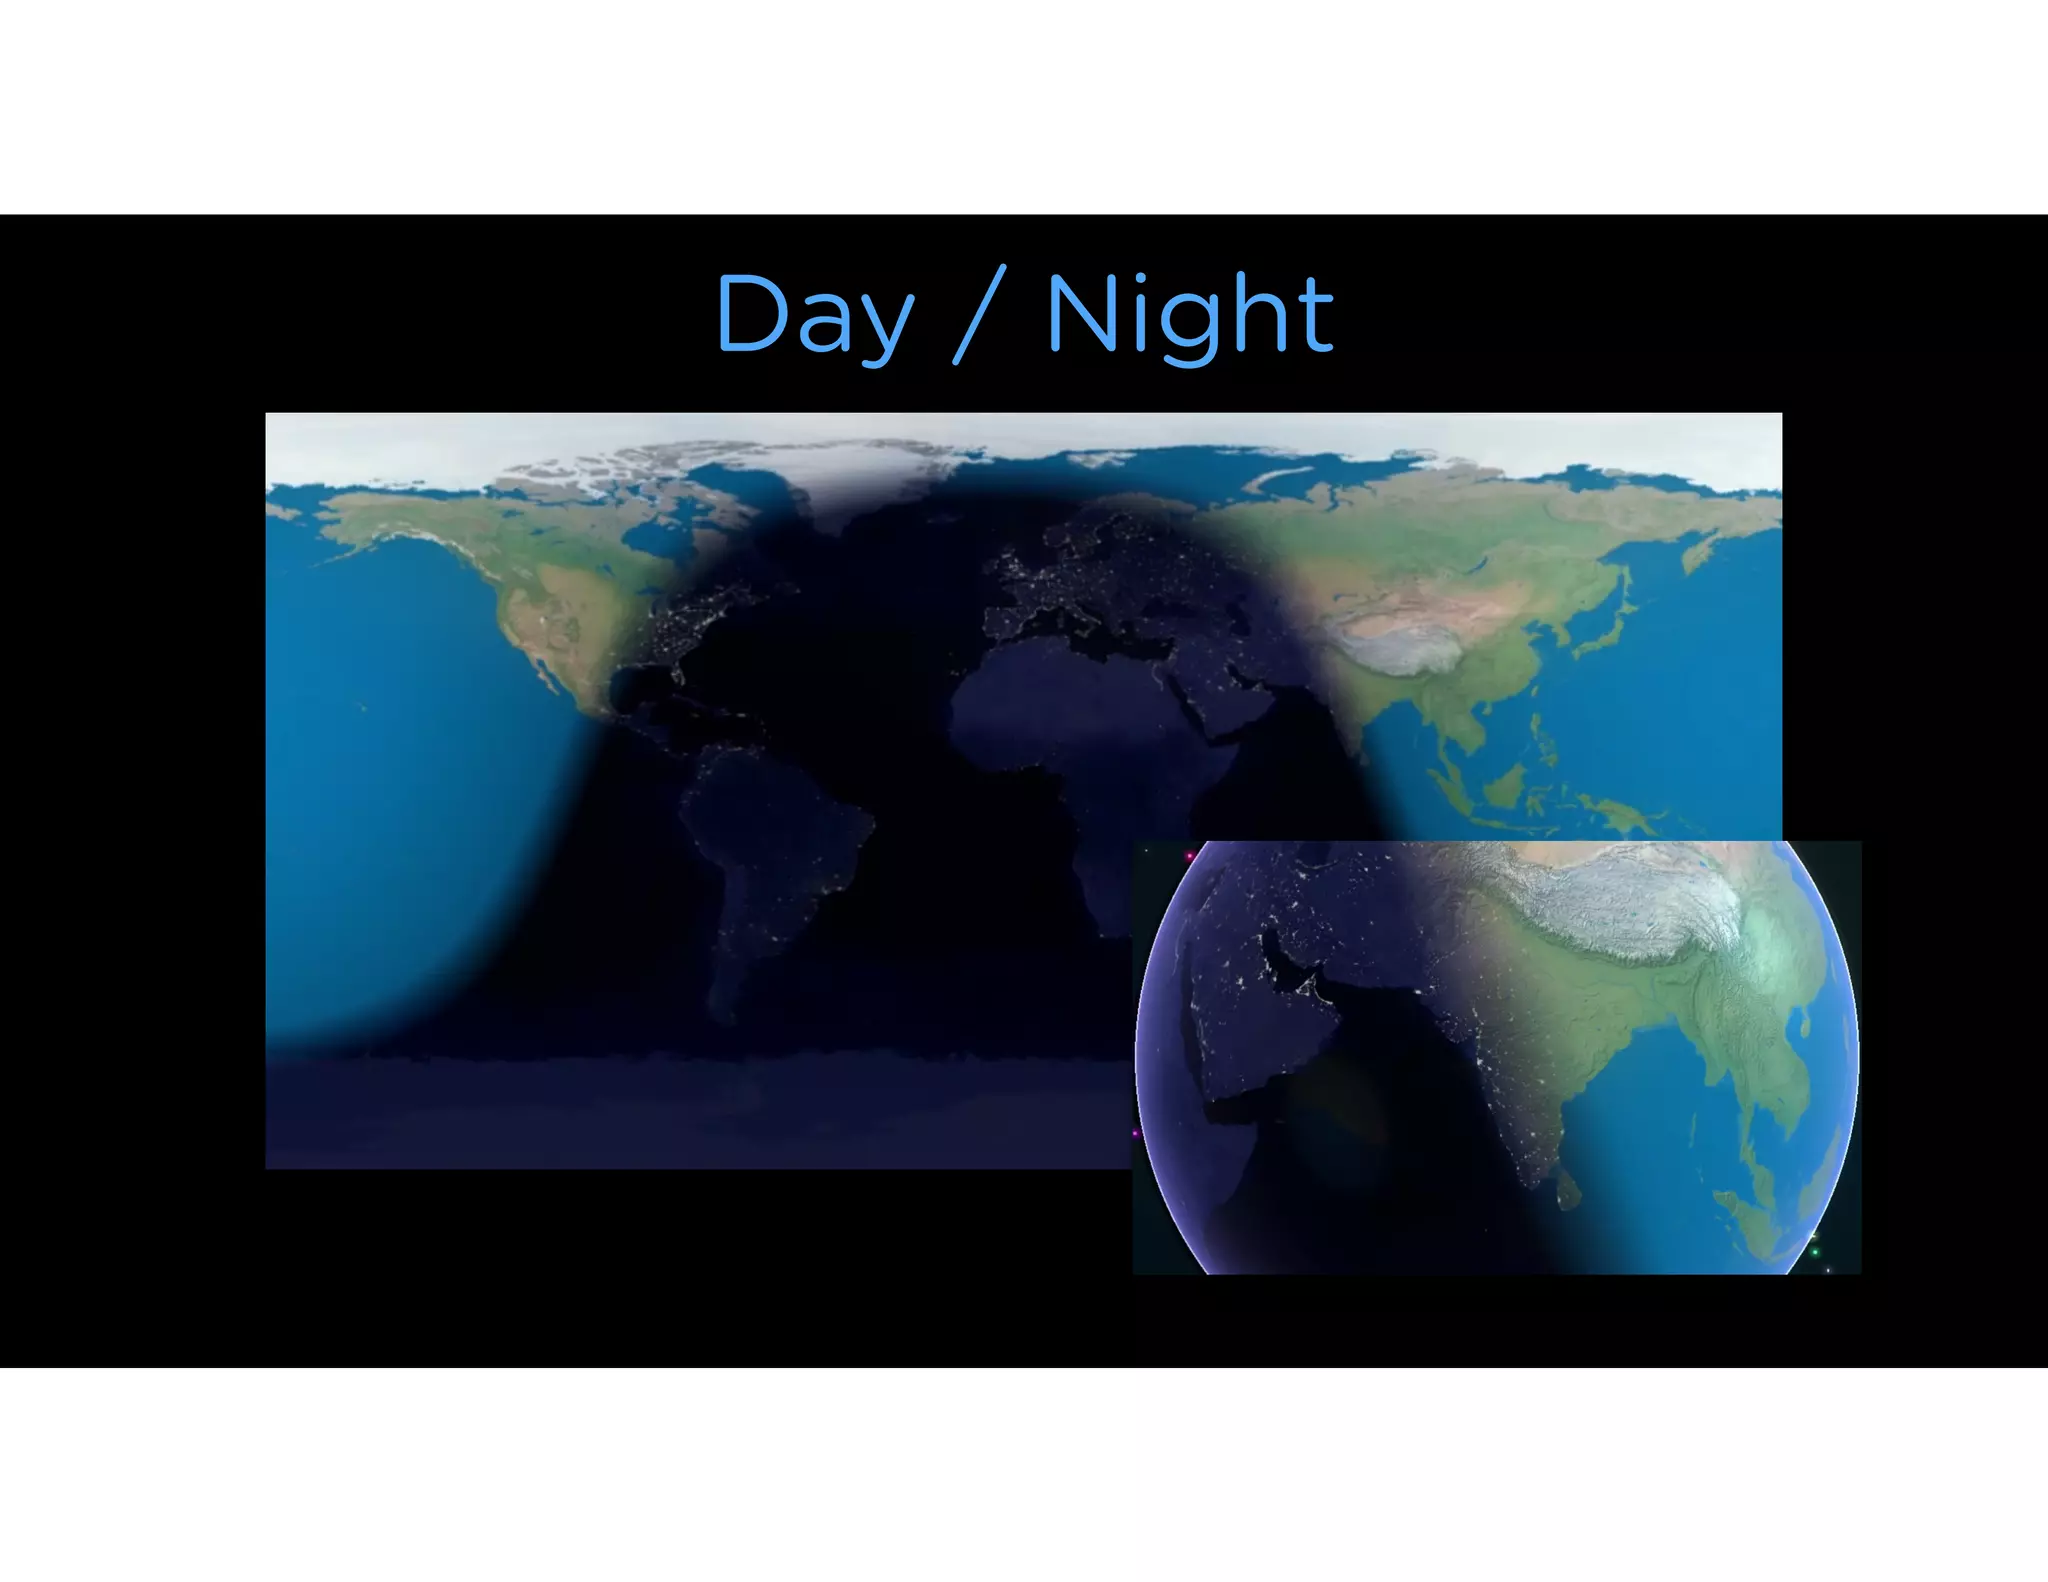
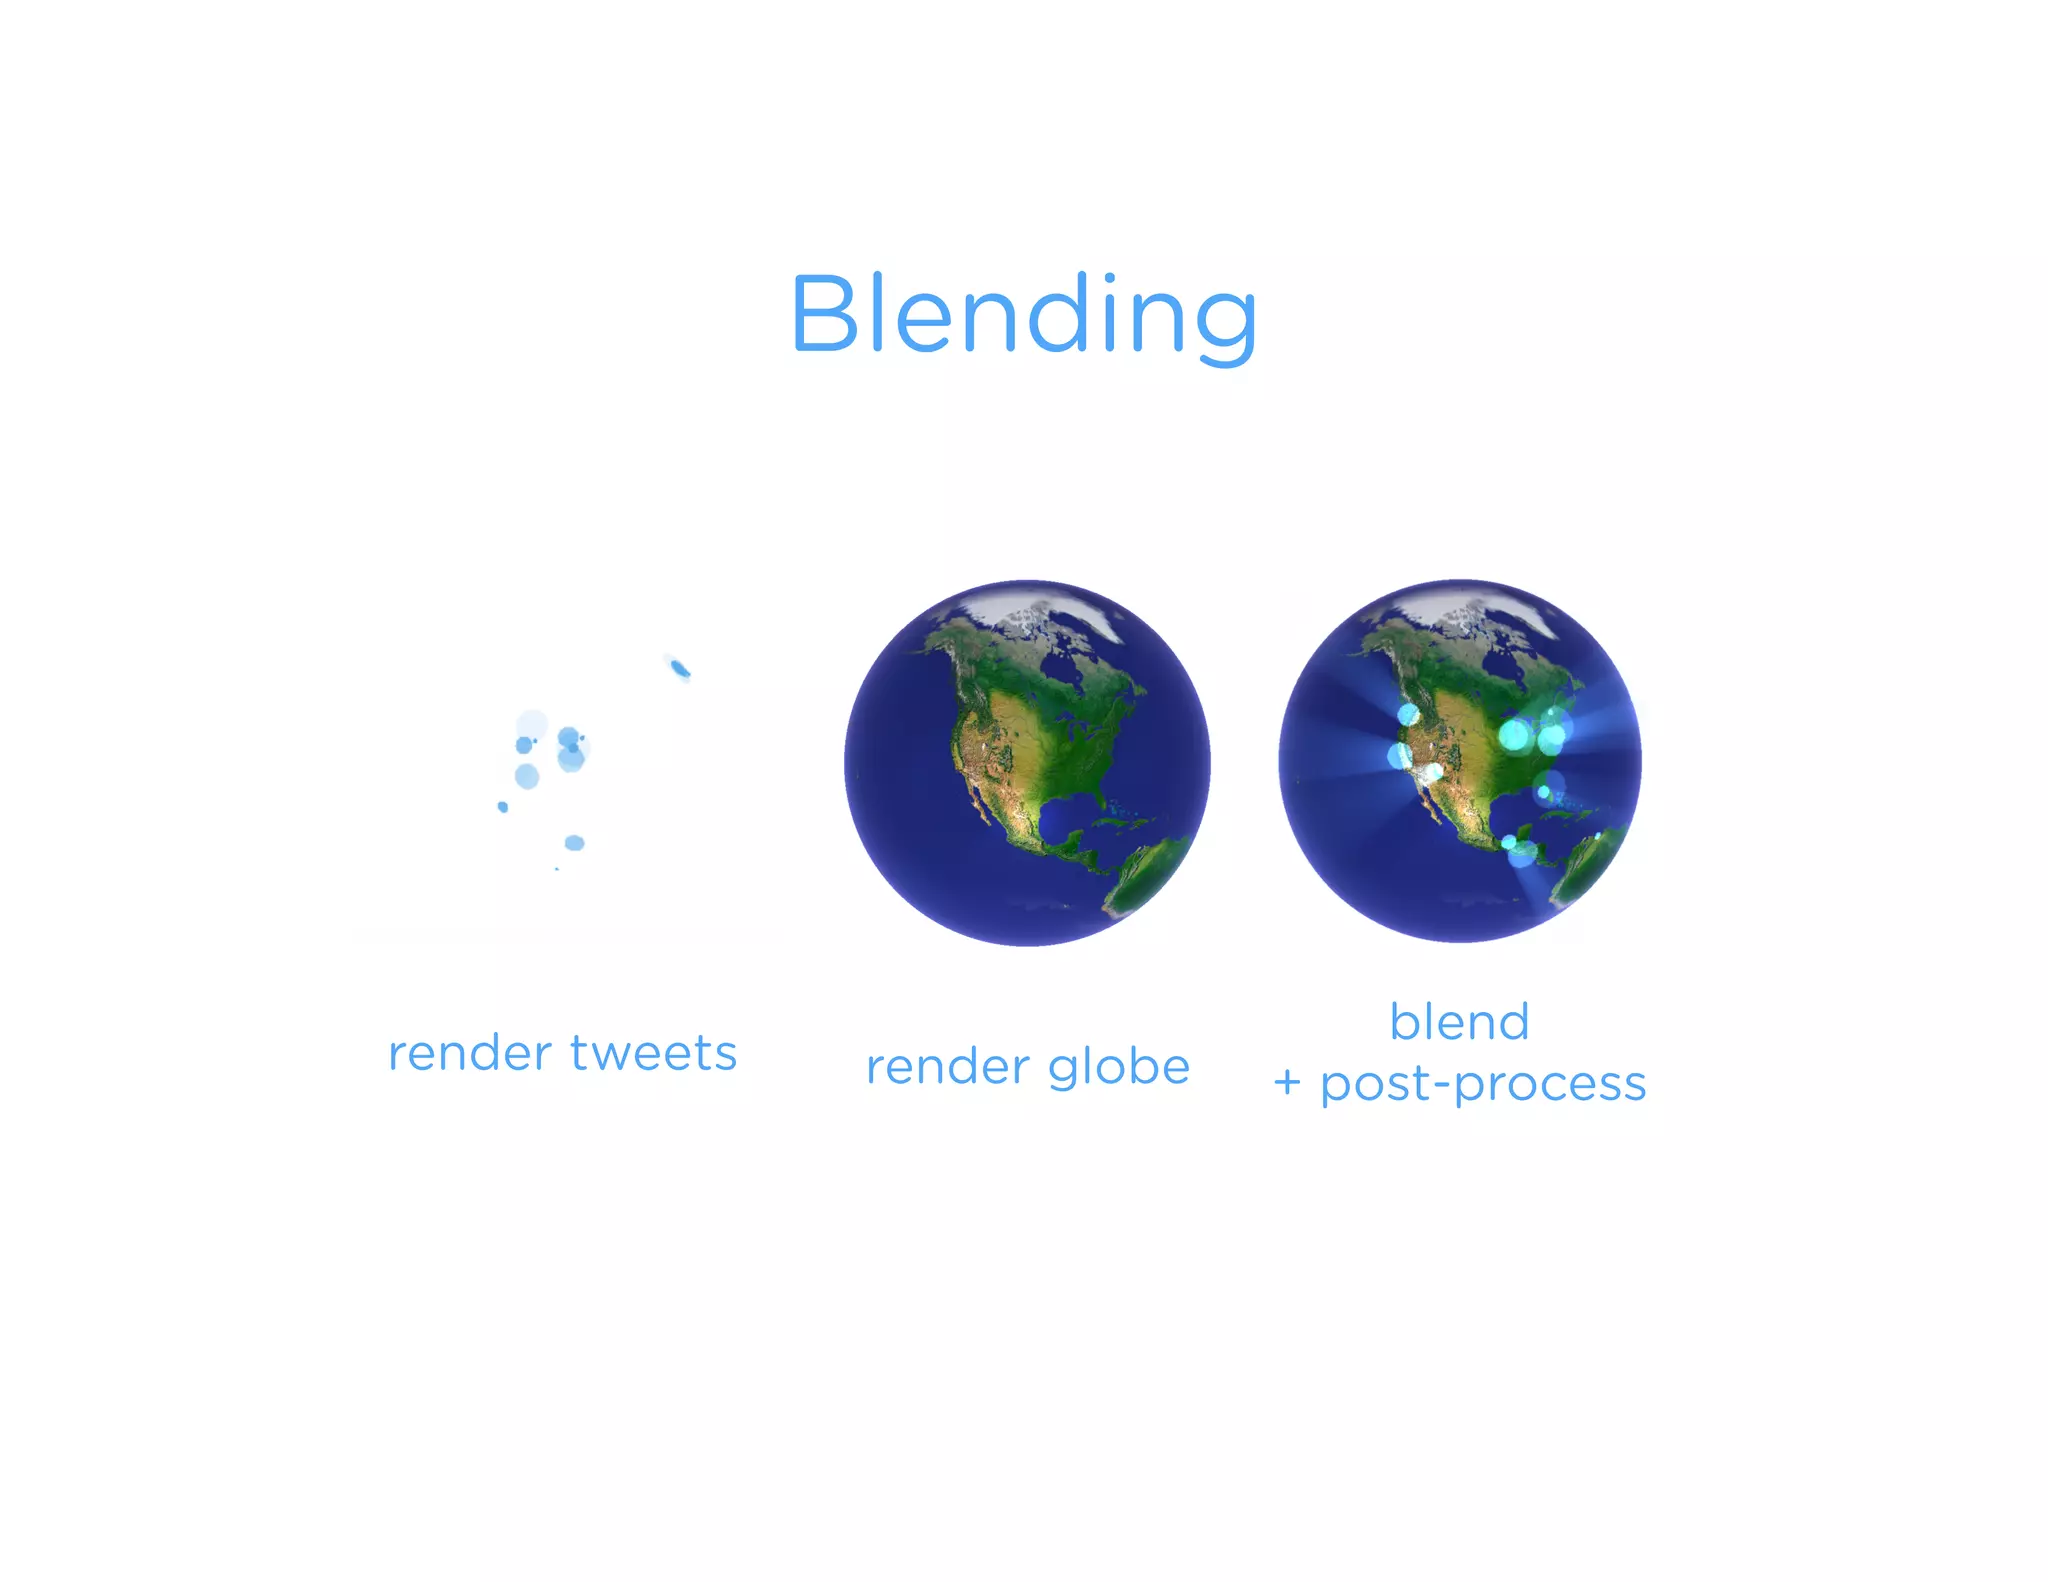
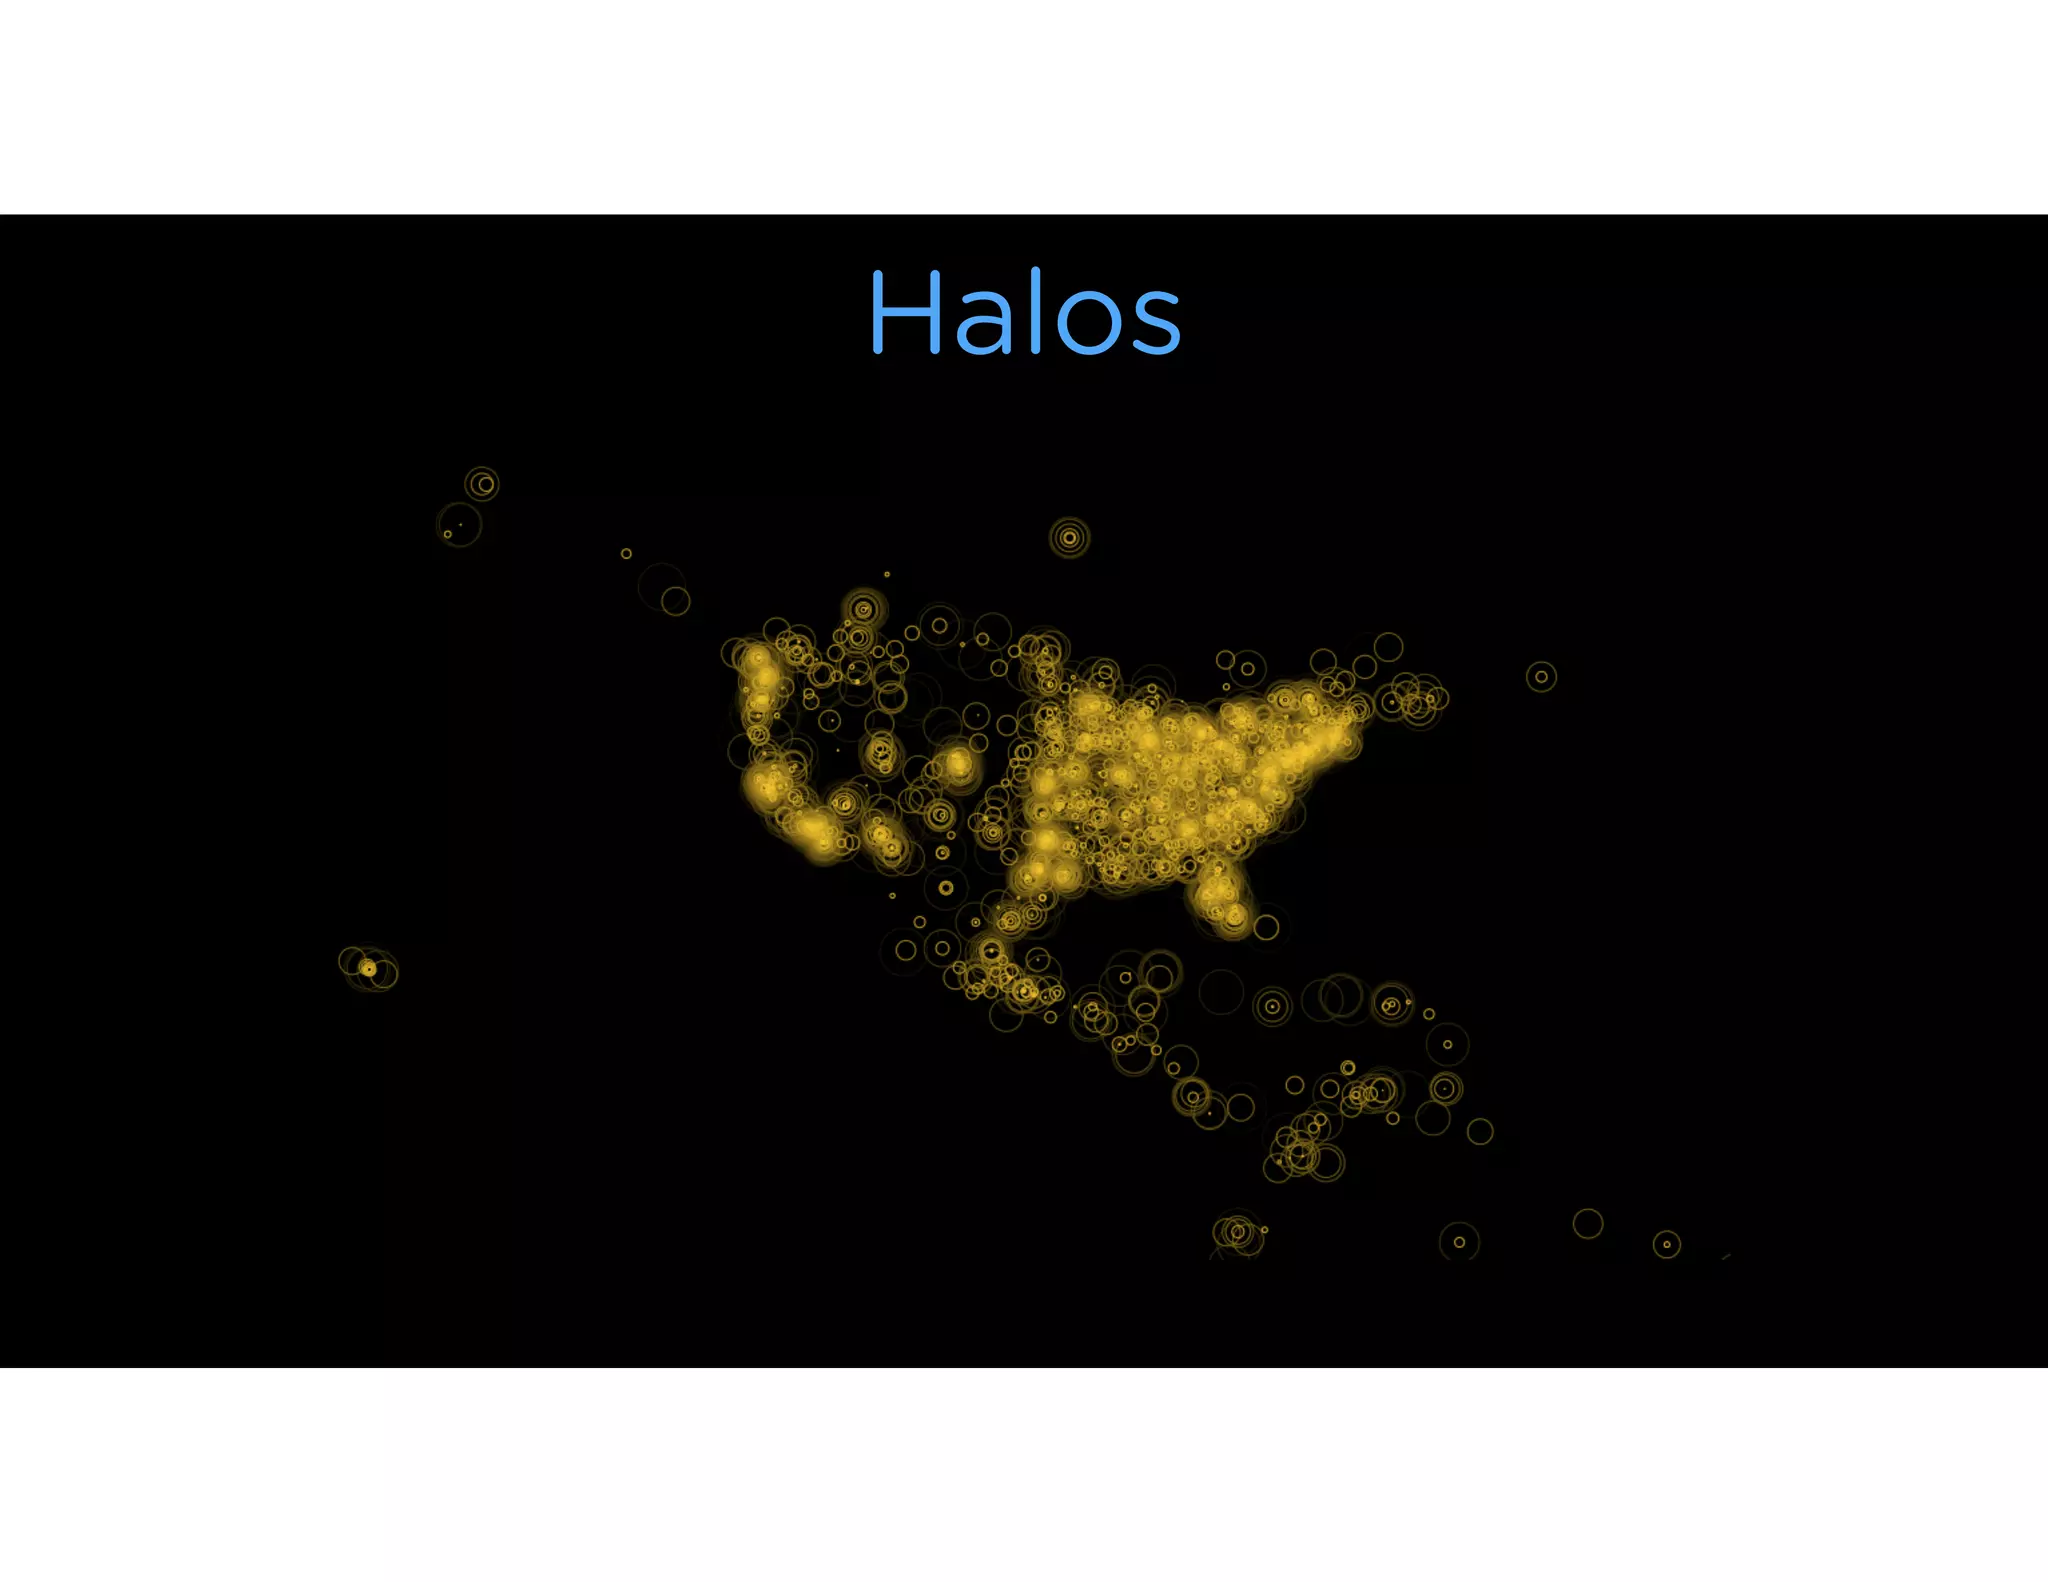
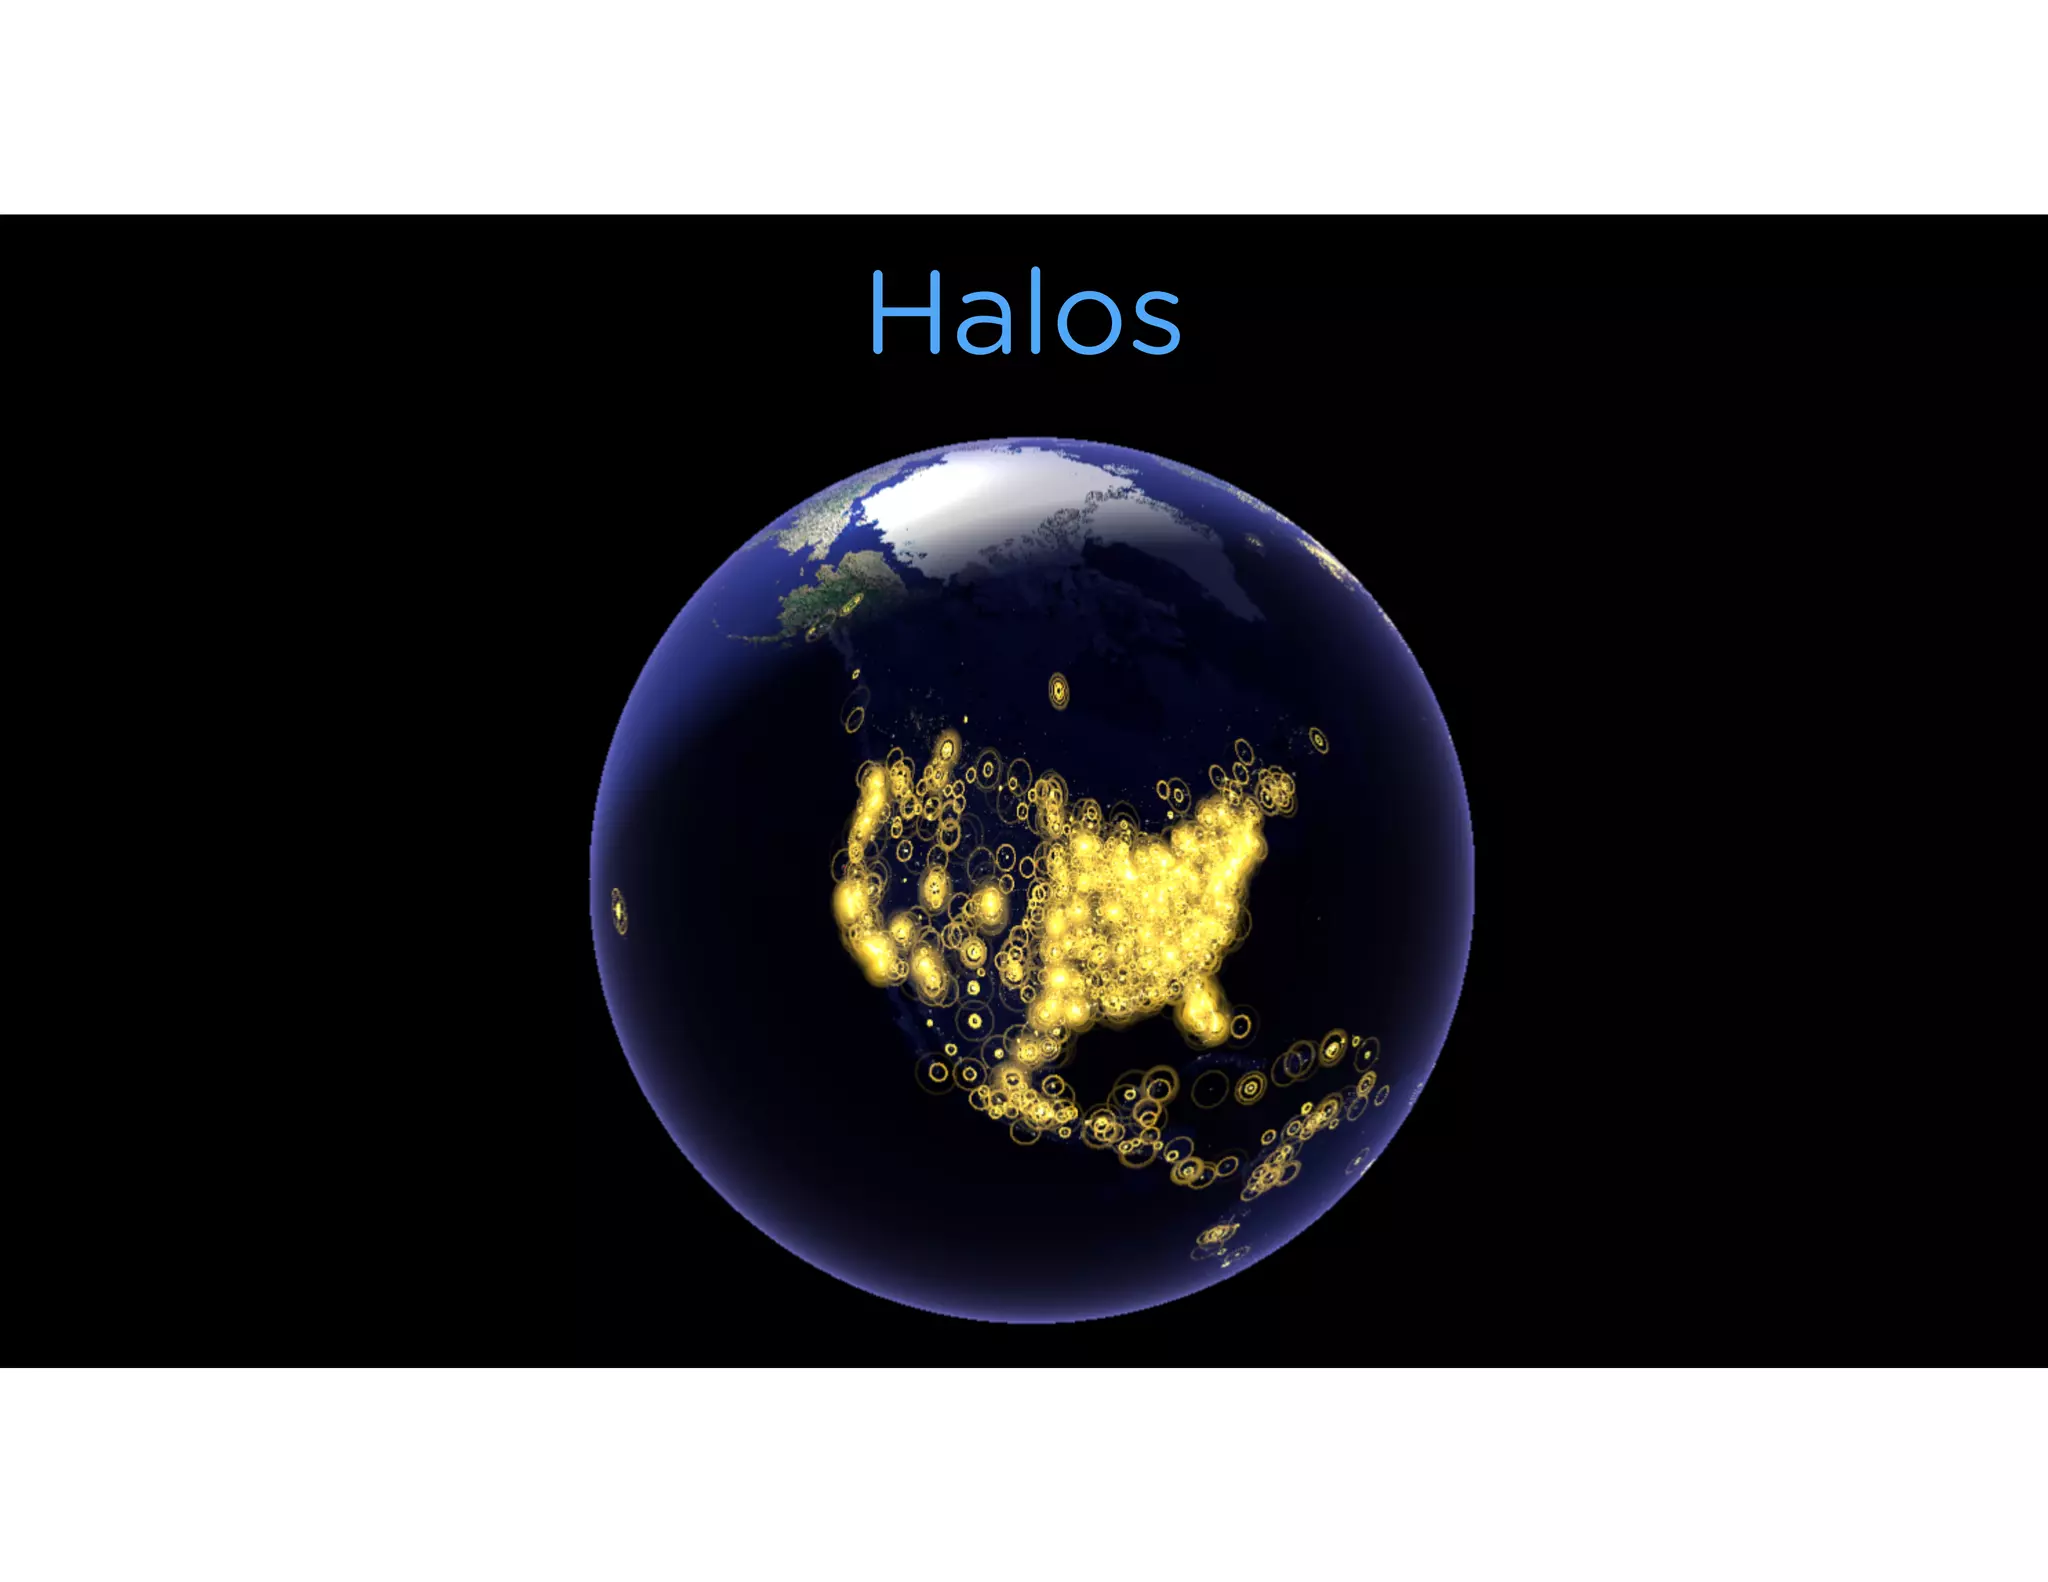
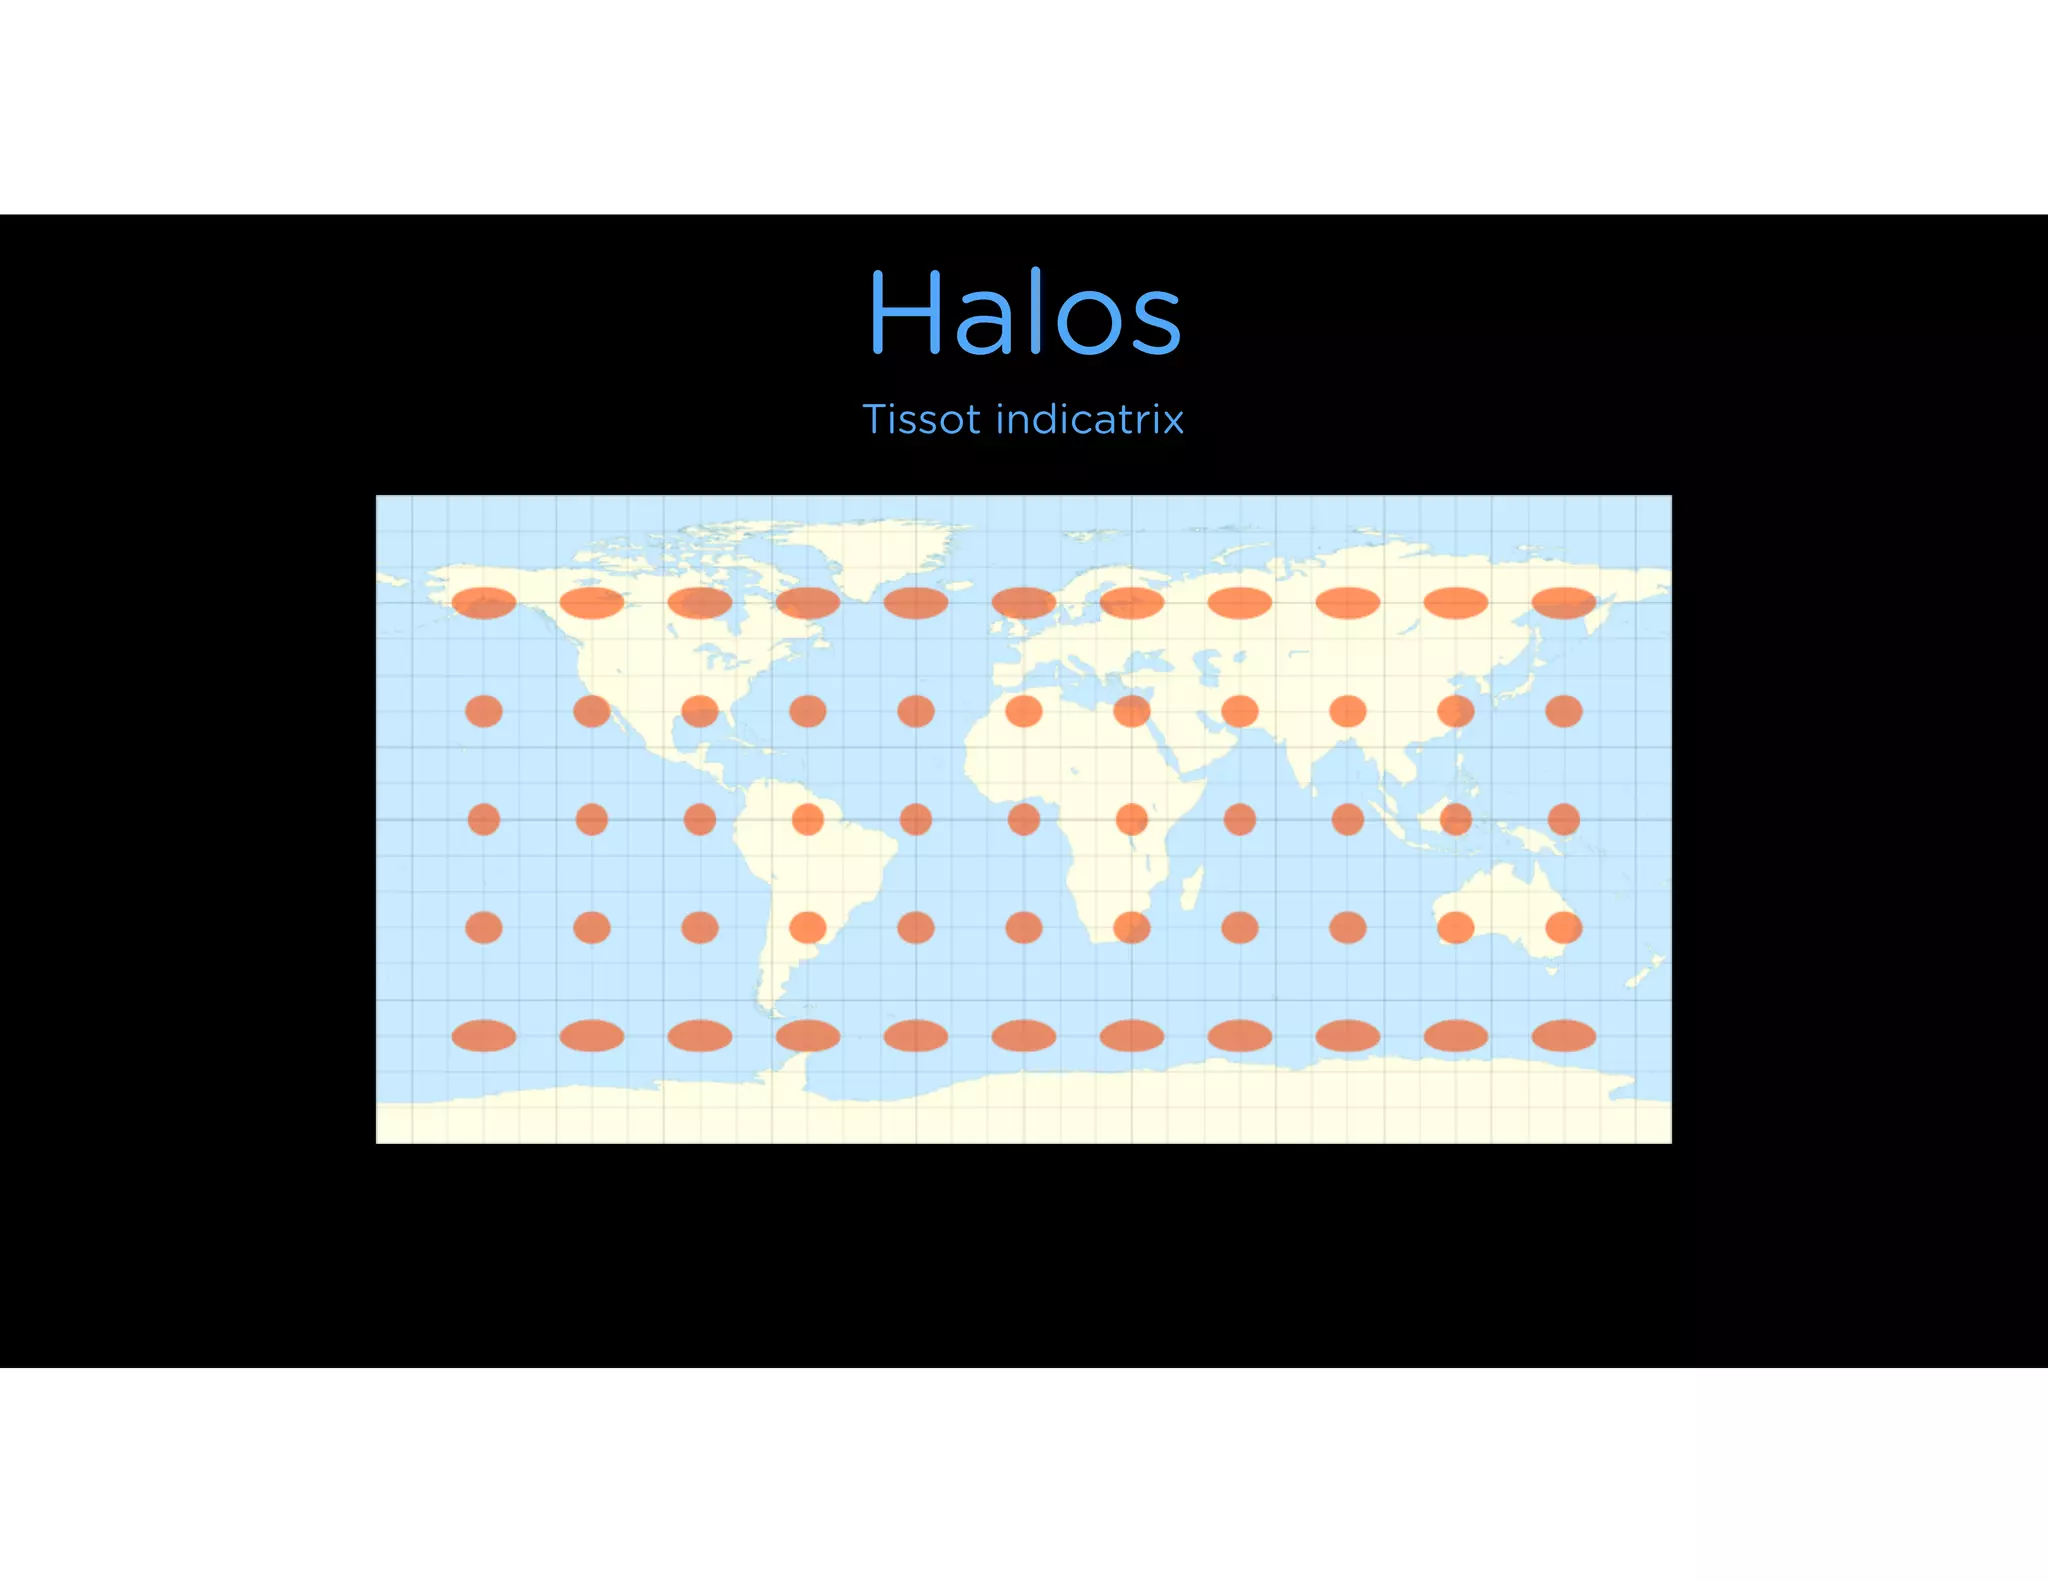
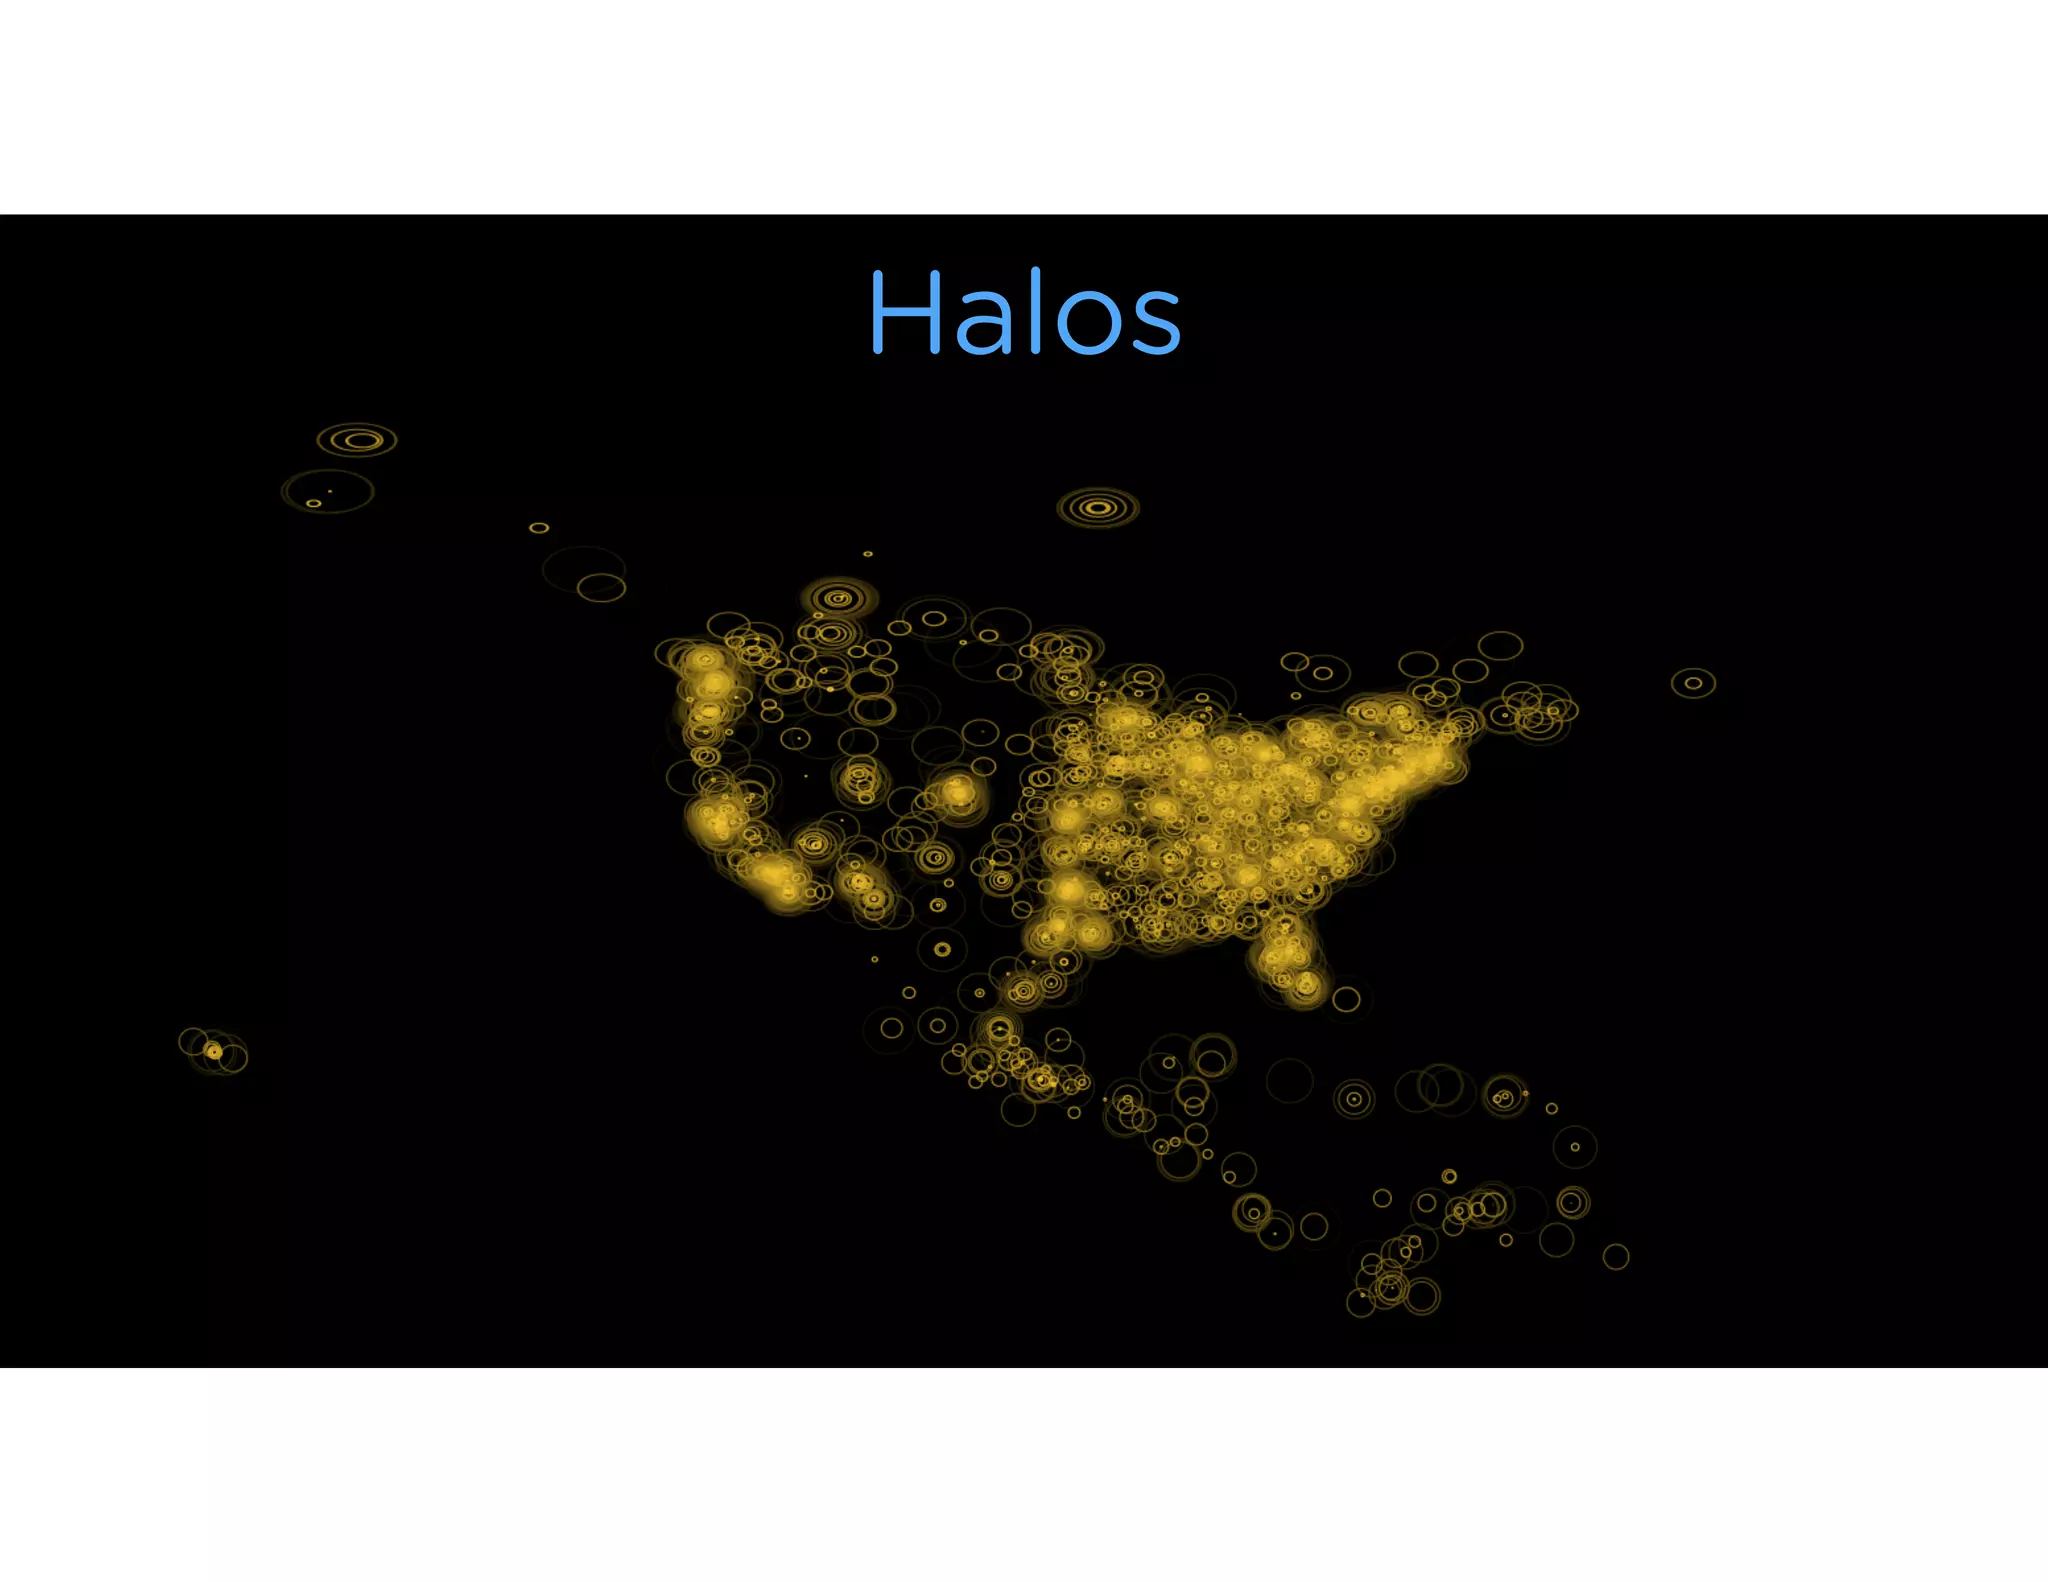
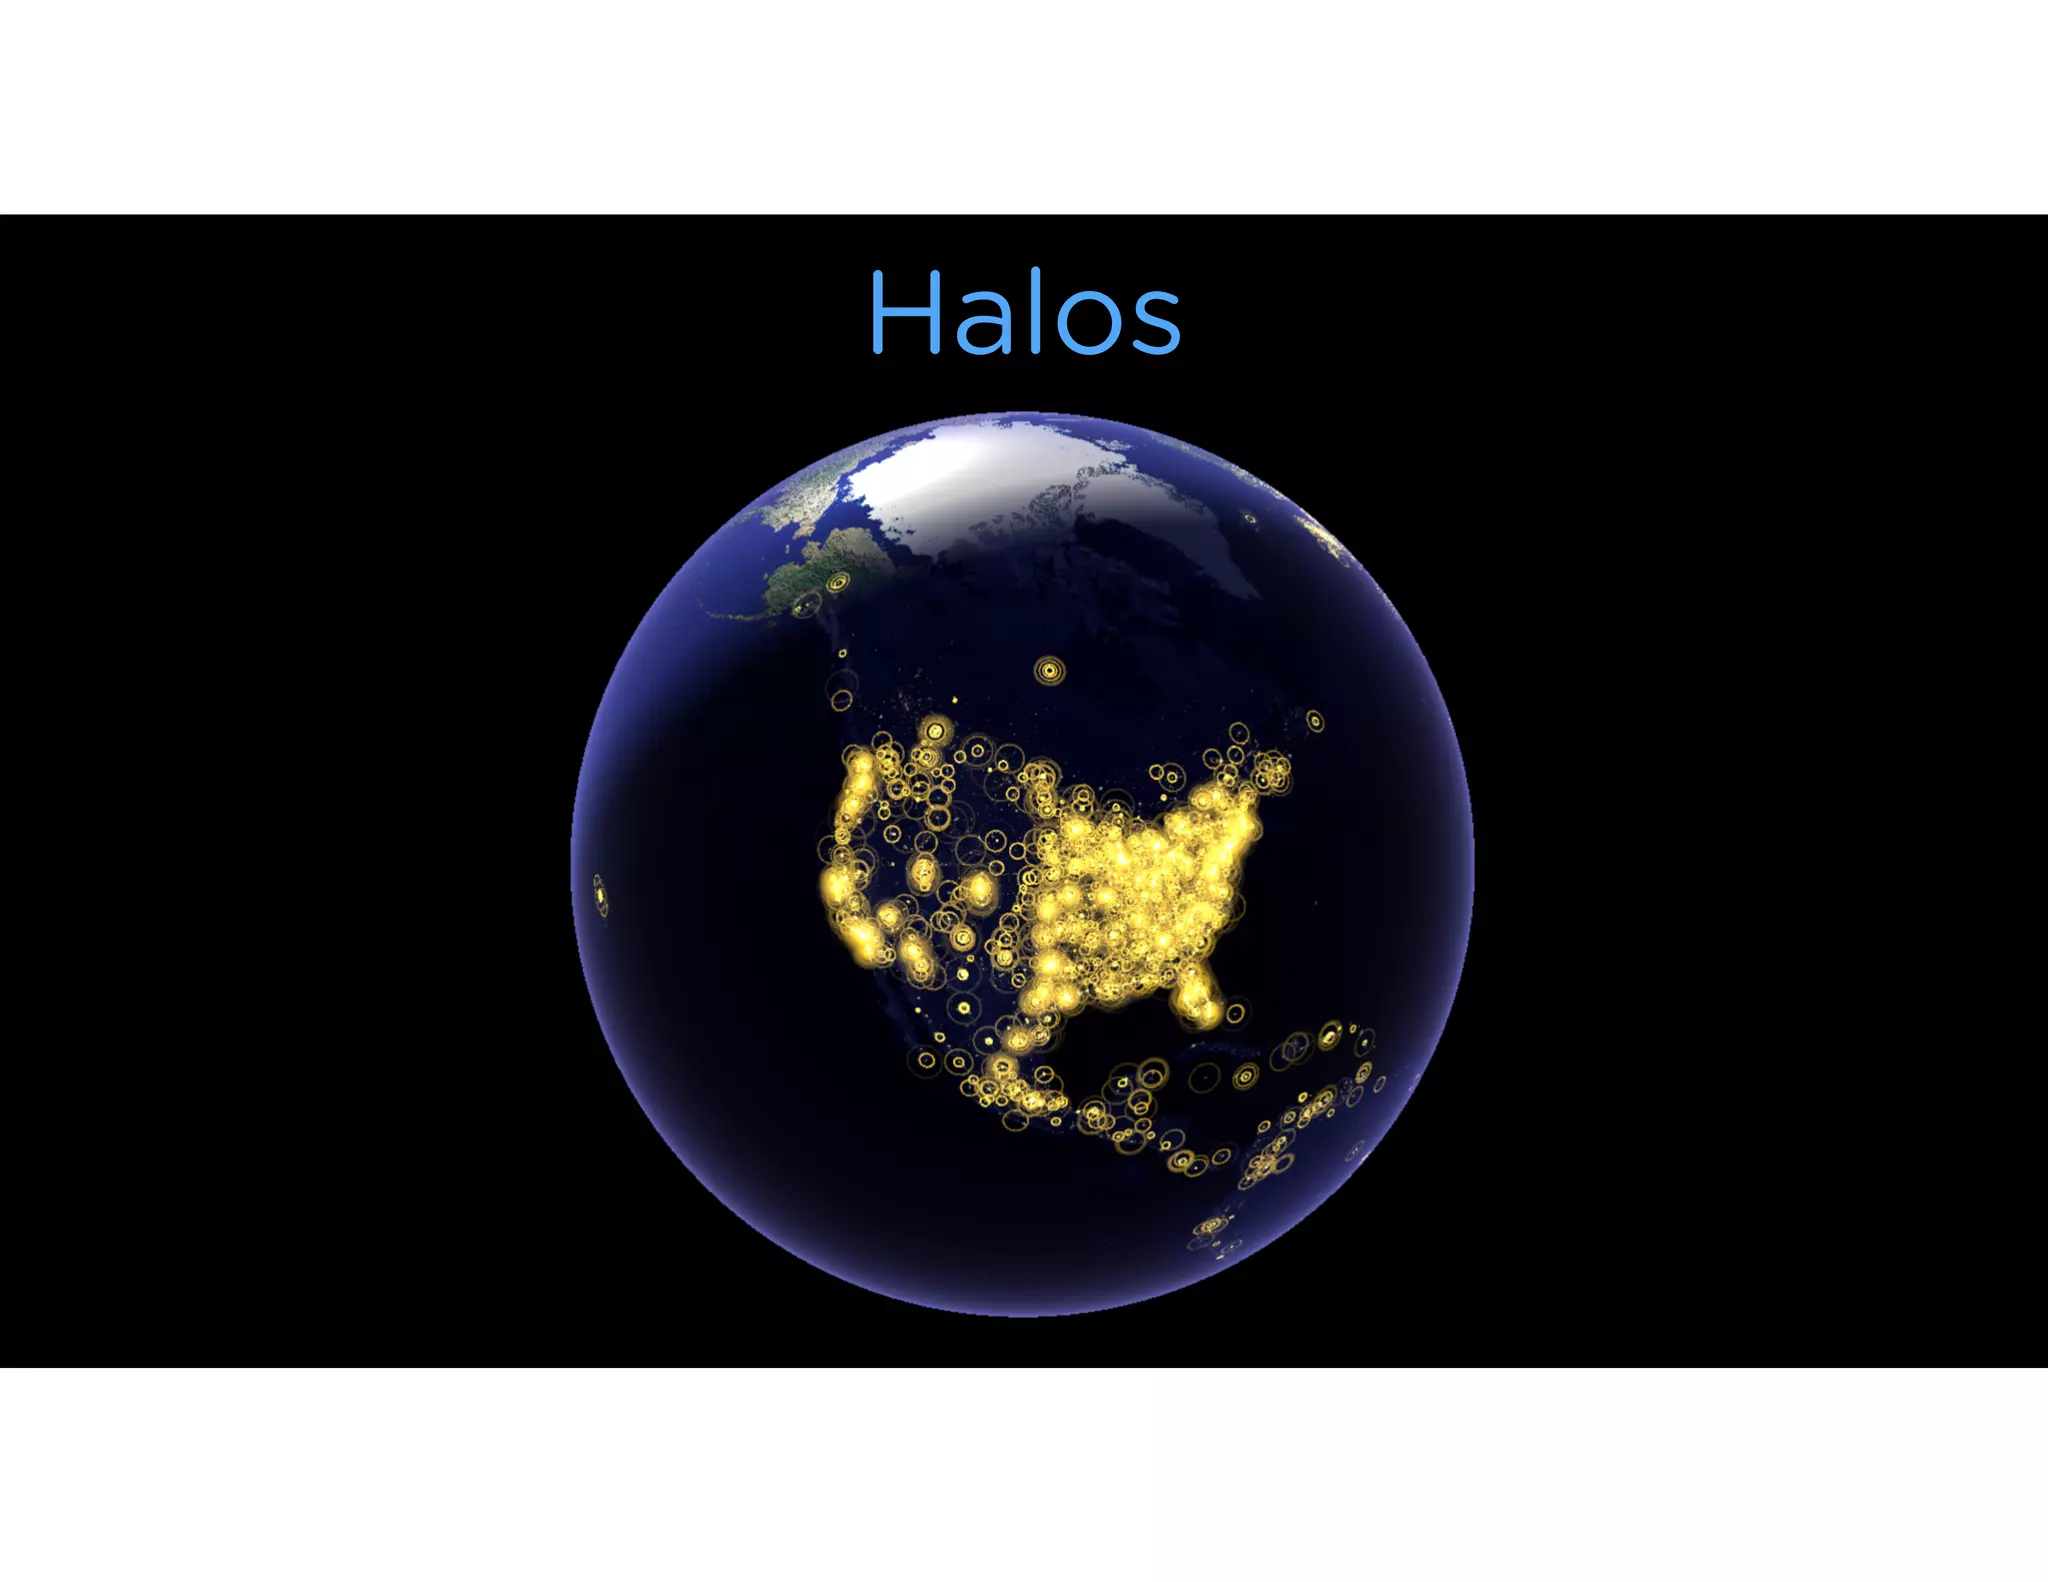
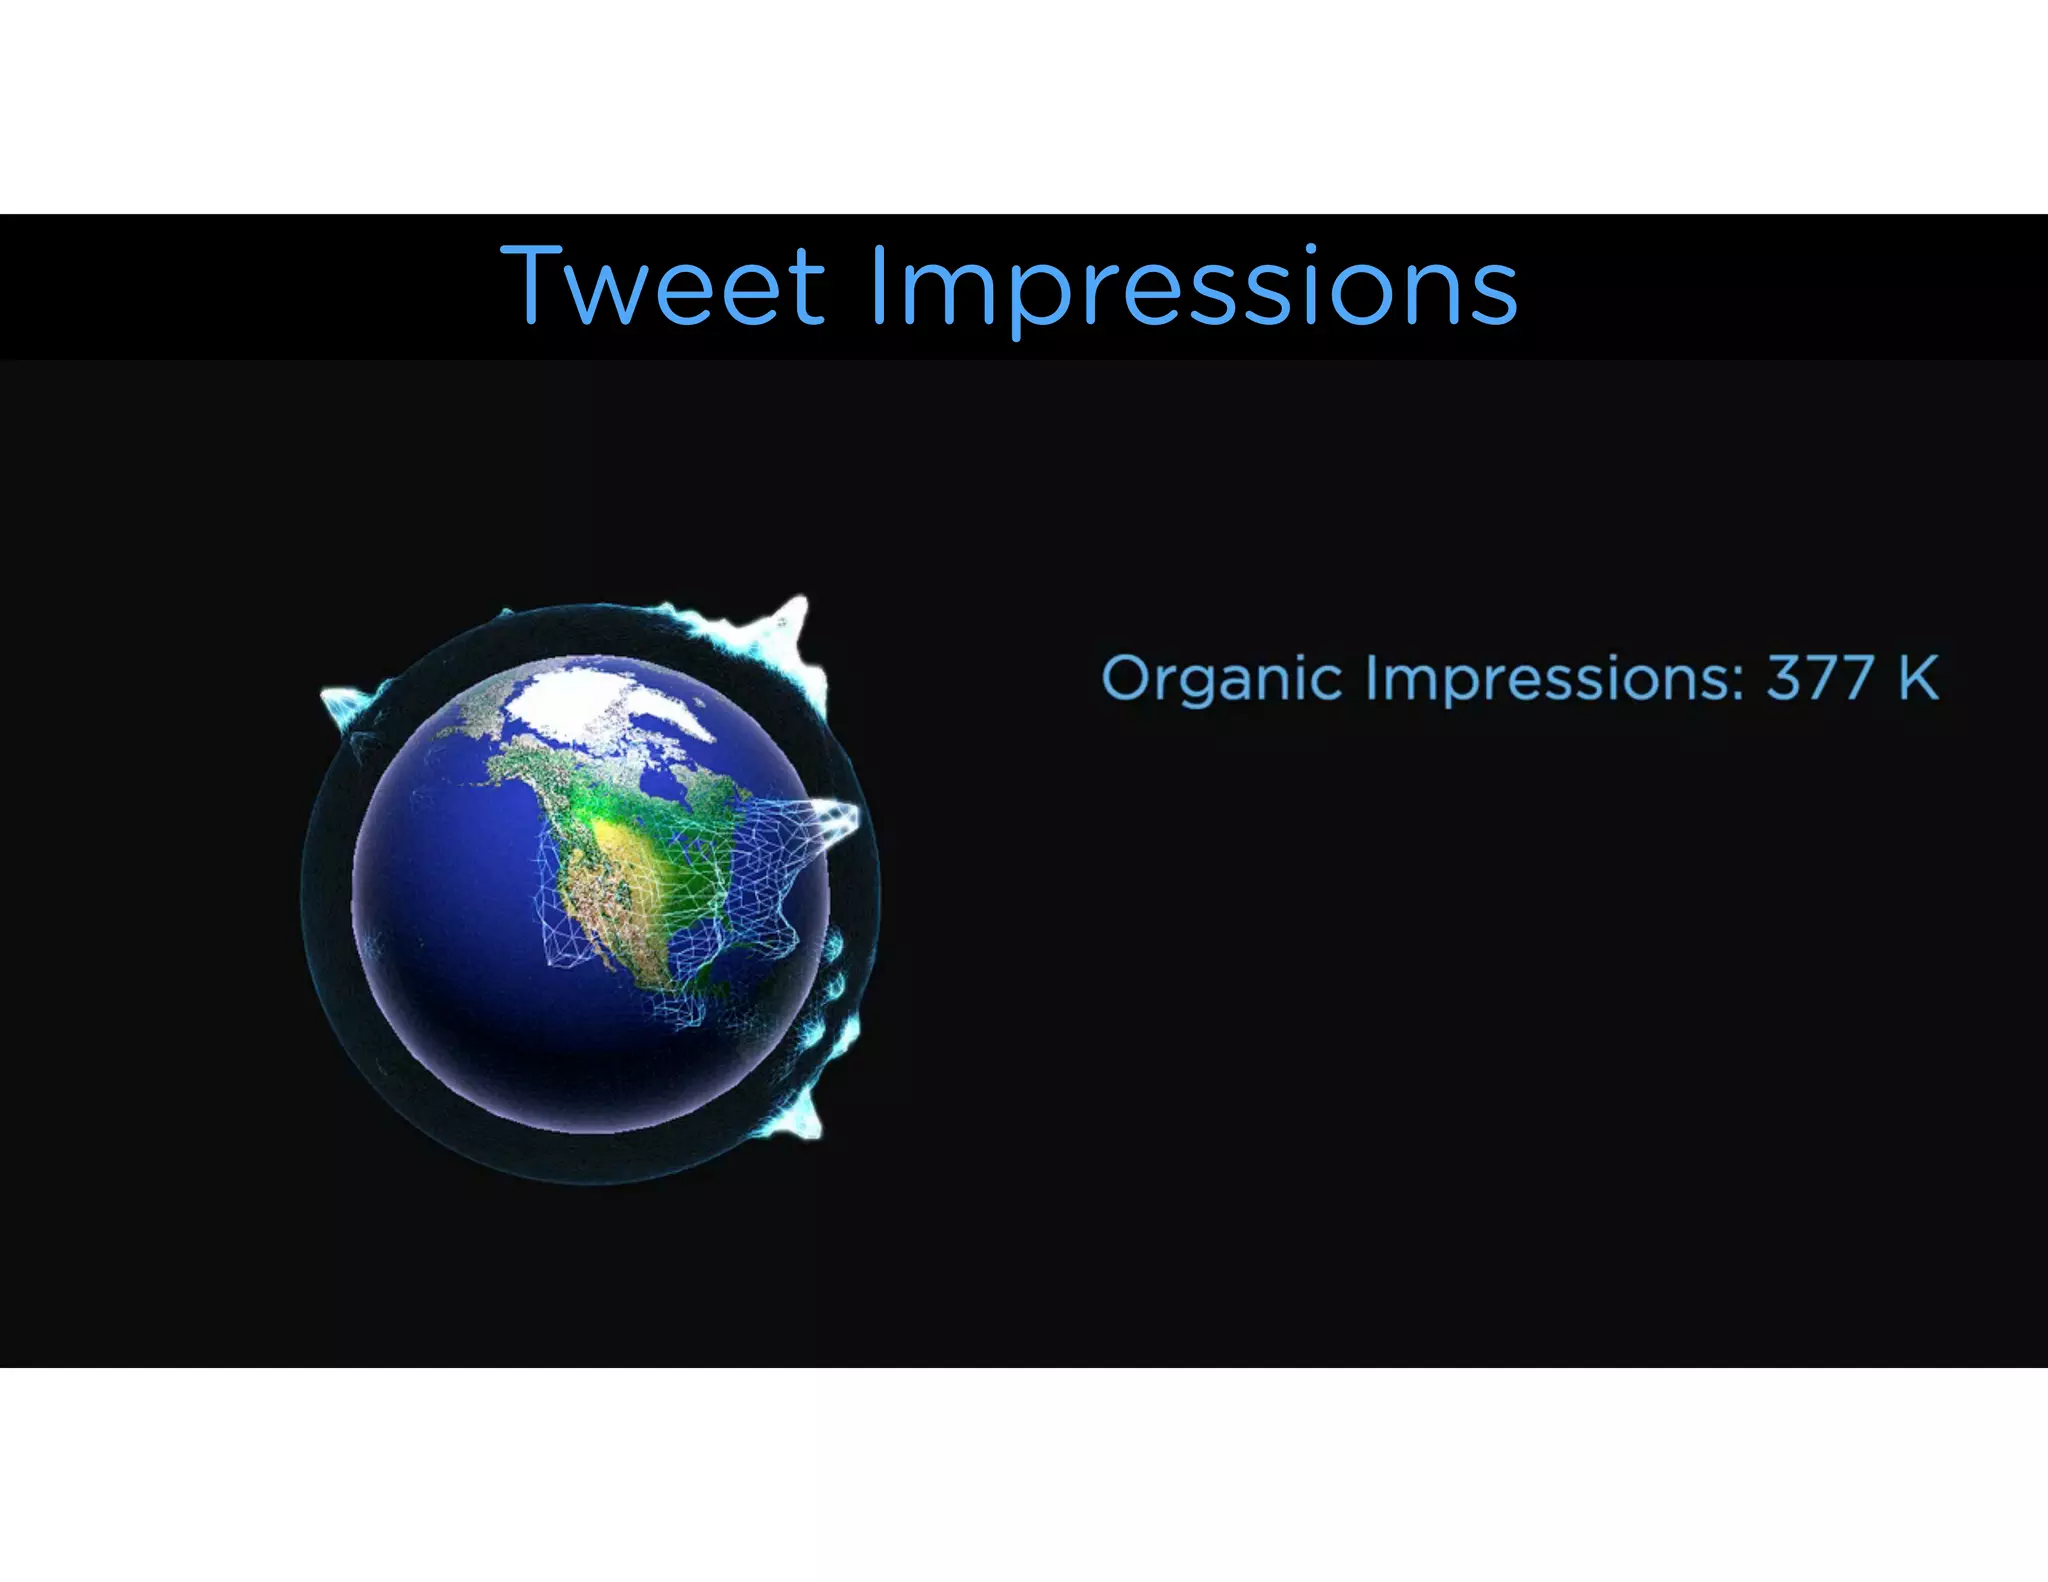

This document summarizes techniques for hacking public-facing visualizations on Twitter, including novel visualization techniques using data processing and rendering, as well as specific graphics techniques like blending tweets and globe renders, using halos, and mapping pixel color to geographic and population metadata. It also discusses platforms like Twitter that can enable global, real-time, and conversational visualizations.