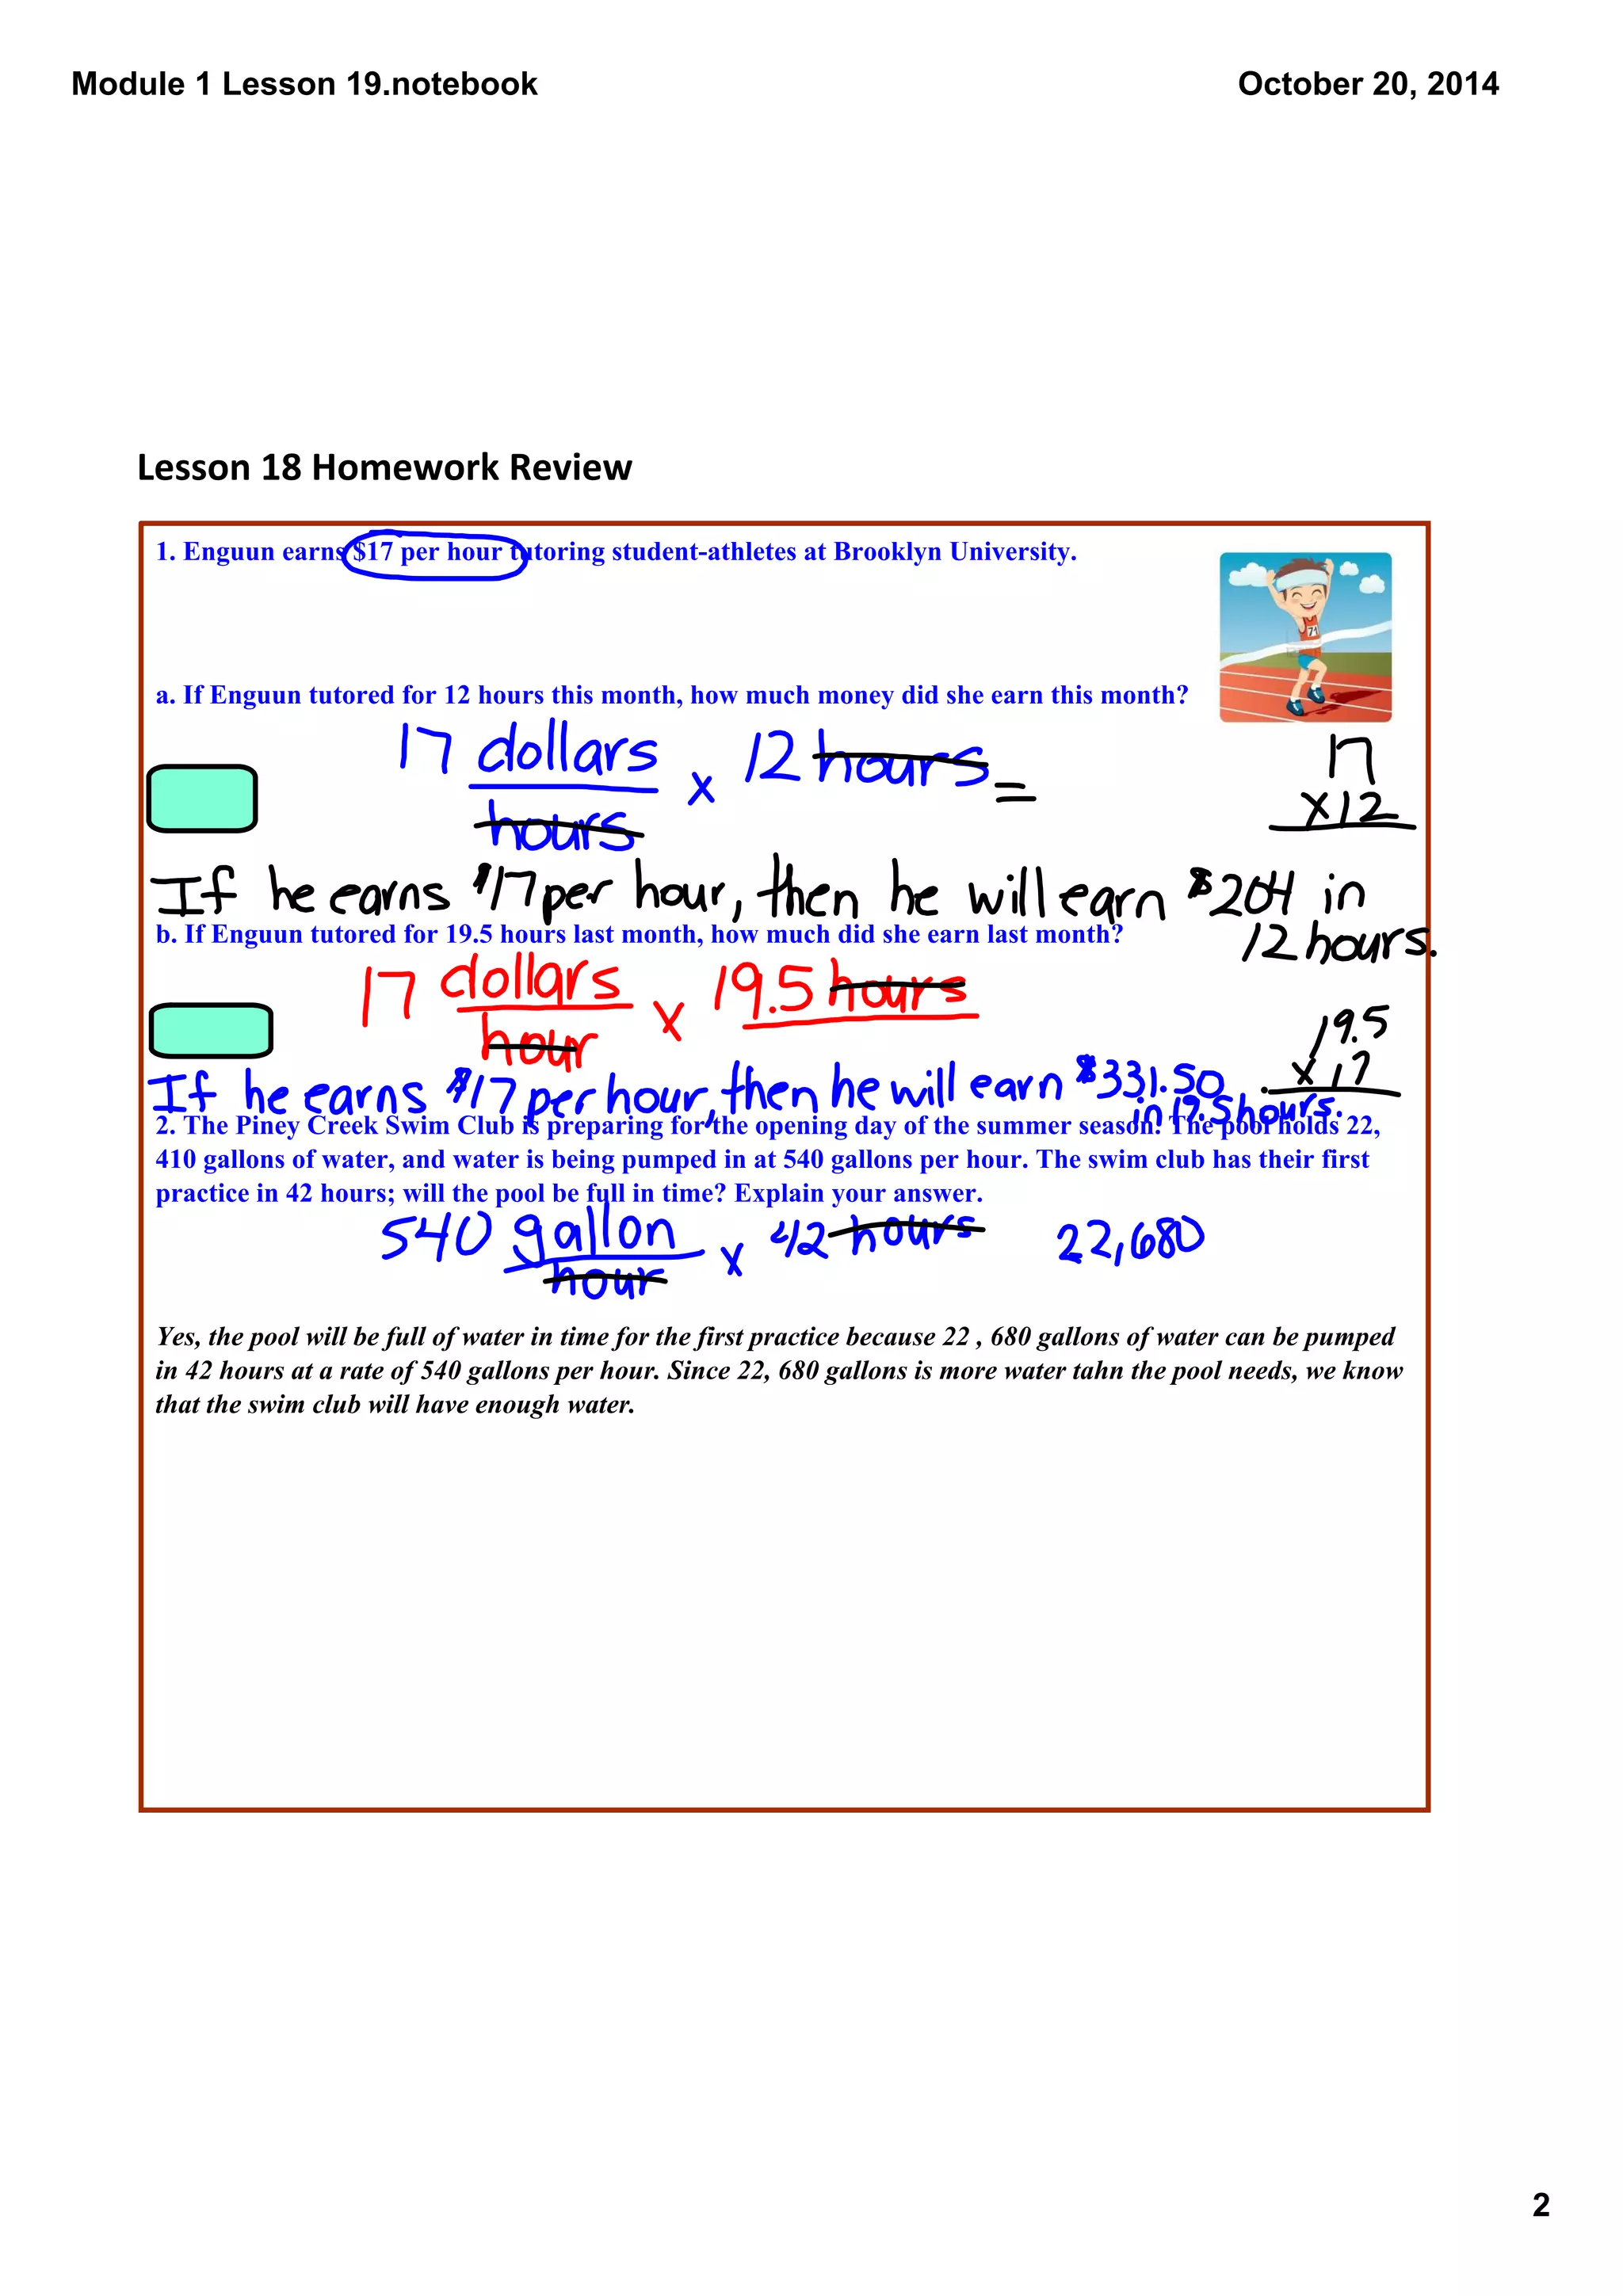
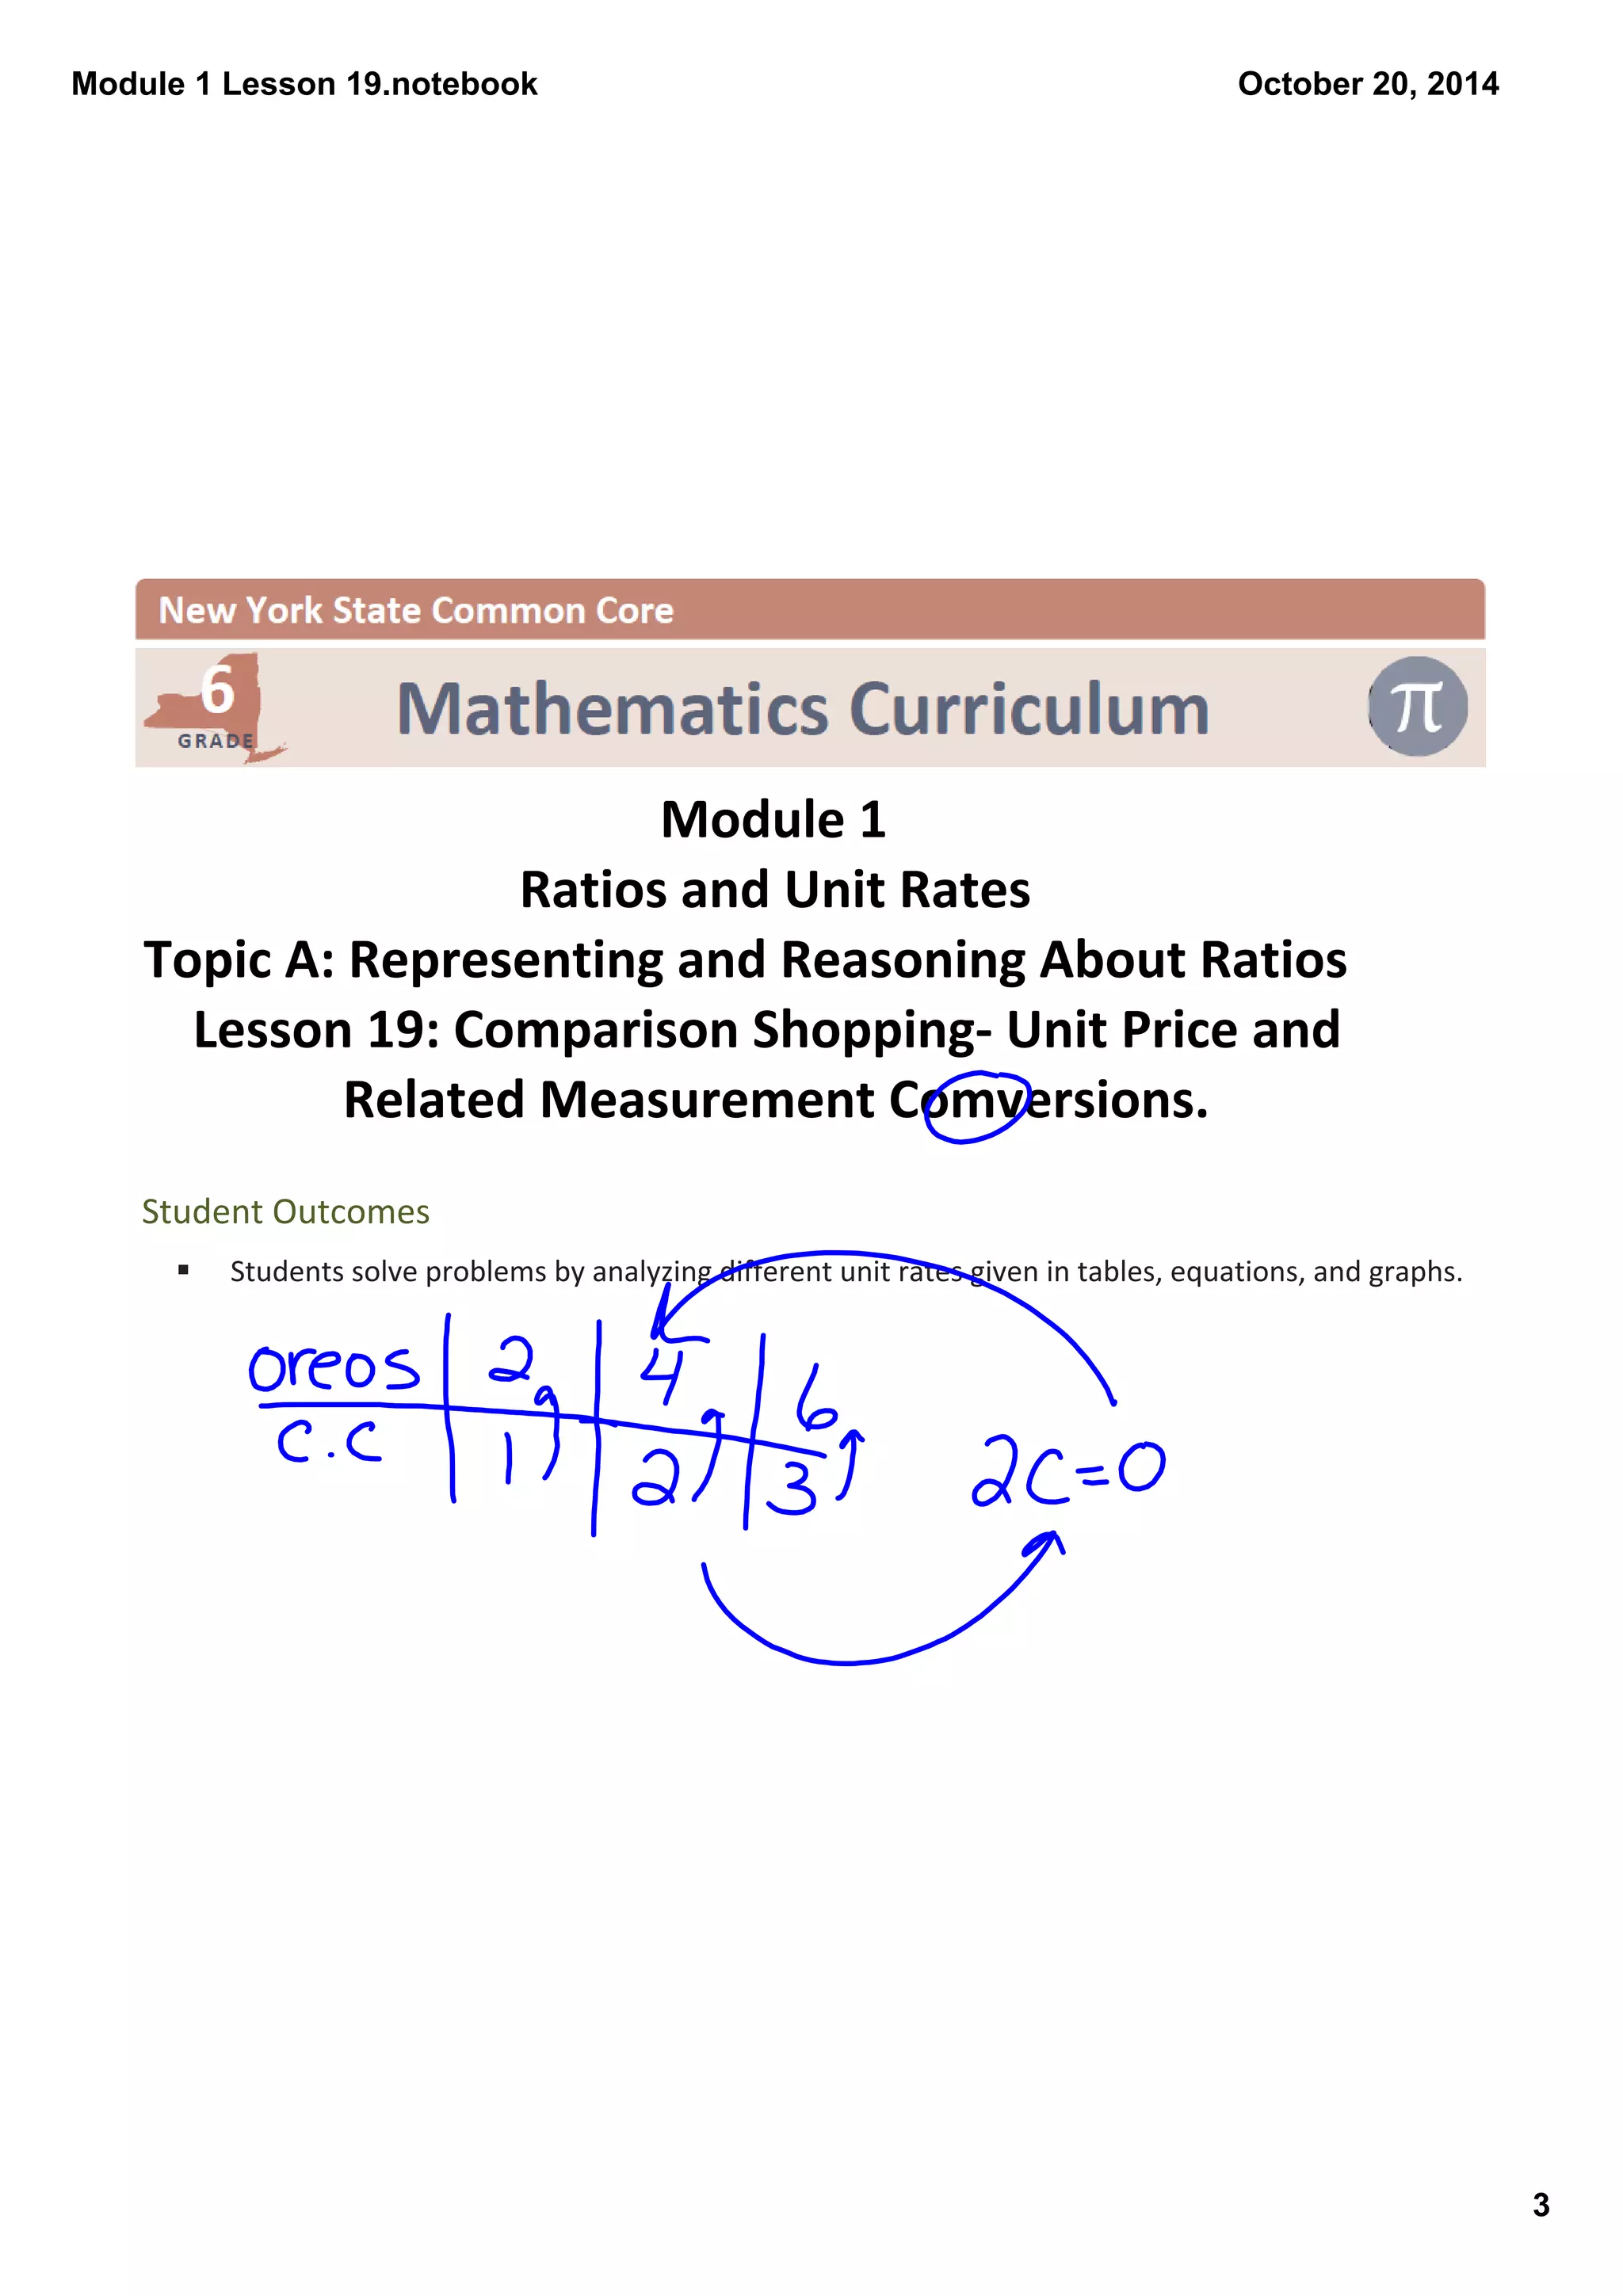
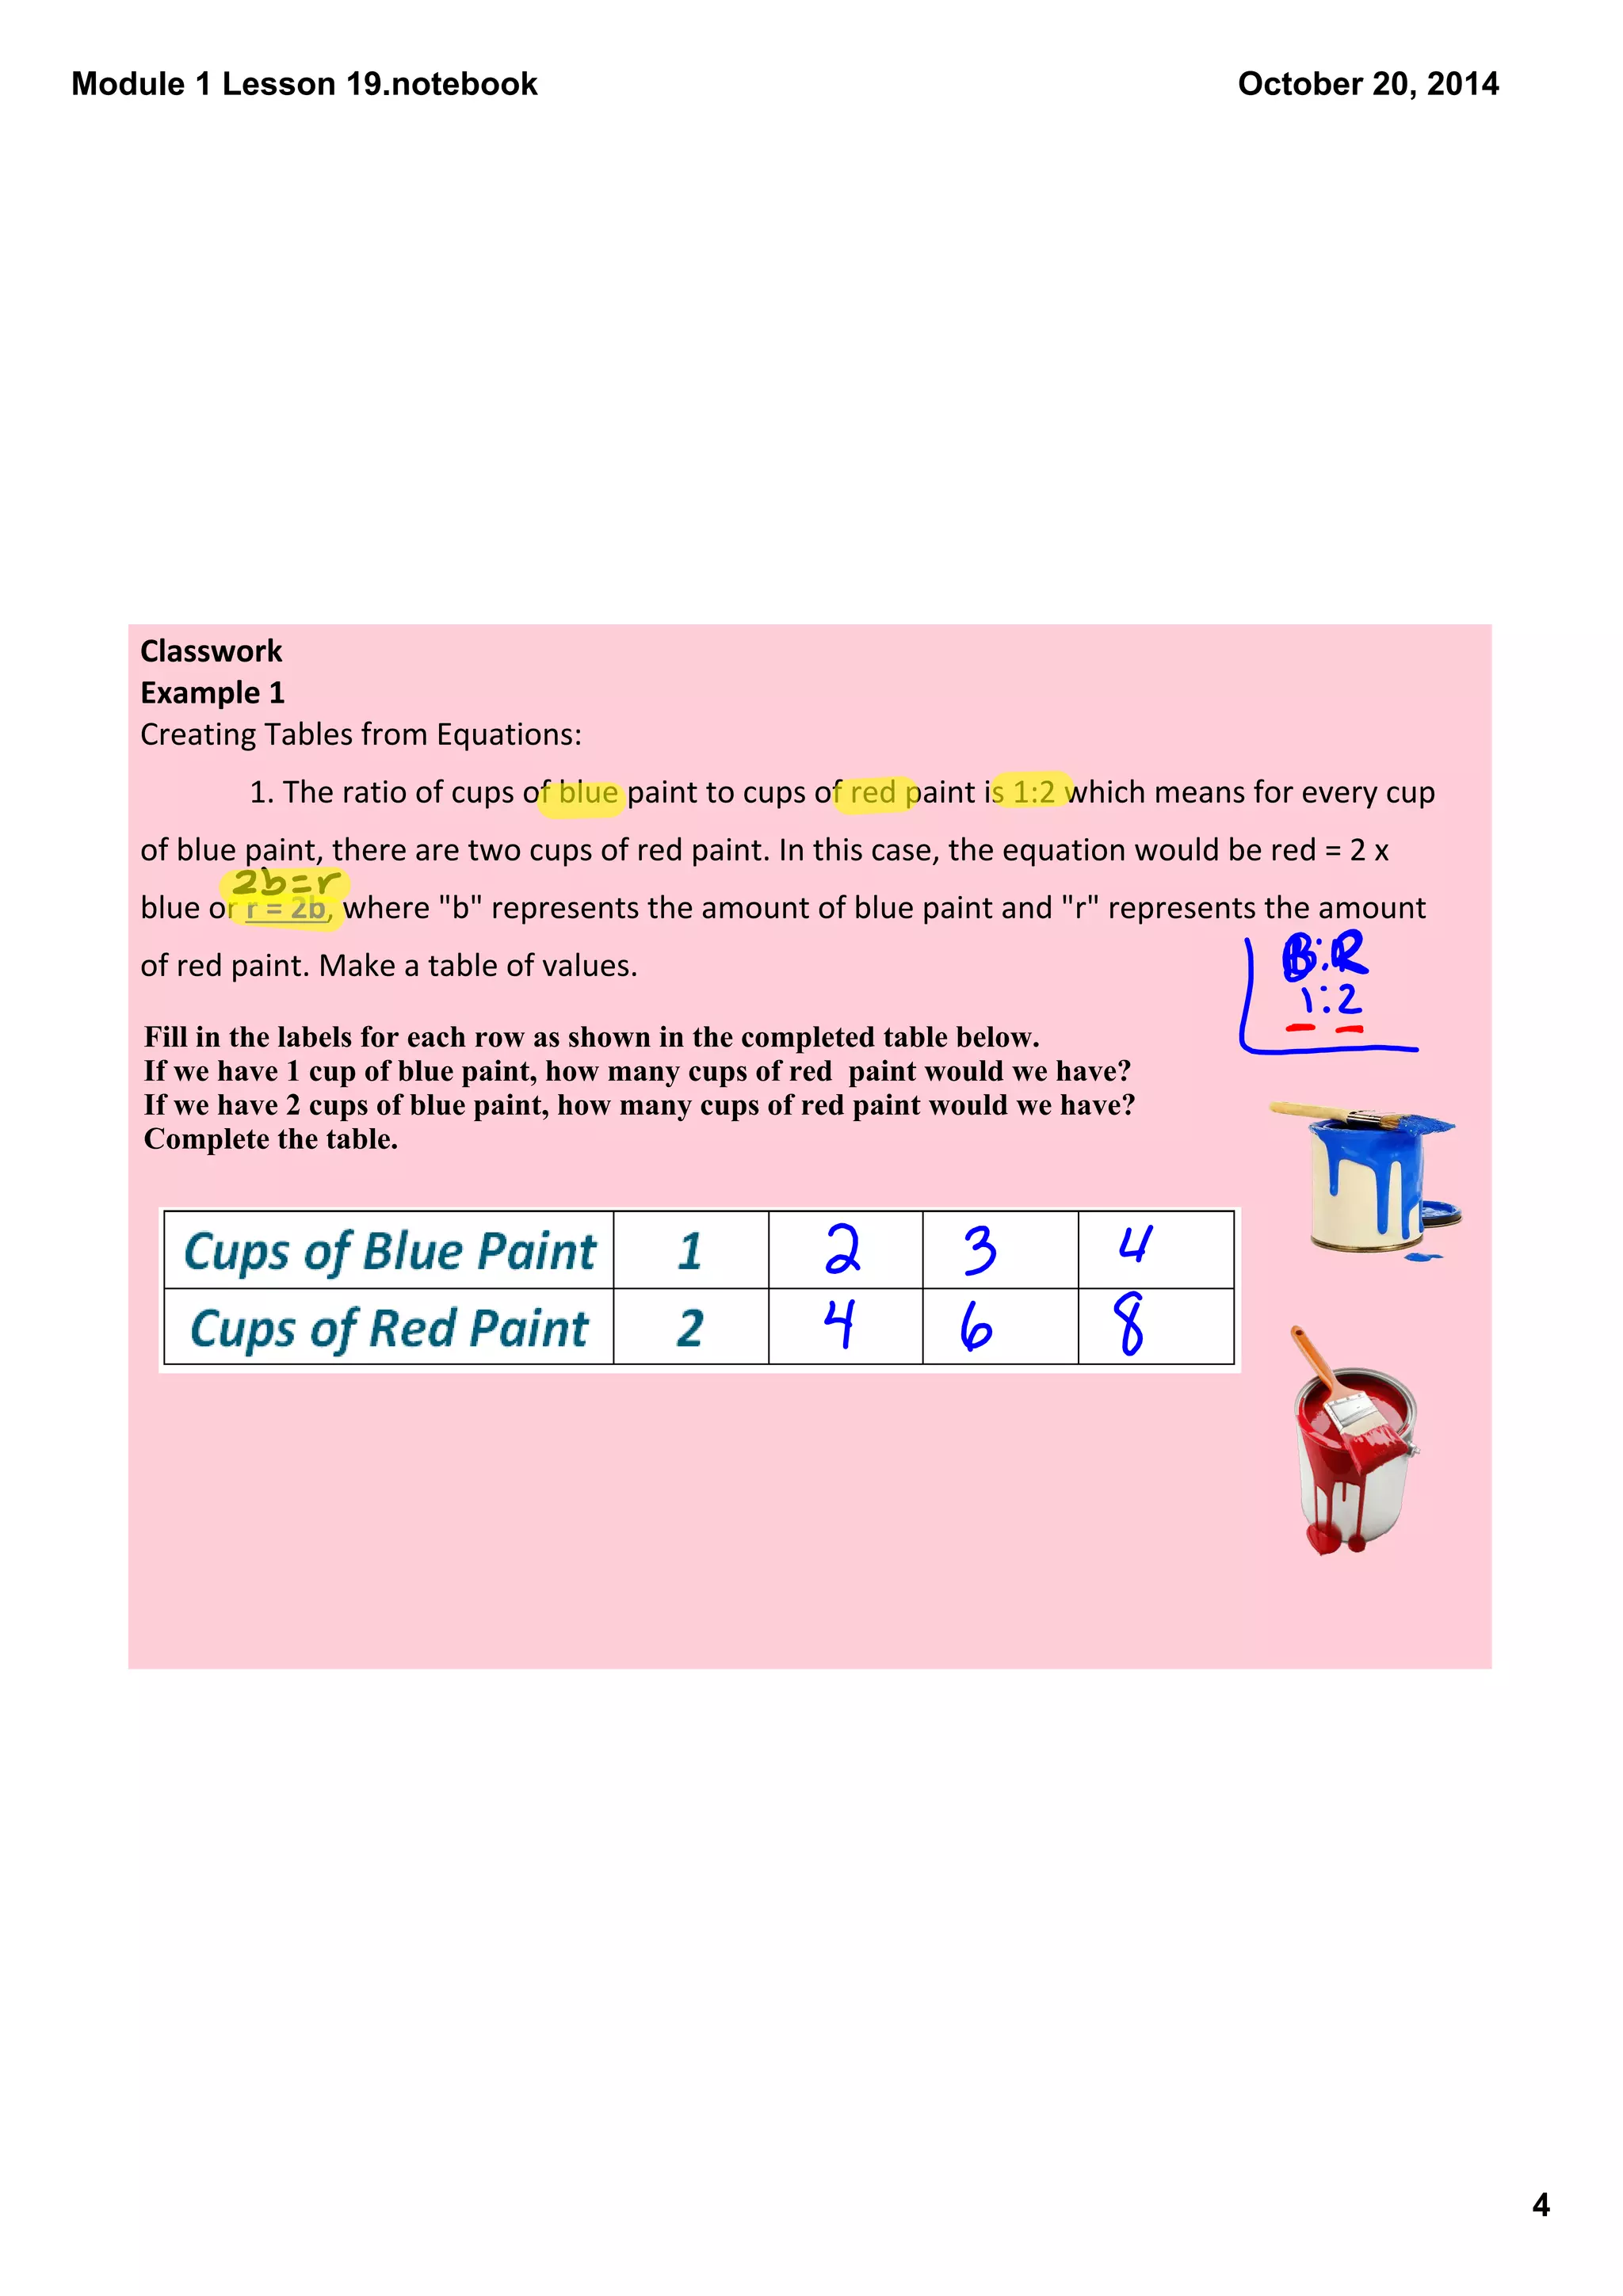
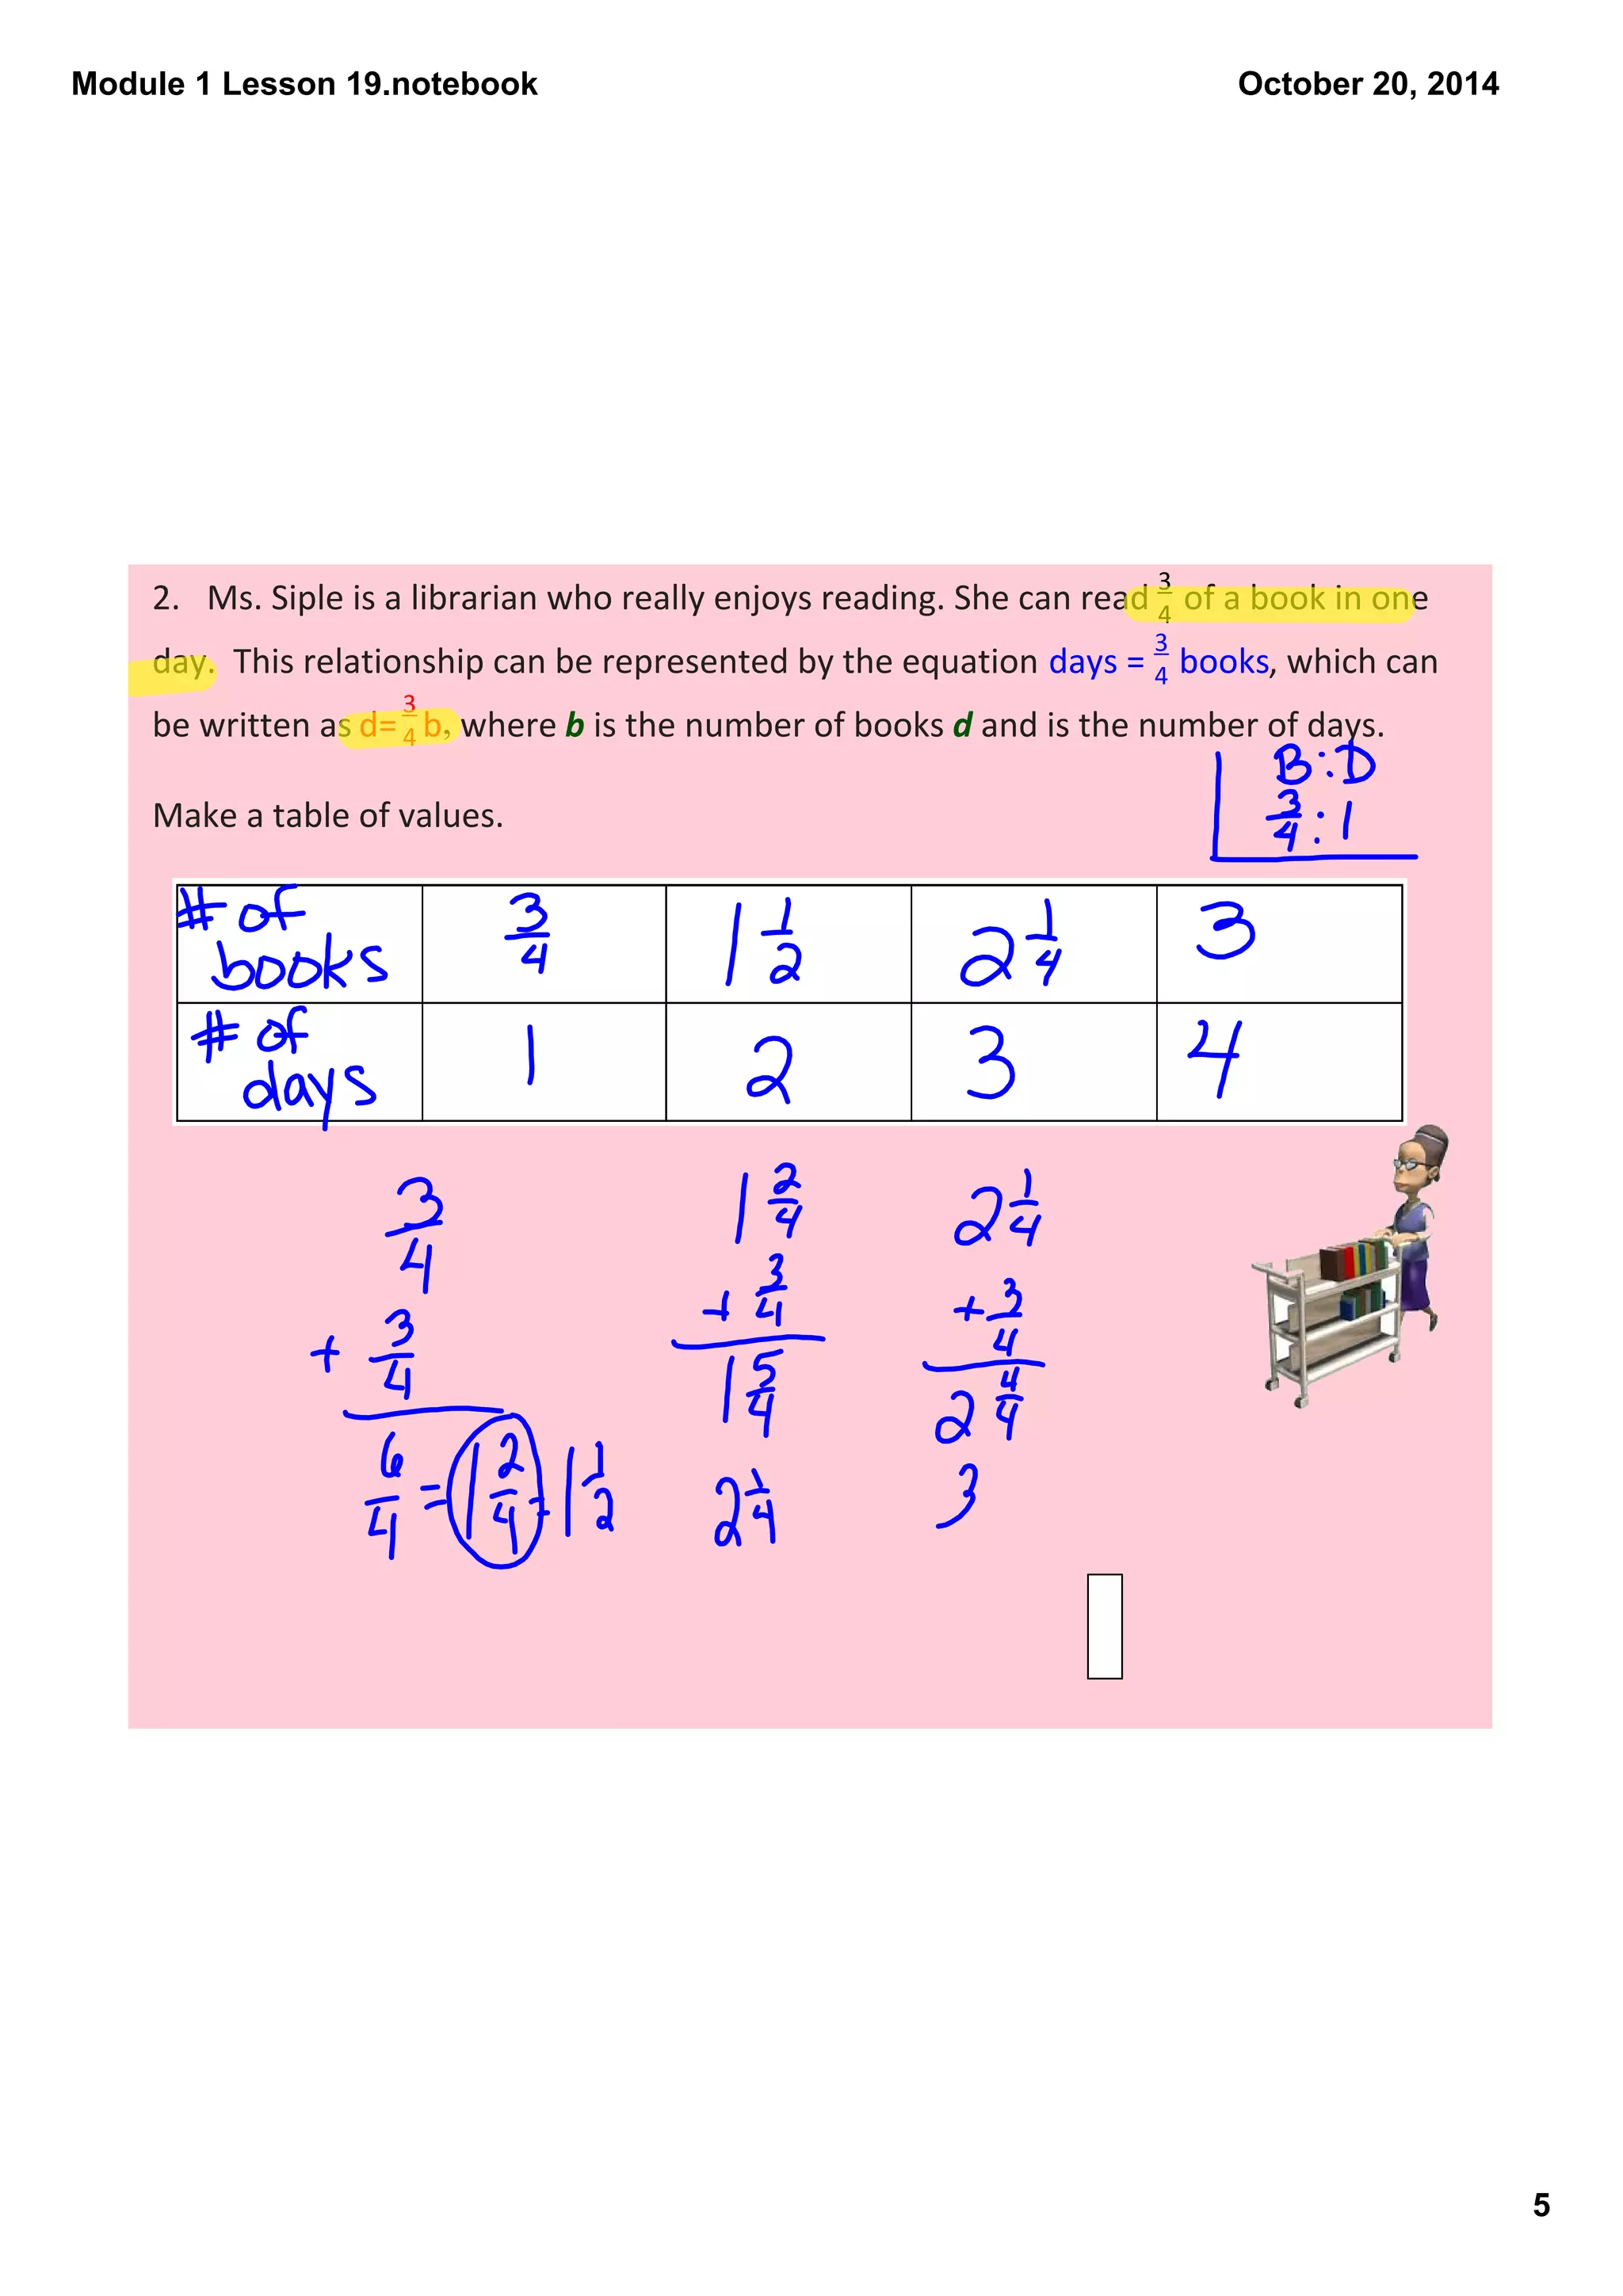
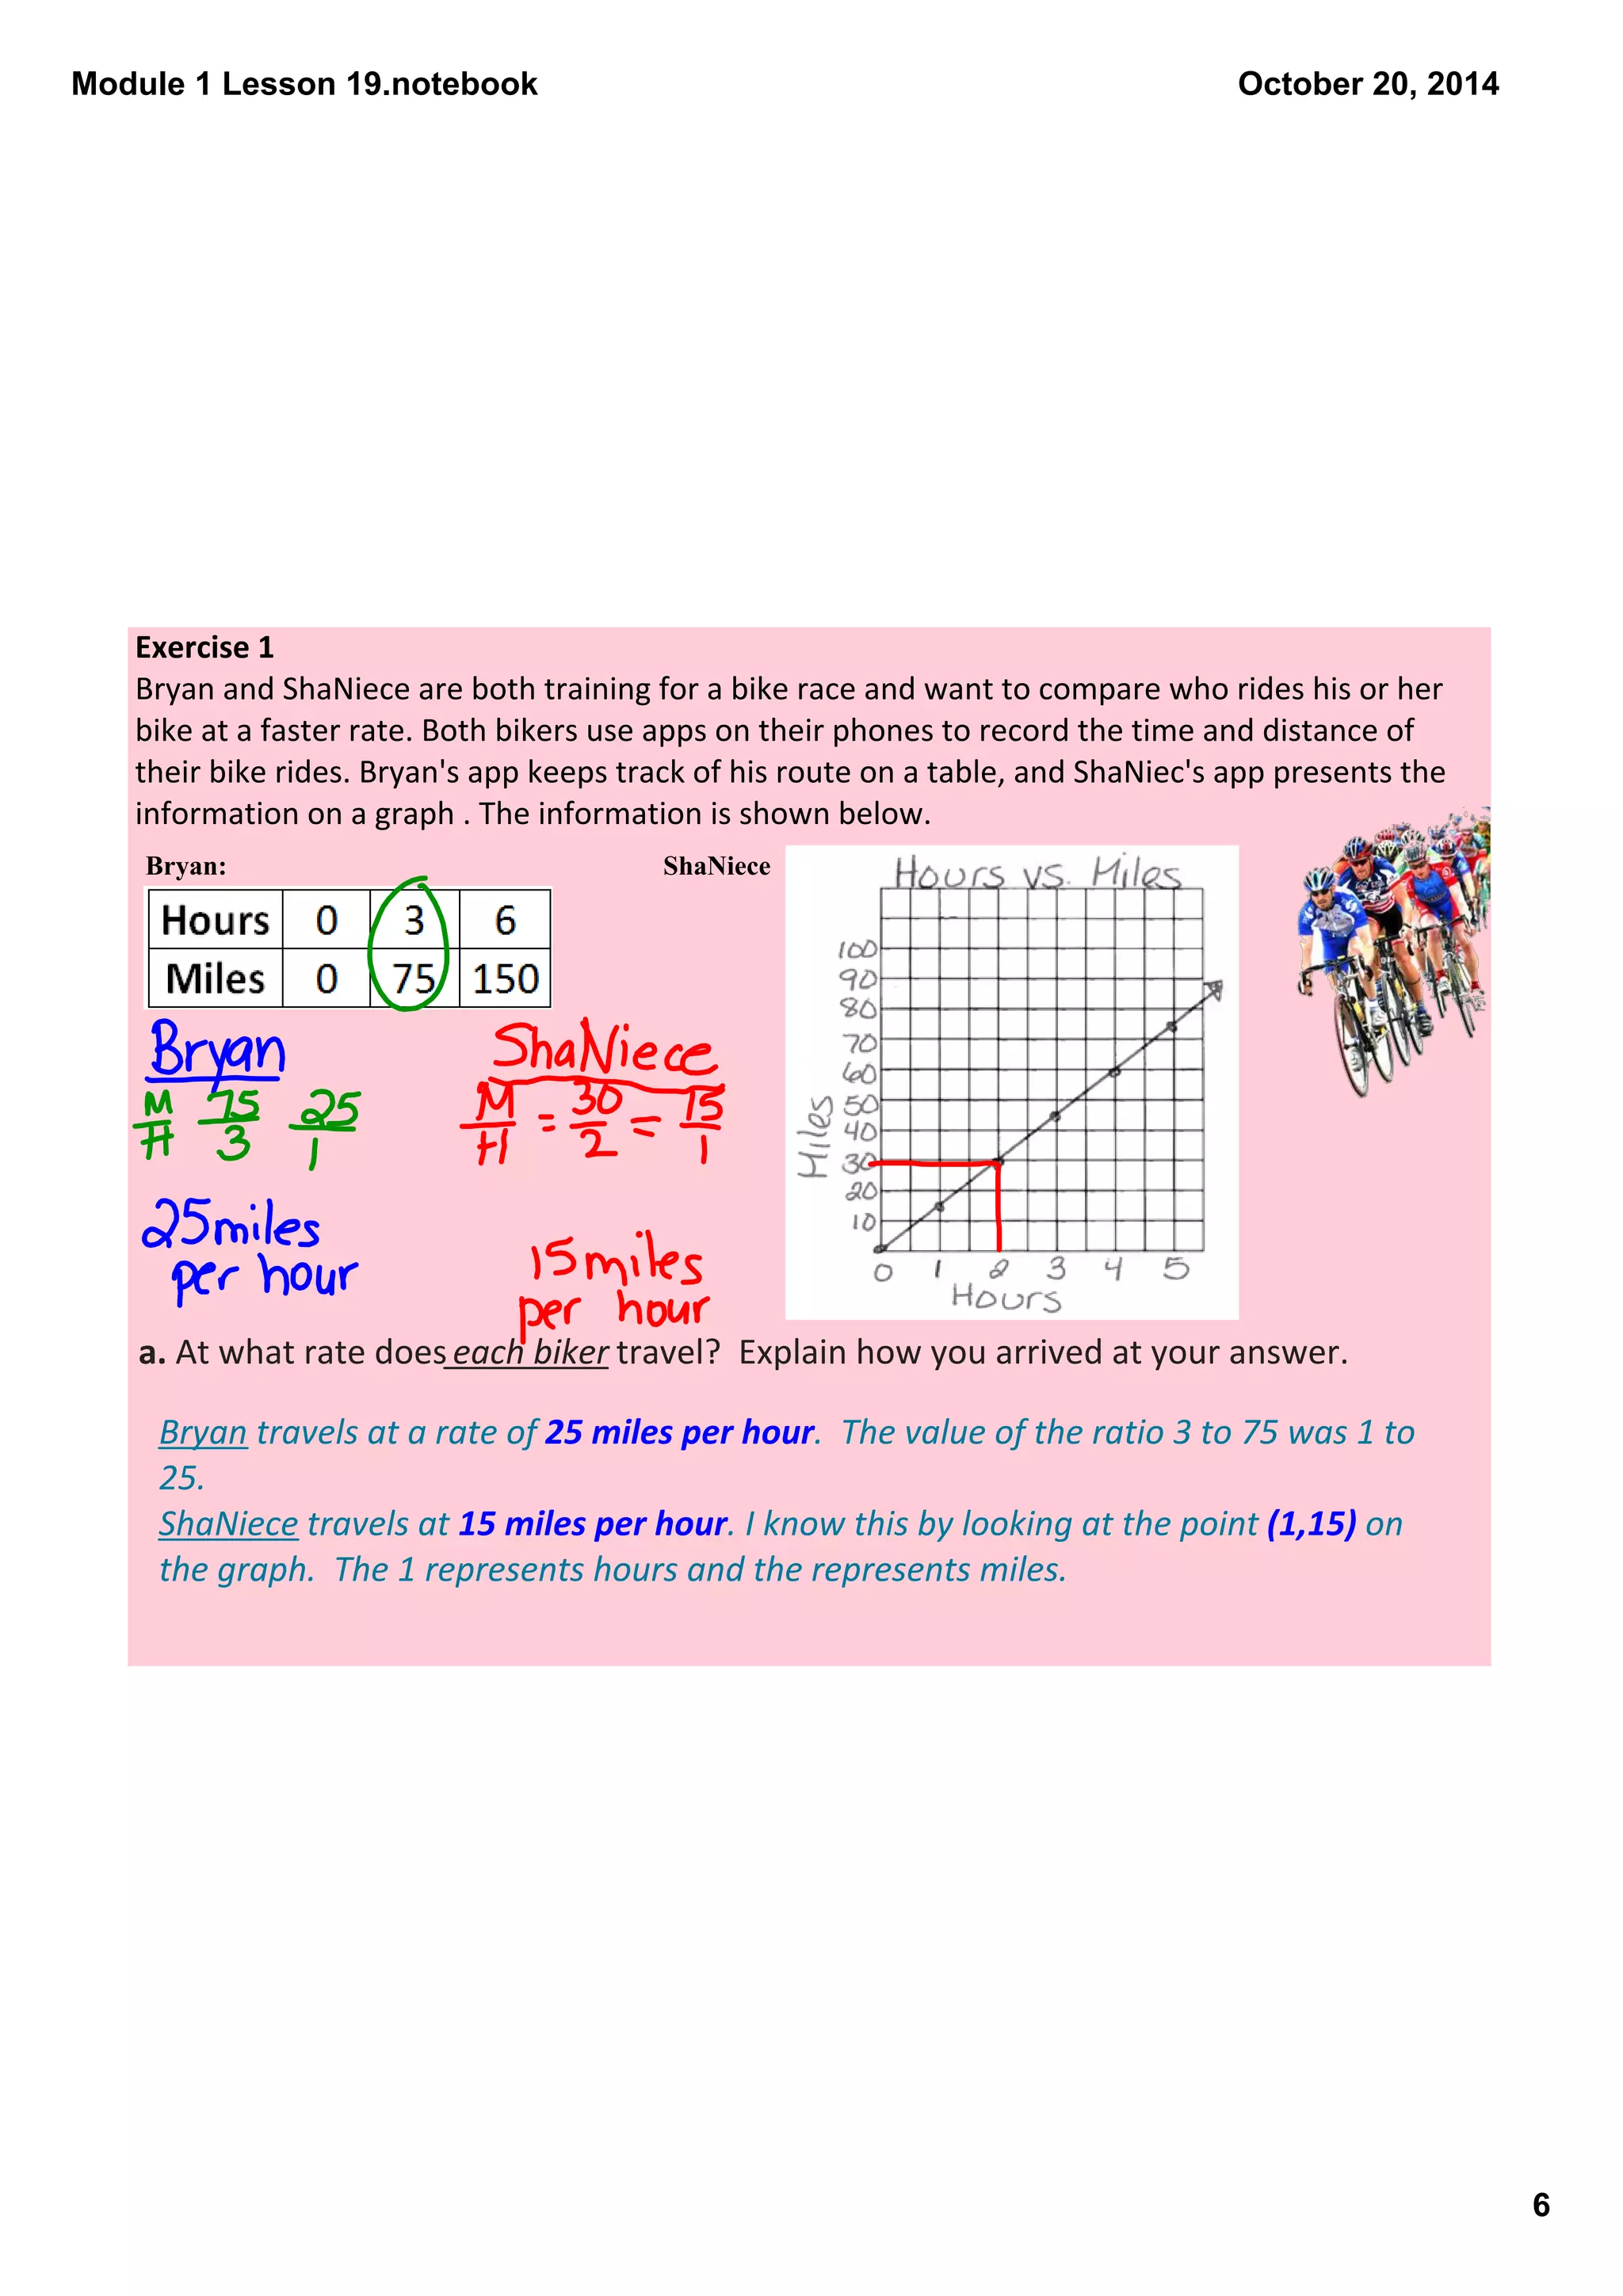
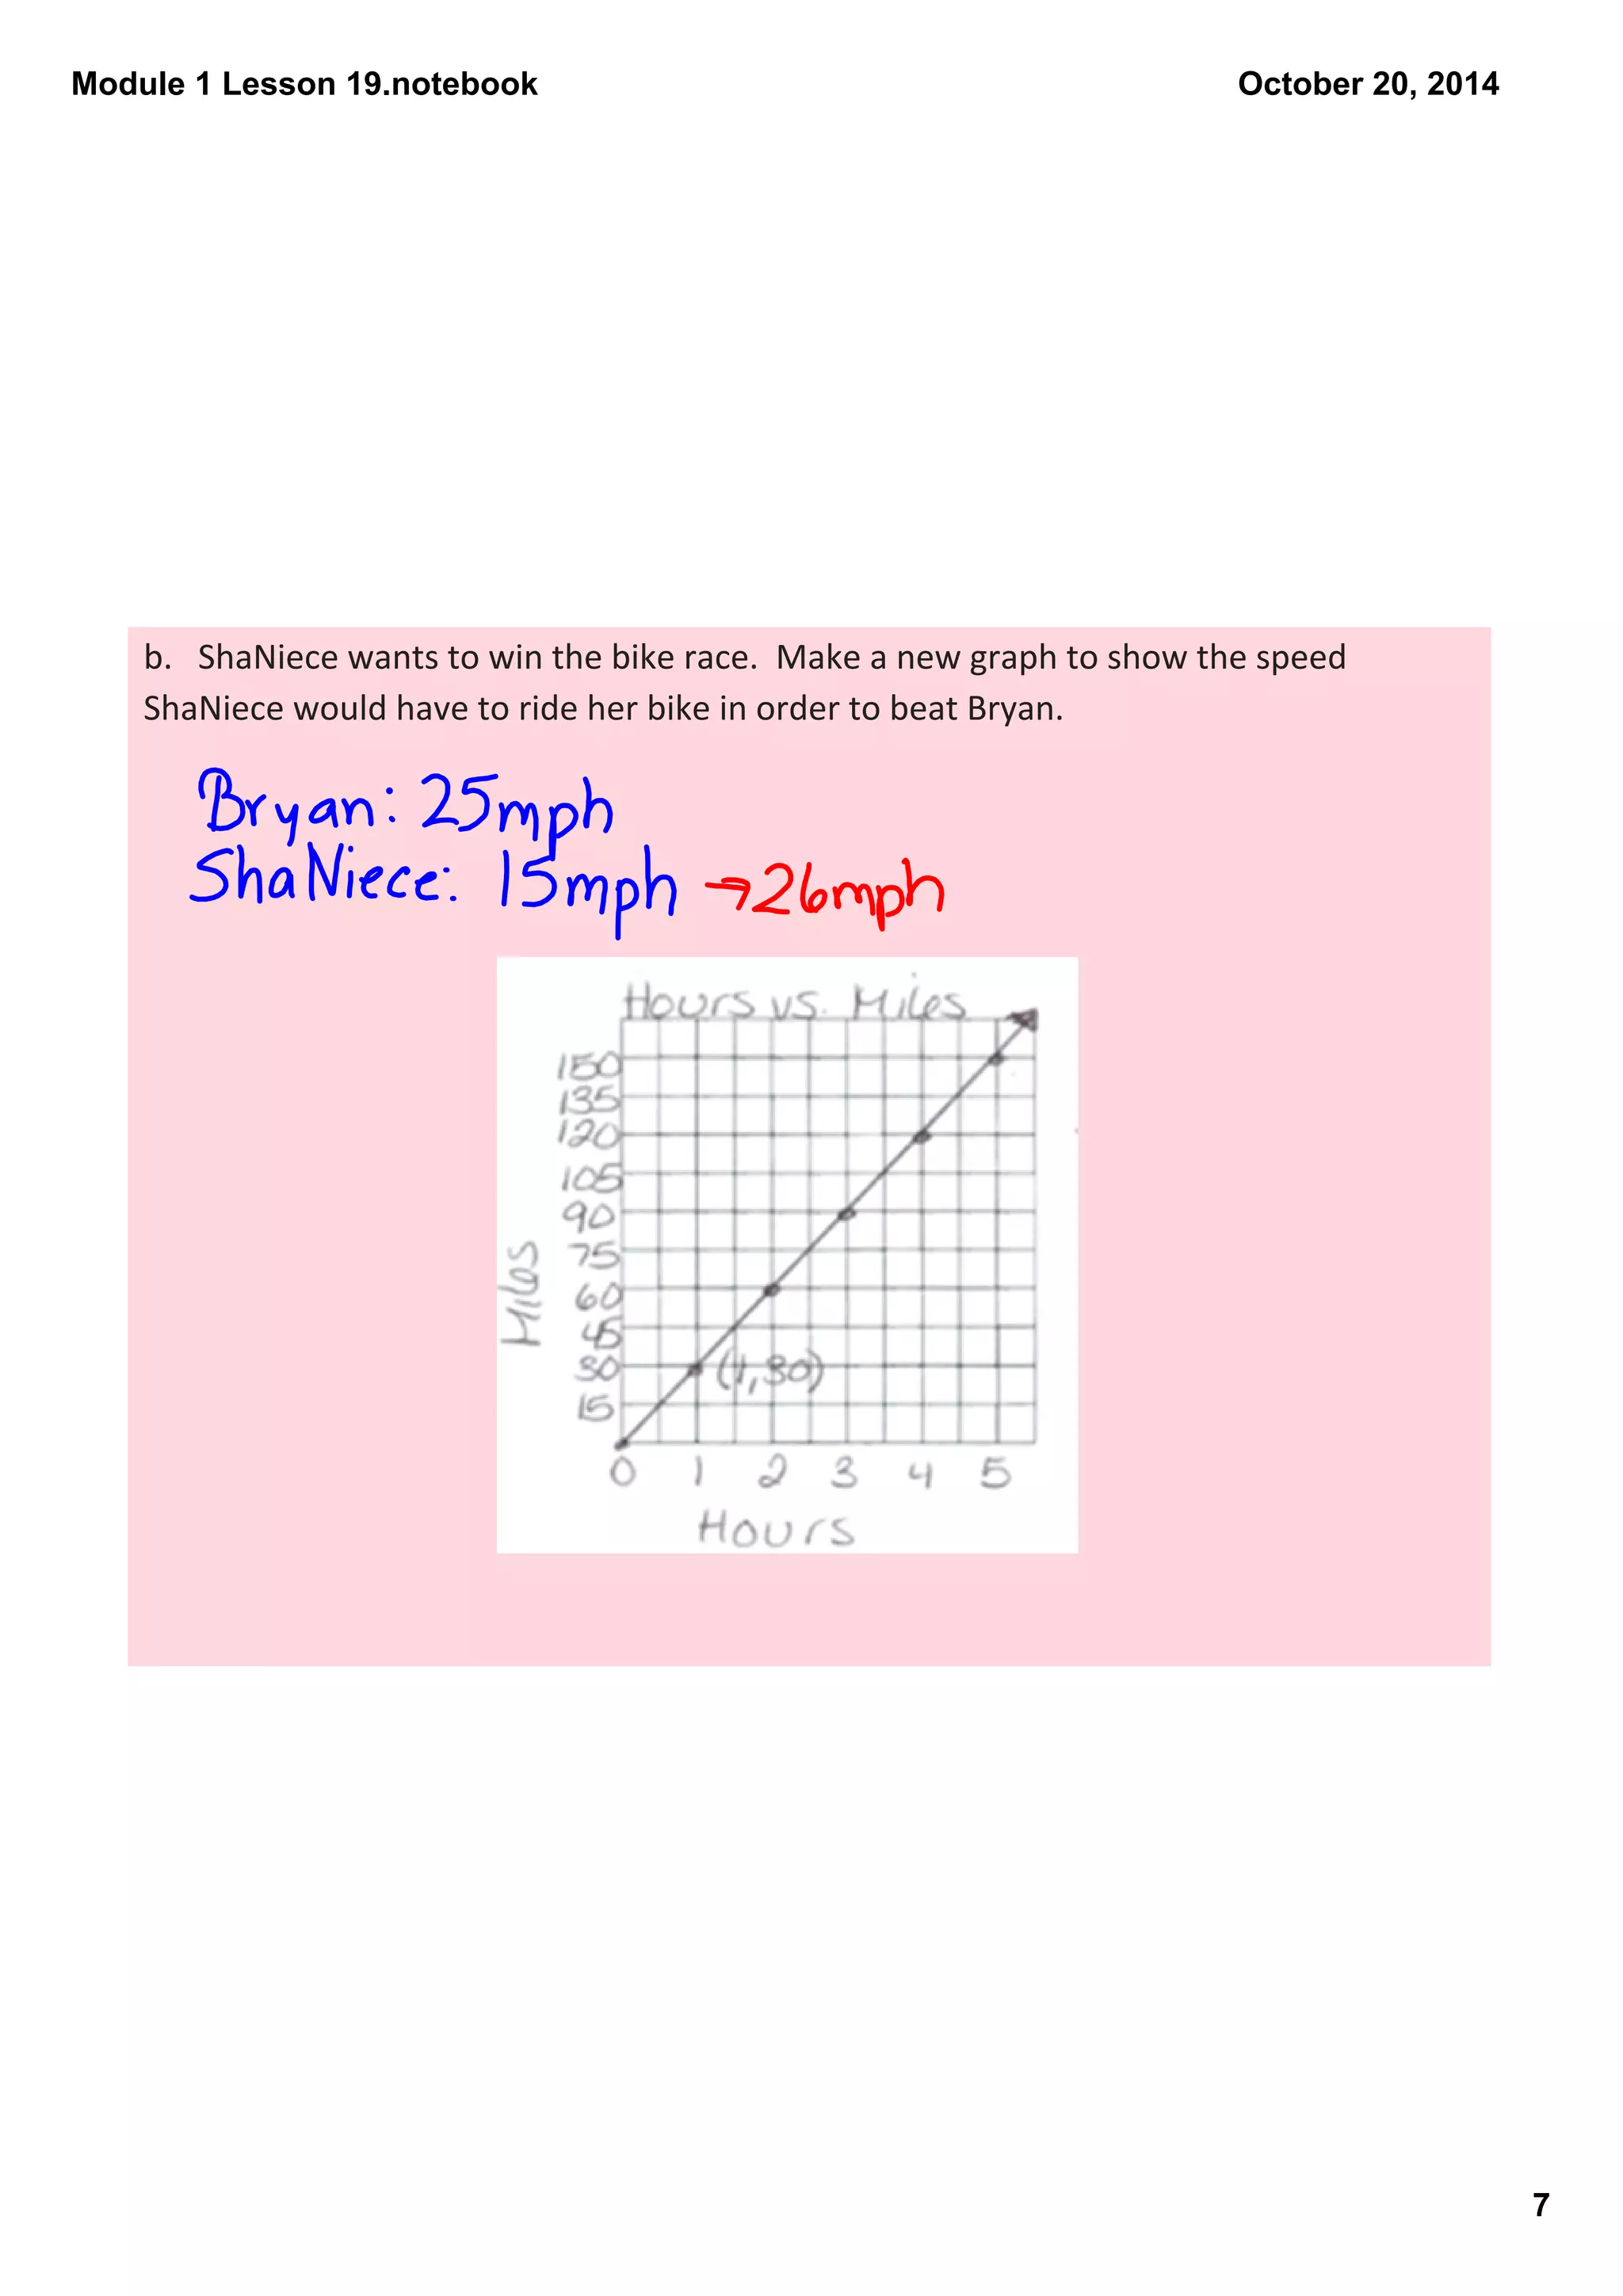
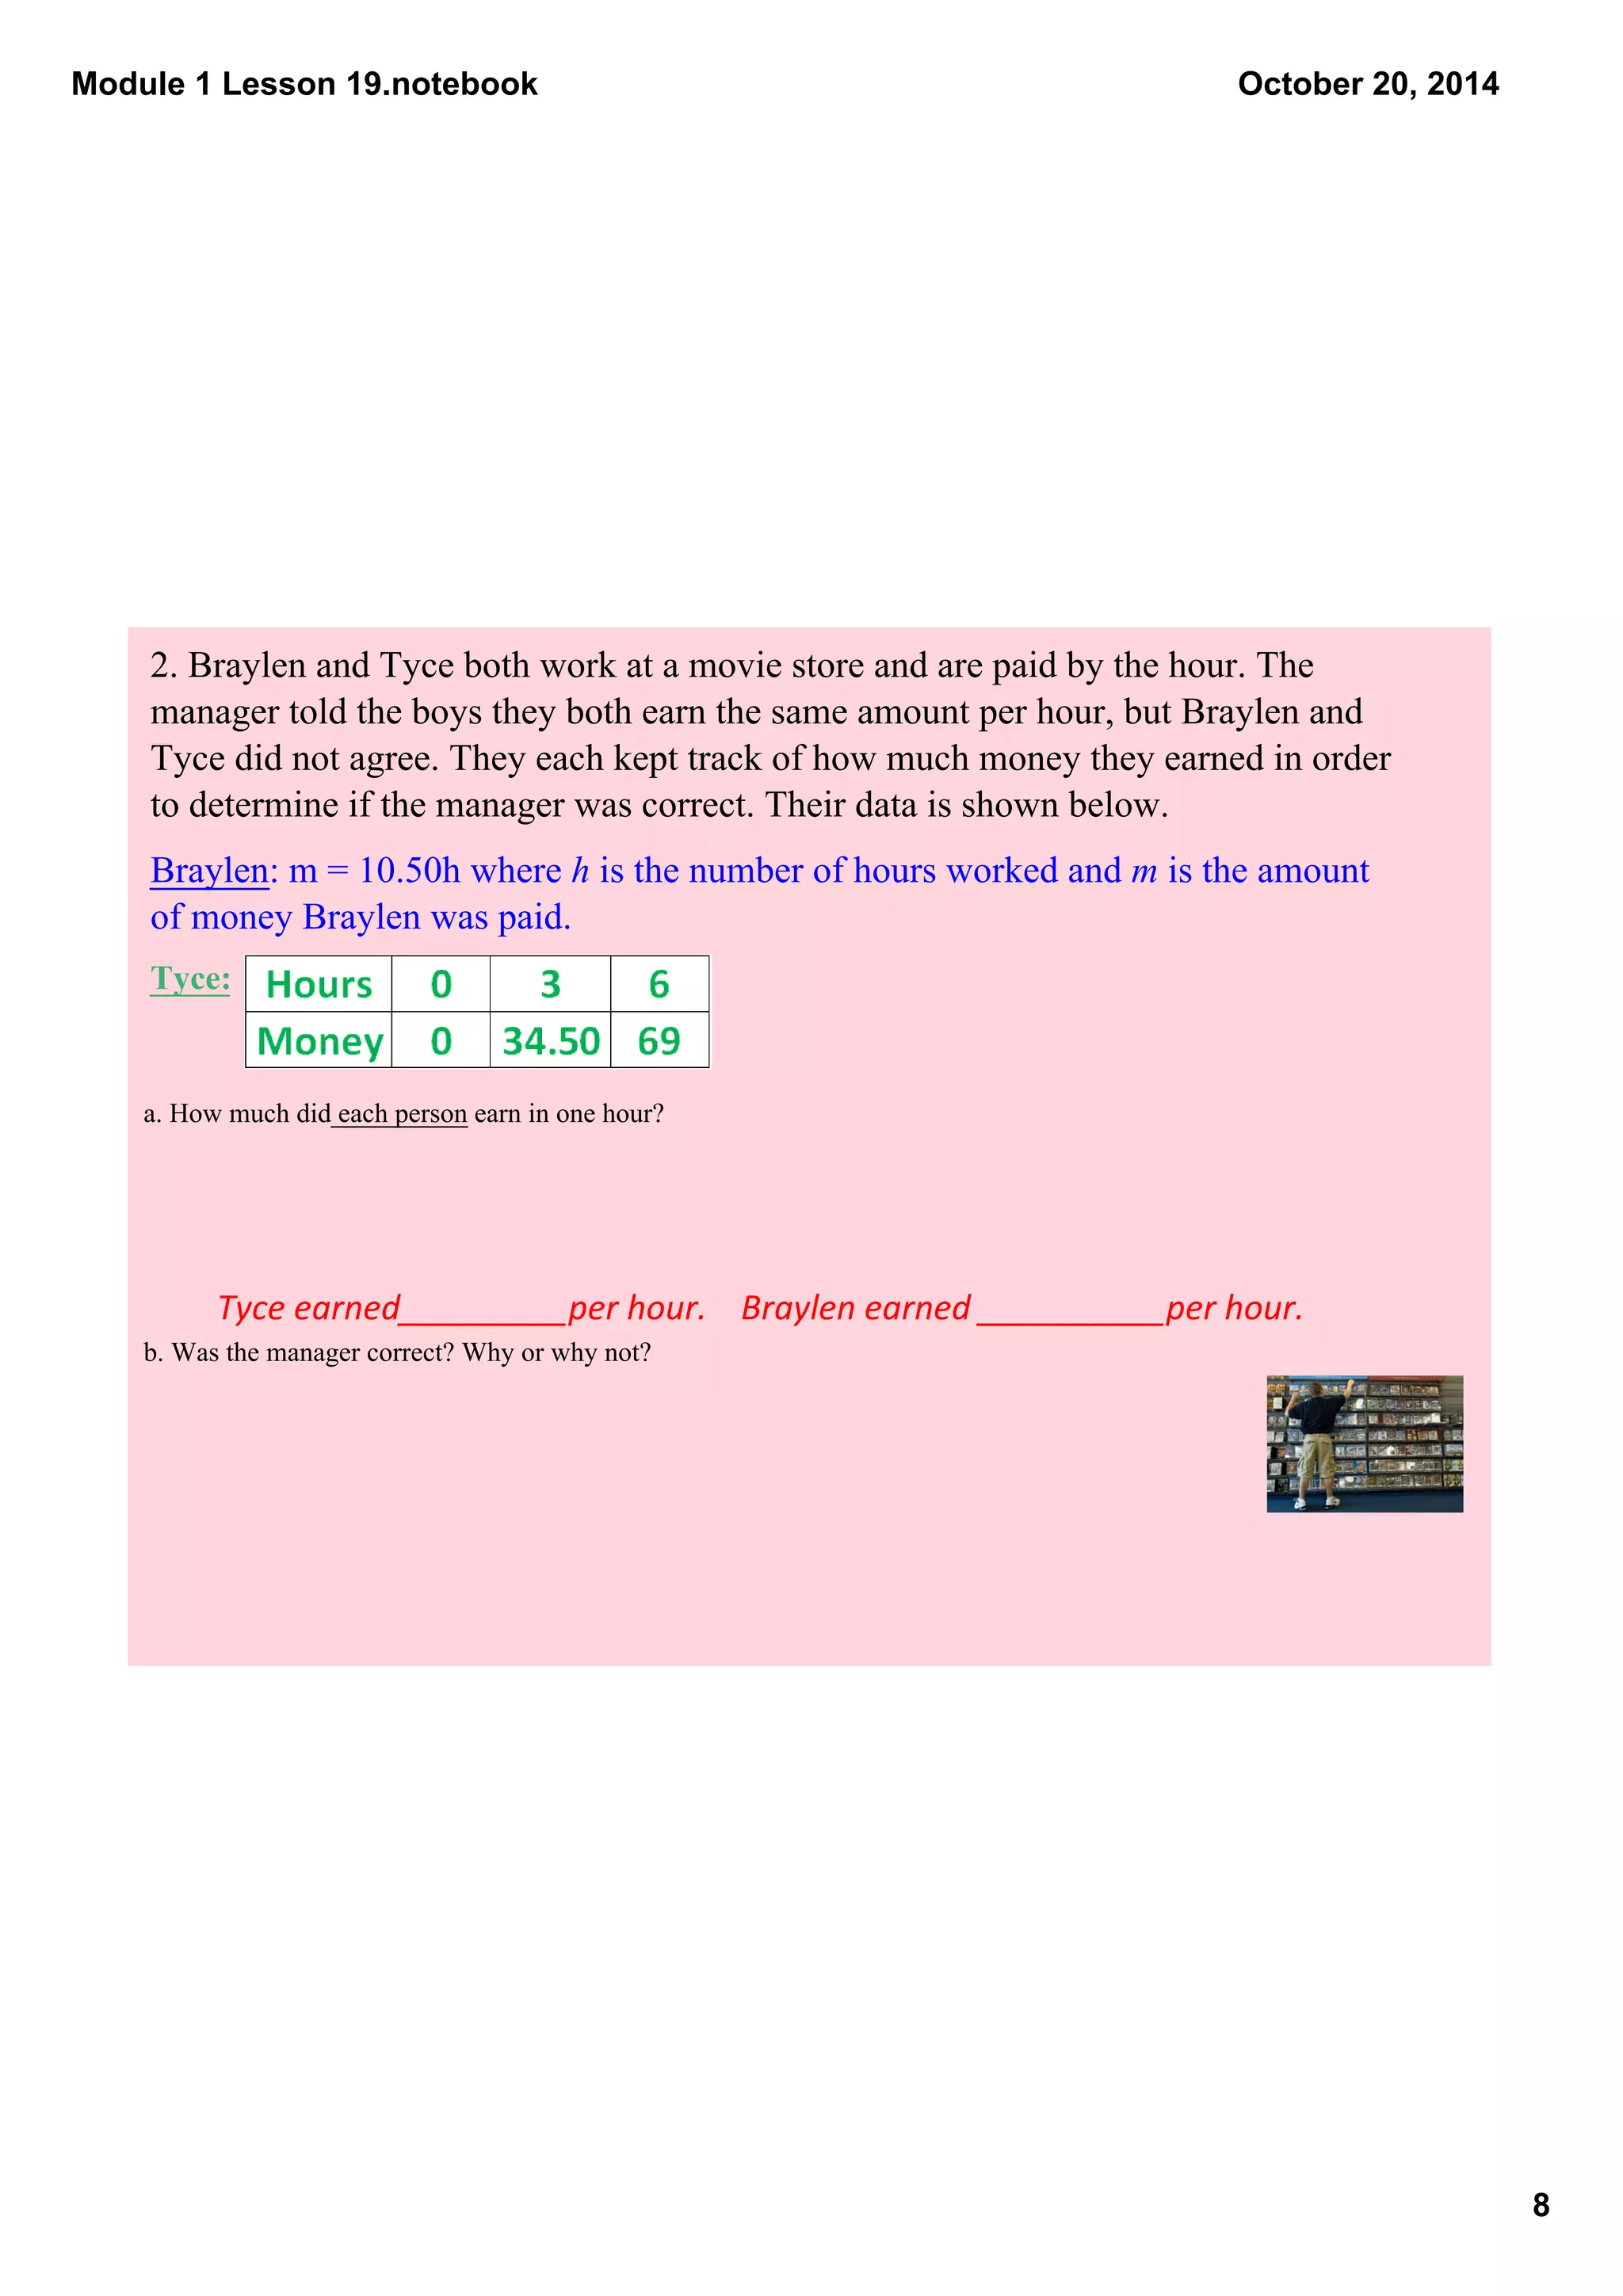
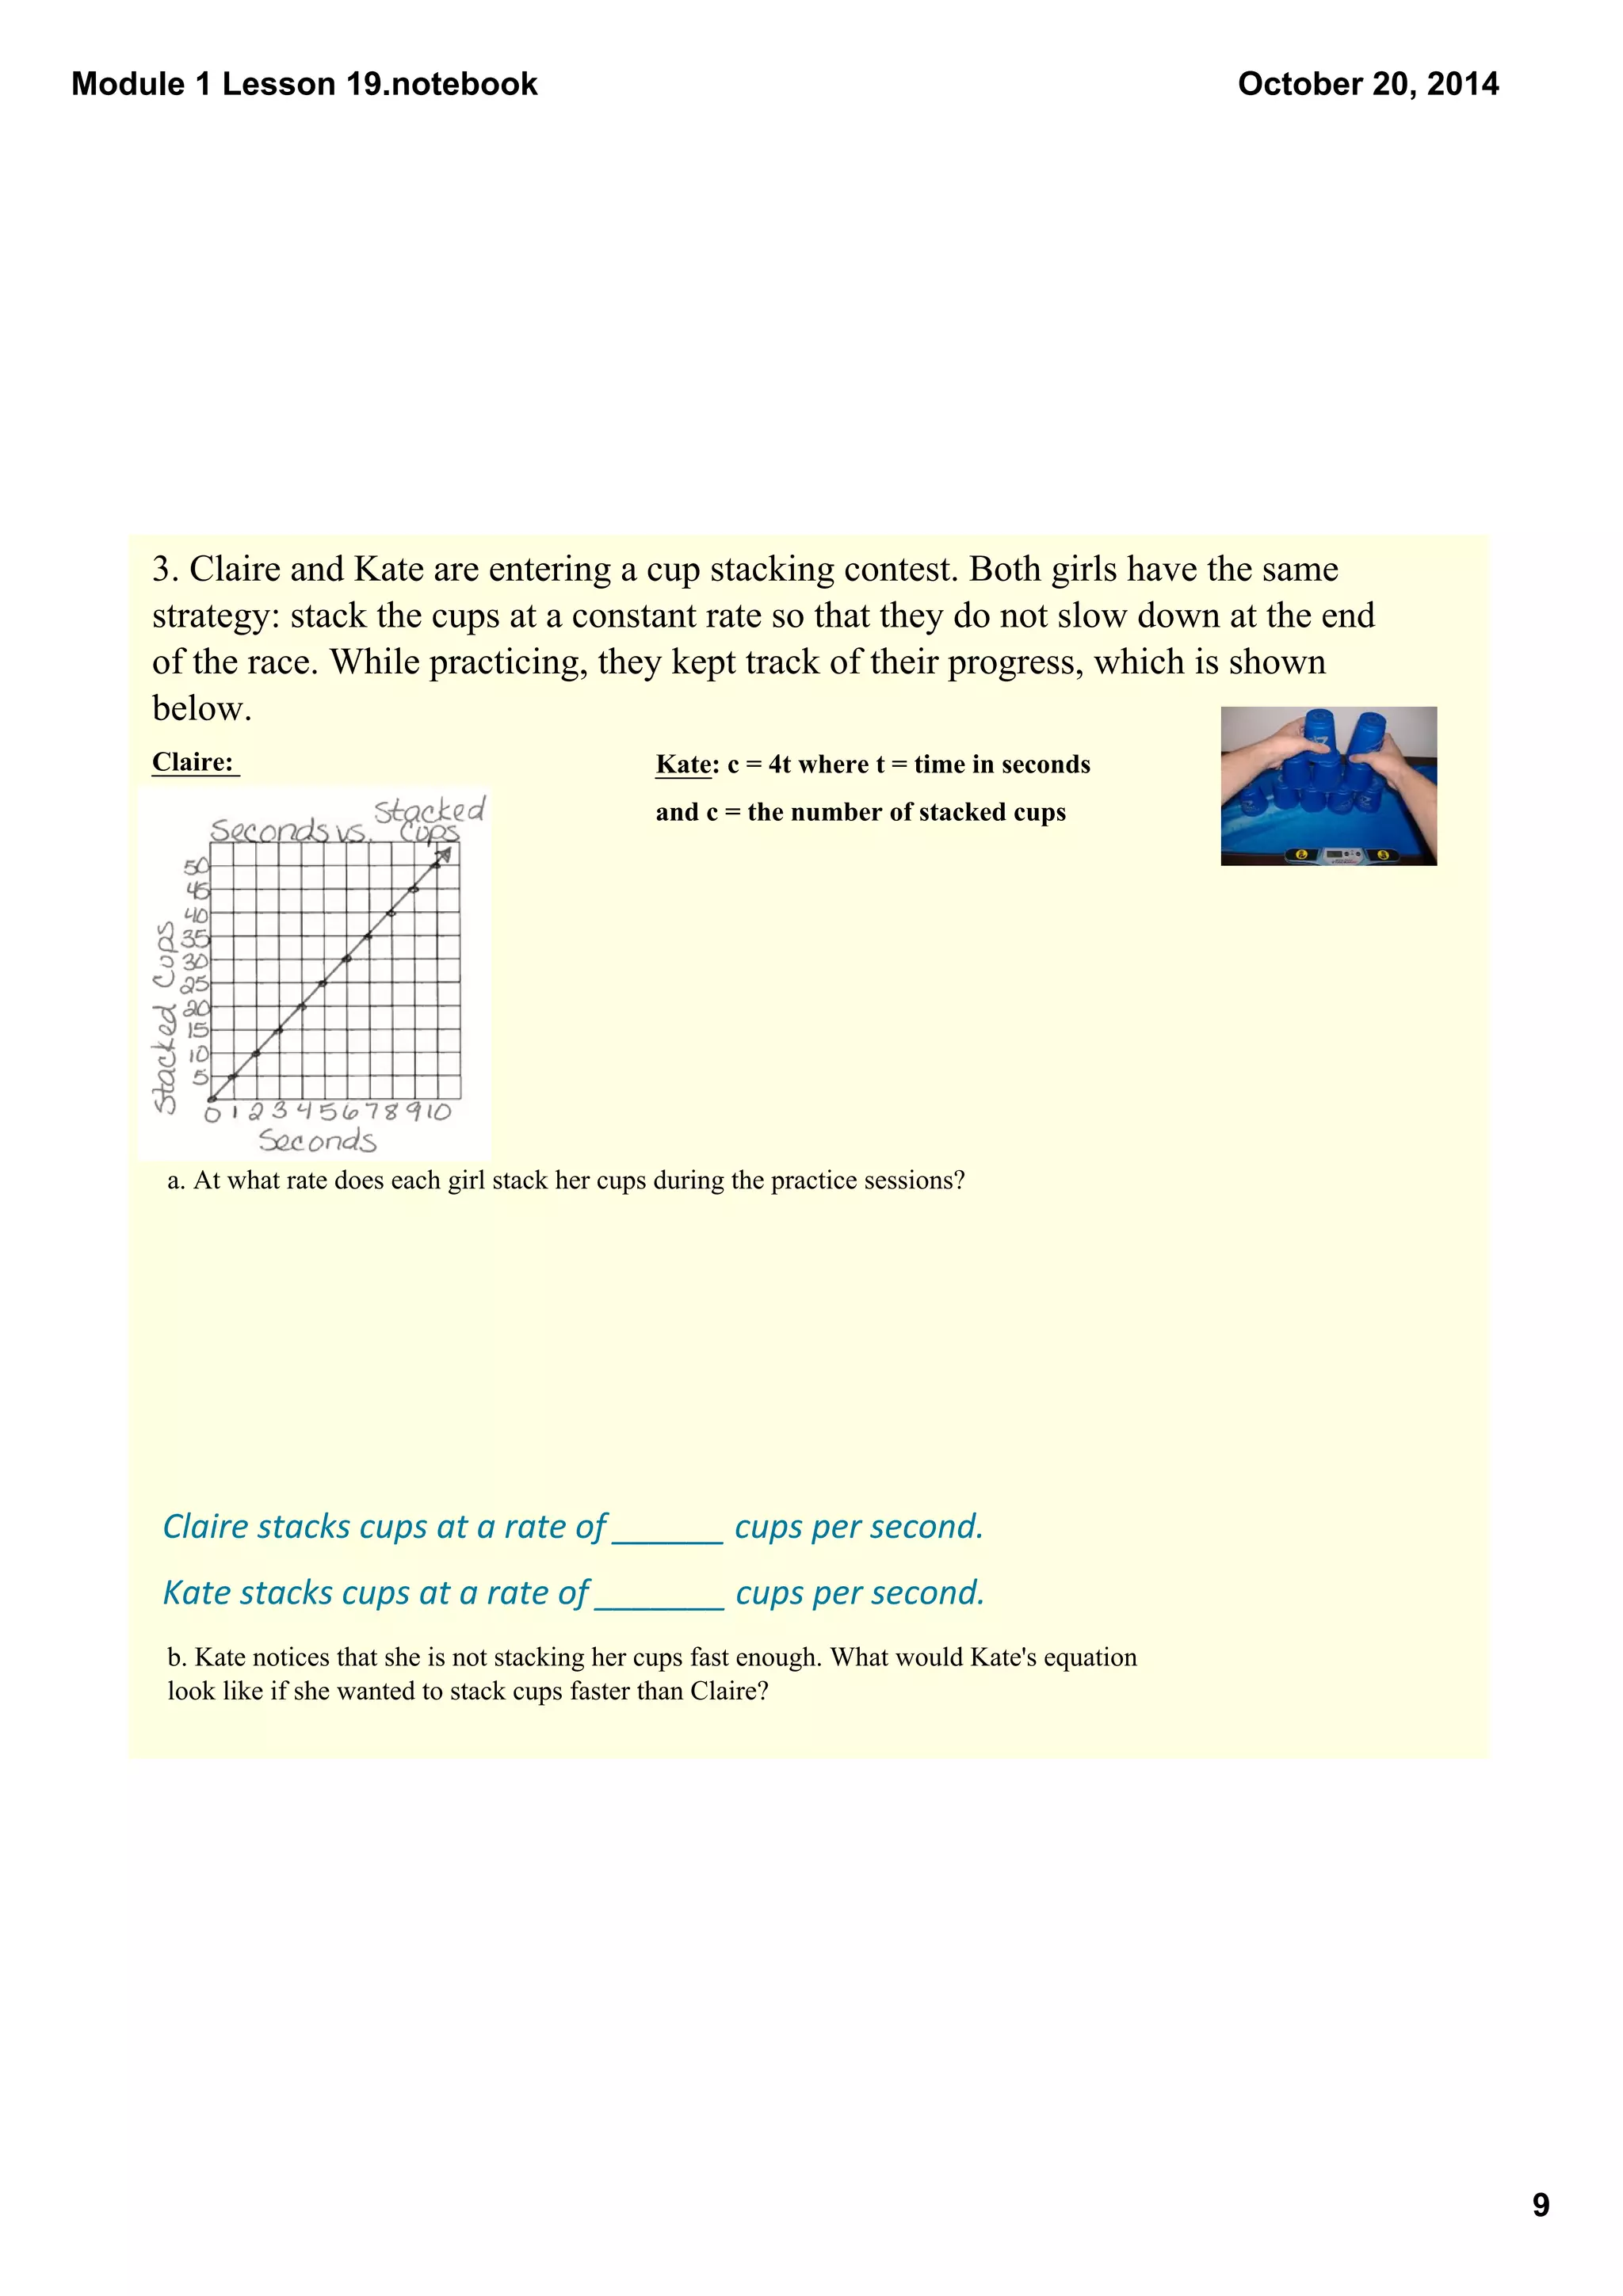
This document contains notes from a math lesson on comparing rates and unit prices using tables, graphs, and equations. It includes examples of setting up tables and equations to represent ratios, finding unit rates from tables and graphs, comparing rates, and constructing new graphs to show changing rates. The lesson concludes with questions about identifying unit rates and how they are used to compare different rates.