Michael Durante Western Reserve 3Q05 letter
•
1 like•290 views

Michael Durante Western Reserve 3Q05 letter

Recommended
Recommended
More Related Content
What's hot
What's hot (20)
Similar to Michael Durante Western Reserve 3Q05 letter
Similar to Michael Durante Western Reserve 3Q05 letter (20)
More from Michael Durante
More from Michael Durante (20)
Recently uploaded
Recently uploaded (20)
Michael Durante Western Reserve 3Q05 letter
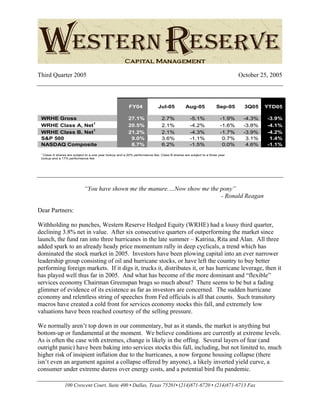
- 1. Third Quarter 2005 October 25, 2005 100 Crescent Court, Suite 400 • Dallas, Texas 75201• (214)871-6720 • (214)871-6713 Fax FY04 Jul-05 Aug-05 Sep-05 3Q05 YTD05 WRHE Gross 27.1% 2.7% -5.1% -1.9% -4.3% -3.9% WRHE Class A, Net 1 20.5% 2.1% -4.2% -1.6% -3.8% -4.1% WRHE Class B, Net 1 21.2% 2.1% -4.3% -1.7% -3.9% -4.2% S&P 500 9.0% 3.6% -1.1% 0.7% 3.1% 1.4% NASDAQ Composite 8.7% 6.2% -1.5% 0.0% 4.6% -1.1% 1 Class A shares are subject to a one year lockup and a 20% performance fee; Class B shares are subject to a three year lockup and a 17% performance fee. “You have shown me the manure.…Now show me the pony” - Ronald Reagan Dear Partners: Withholding no punches, Western Reserve Hedged Equity (WRHE) had a lousy third quarter, declining 3.8% net in value. After six consecutive quarters of outperforming the market since launch, the fund ran into three hurricanes in the late summer – Katrina, Rita and Alan. All three added spark to an already heady price momentum rally in deep cyclicals, a trend which has dominated the stock market in 2005. Investors have been plowing capital into an ever narrower leadership group consisting of oil and hurricane stocks, or have left the country to buy better performing foreign markets. If it digs it, trucks it, distributes it, or has hurricane leverage, then it has played well thus far in 2005. And what has become of the more dominant and “flexible” services economy Chairman Greenspan brags so much about? There seems to be but a fading glimmer of evidence of its existence as far as investors are concerned. The sudden hurricane economy and relentless string of speeches from Fed officials is all that counts. Such transitory macros have created a cold front for services economy stocks this fall, and extremely low valuations have been reached courtesy of the selling pressure. We normally aren’t top down in our commentary, but as it stands, the market is anything but bottom-up or fundamental at the moment. We believe conditions are currently at extreme levels. As is often the case with extremes, change is likely in the offing. Several layers of fear (and outright panic) have been baking into services stocks this fall, including, but not limited to, much higher risk of insipient inflation due to the hurricanes, a now forgone housing collapse (there isn’t even an argument against a collapse offered by anyone), a likely inverted yield curve, a consumer under extreme duress over energy costs, and a potential bird flu pandemic.
- 2. October 25, 2005 Nevertheless, not all is bad. Credit markets (including inflation adjusted bonds) remain stable and continue to discount low inflation risk. The yield on the 10-year Treasury has been range bound for almost four years. Employment remains strong and both companies and consumers remain very liquid relative to history. Further, the Fed has raised 11 straight times, resulting in core inflation deceleration over the past six months. By the sheer data, it would appear that things are moving along on schedule and in the right direction. Our “flexible” services economy is absorbing higher energy costs better than anyone could have imagined in years past, and the Fed is getting the job done by not leaving much stimulus around to monetize the impact of higher international commodity prices. But then there are the hurricanes… the two dominant drivers in the market right now, the Fed and oil, have proven particularly stifling to services stocks. A set of natural disasters in the gulf has compounded the issue. In this quarterly installment, we make our case that services stocks are ripe for the picking as valuations are discounted, in some cases, to calamitous lows; and what our risk and volatility tolerance is during this suddenly sloppy transition (due to Katrina and Rita) from a maturing cyclical recovery into a more stable environment post a major monetary tightening. The “Flexible” U.S. Economy is led by Finance and Technology Chairman Greenspan delivered his career victory speech on September 27 and it was nothing short of a byline in support of Western Reserve’s sole purpose for being – to invest in America’s key economic drivers: i) Information technology that drives the economy’s increasing efficiency, and ii) financial intermediation and innovation that drives its growth. By his words – “Innovative technologies, especially information technologies, have contributed critically to enhanced flexibility.” and “…Financial instruments have contributed to the development of a far more flexible, efficient, and hence resilient financial system than the one that existed just a quarter-century ago. Although the business cycle has not disappeared, flexibility has made the economy more resilient to shocks and more stable overall during the past couple of decades. To be sure, the stability has created some new challenges for policymakers. But more fundamentally, an environment of greater economic stability has been key to impressive growth in the standards of living and economic welfare so evident in the United States.” As a specialized investment firm, the Western Reserve team cheered the remarkable speech, though we have been equally frustrated by the fact that the message is being clouded by the necessary, but transitory, effects of the storms on the economy and perhaps Fed policy. The highly flexible nature of our services-led economy is and will continue to manage through the after effects of the natural disasters in the gulf region. Low services stock valuations underpin palpable fear on the part of investors towards the impact on consumption spending, which is two- thirds of GDP. So, much is discounted. Western Reserve’s long portfolio (which has been the weak link this fall) is trading at only 11x forward earnings and under 10x cash flow, versus double digit growth expectations. And, interestingly, oil prices peaked the day after Katrina and have been drifting lower since, arguably unable to move higher on damage from Rita. Minutes 100 Crescent Court, Suite 400 • Dallas, Texas 75201• (214)871-6720 • (214)871-6713 Fax
- 3. October 25, 2005 from the last Federal Open Market Committee meeting signaled that their language is under discussion for a change as well. Wall Street strategists, economists and erstwhile market sages alike are unanimous at the moment (this normally should cause folks to question current momentum). The “flexible” services-led US economy is dead by their observation. The message is loud and clear: “Don’t invest here please. The US is finished!” So, they have busily instructed folks to invest much of their capital outside of America. Obligingly, the stampede of money flows out of the US and into emerging markets has been significant and, in large part, explains why even high quality US stocks have been under selling pressure despite solid fundamentals and increasingly compelling valuations. In fact, the US stock market is among the few markets that aren’t up in 2005. For all of the finger pointing going on over New Orleans, the worst natural disaster in our history has cost us less than 1,000 lives. Interestingly, as many as 50,000 were killed in Pakistan recently and their stock market is up 40% this year. Outside the US, almost every emerging market has been on a rampage, fueled by enthusiastic US investors plowing into their thinly capitalized bourses. In September alone, mutual fund investors invested $15 in foreign stock funds for every $1 invested in domestic funds. So, much of the world’s known stock markets are up in 2005 except the world’s most significant, safest and most productive...ours. Back to Fundamentals (in this Lifetime?) Stock prices, naturally, are determined by earnings. If one were to observe the relationship between long term earnings accumulation and stock price progression of tech stocks after the bubble burst a few years ago, one could understand what happened. Western Reserve’s devotion to earnings-driven stock picking and valuation risk management is not an accident. A quick glance at the accompanying chart of Cisco Systems, a widely owned technology name, serves as a good example here. The peak in the stock in early 2000 was tough to predict because of irrational momentum driving the stock price well above economic accumulation (earnings). But, the range for the decline was quantifiable to the extent one could predict earnings within reason. The types of companies Western Reserve holds long are never much above their earnings accumulation and most are well behind, meaning the market is underestimating the sustainability of earnings we have modeled (i.e. they’re likely very cheap). We gain additional confidence via our focus on high recurring, services businesses to help us make fewer mistakes on earnings and cash flows in our models. Within the context of current market conditions, this type of discounting is not working, and we have underperformed as a result. 100 Crescent Court, Suite 400 • Dallas, Texas 75201• (214)871-6720 • (214)871-6713 Fax
- 4. October 25, 2005 CSCO Stock Price CSCO Earnings Source: Baseline Our universe of services economy stocks has underperformed its earnings accumulation for over two years. Inflections often coincide with major mid-cycle rate hike cycles by the Fed and with credit markets continuing to signal low long term inflation risk, we believe services stocks will reassert market leadership in due time and will “catch-up” with their earnings progression. The risk with a fundamentally driven stock picking team like ours is simple - macho analysis! The WRHE team is a bit like a ‘fundamental majority’ when it comes to quality investing. We are focused on high quality small cap services stocks and tightly disciplined to such business model metrics as high recurring revenue and wide margins. We short similar industries we long, but look for extended valuations, lower quality businesses and troubled companies. Normally, this qualitative approach works out quite well for us. When it doesn’t, it’s generally because low quality stocks are outperforming high quality stocks. In such times, concepts like valuation, sustainable margins and the long term recurring attractiveness of a business are effectively set aside by market participants in lieu of shorter term trend and momentum. Years like 1999, the occasional ‘January effect’ and 2003 posed a risk to qualitative driven stock picking strategies like ours, and we expect to experience higher volatility for a time. What we are seeing in 2005 is similar: a low quality and momentum driven market clouded by macro uncertainty. This was quite manageable until the hurricanes, which have exacerbated the momentum and qualitative imbalance in stock price performances. So, our very disciplines are in our way right now. We have continued to focus on upgrading the long-side portfolio to our top tier long ideas in order to prepare for a better market for us. This has come at the expense of short term performance. More recently, we have taken additional steps to reduce or eliminate positions potentially at risk to further discounting based upon historical trough valuation metrics. 100 Crescent Court, Suite 400 • Dallas, Texas 75201• (214)871-6720 • (214)871-6713 Fax
- 5. October 25, 2005 As noted often, Western Reserve’s investment strategy does not stray. Smaller capitalization services stocks are what we are good at, and I have long since come to believe what Chairman Greenspan now has outlined in his victory speech – the US economy is both great and “flexible.” The drivers of our recent past and long-term future lie in two broad services areas – financial intermediation and information technology. The current rush to invest in commodities and foreign stocks is not risk averse in my view. It’s the same old momentum game we have seen time and again. The rotation out of services has been costly to Western Reserve’s recent performance. We have been both frustrated and humbled by our performance this Fall, and we will redouble our efforts to generate superior returns once again through our fundamental research process. From time to time (especially when things aren’t so rosy short term), I am criticized for being too committed to our strategy. But, sticking to our knitting is what we do in such times of market dislocations as the present. Volatility, despite its negative perception by some fund managers, is inherent to the process of fundamental long-term value creation. We view the investing landscape more consistently – apply what we have learned that works cycle in a cycle out. We also know that few are standing where Western Reserve is standing right now – in the services arena - and we have had to risk manage from the top down more than usual in order to deal with the current non-fundamental reality. I believe it will prove temporary, and while it’s incredibly poor form for a money manager to ring the dinner bell when he’s riding through a rough patch, I’m doing just that. Services economy stocks have for too long now underperformed their own economic value creation (earnings). A reversion generally follows… The headlines in the financial press are all tortuously negative these days, and as the late President Reagan told his staff during periods of seemingly endless bad news: “You have shown me the manure… Now show me the pony.” Regards, Michael P. Durante Managing Partner 100 Crescent Court, Suite 400 • Dallas, Texas 75201• (214)871-6720 • (214)871-6713 Fax
- 6. October 25, 2005 Long Short Total (Gross) Total Class A (Net) 2 Total Class B (Net) 2 Long Short Total (Gross) Total Class A (Net) 2 Total Class B (Net) 2 Jan-05 Feb-05 Mar-05 Apr-05 May-05 Jun-05 Jul-05 Aug-05 Sep-05 YTD WRHE Gross 0.4% -1.9% -2.3% -0.9% 1.3% 4.0% 2.7% -5.1% -1.9% -3.9% WRHE Class A Net 0.2% -1.6% -2.0% -0.8% 0.9% 3.1% 2.1% -4.2% -1.6% -4.1% WRHE Class B Net 0.3% -1.7% -2.1% -0.8% 1.0% 3.2% 2.1% -4.3% -1.7% -4.2% S&P 500 -2.5% 1.9% -1.9% -2.0% 3.0% 0.0% 3.6% -1.1% 0.7% 1.4% NASDAQ -5.2% -0.5% -2.6% -3.9% 7.6% -0.5% 6.2% -1.5% 0.0% -1.1% Sep-05 Aug-05 Jul-05 Jun-05 May-05 Apr-05 Mar-05 Feb-05 Jan-05 Dec-04 Nov-04 Oct-04 TTM Inception To Date 3 WRHE Gross -1.9% -5.1% 2.7% 4.0% 1.3% -0.9% -2.3% -1.9% 0.4% 7.8% 7.7% 2.7% 14.4% 22.1% WRHE Class A Net -1.6% -4.2% 2.1% 3.1% 0.9% -0.8% -2.0% -1.6% 0.2% 6.1% 6.0% 2.0% 10.3% 15.1% WRHE Class B Net -1.7% -4.3% 2.1% 3.2% 1.0% -0.8% -2.1% -1.7% 0.3% 6.3% 6.3% 2.1% 10.7% 15.7% S&P 500 0.7% -1.1% 3.6% 0.0% 3.0% -2.0% -1.9% 1.9% -2.5% 3.3% 3.9% 1.4% 10.4% 10.6% NASDAQ 0.0% -1.5% 6.2% -0.5% 7.6% -3.9% -2.6% -0.5% -5.2% 3.8% 6.2% 4.1% 13.5% 7.5% Sector Long Short Gross Net Business Services 12% 4% 17% 8% Alliance Data Long Consumer 7% 8% 14% -1% Capital One Financial Financial Institutions 21% 5% 26% 16% Euronet Worldwide Financial Services 18% 5% 23% 13% SLM Corporation Healthcare 0% 0% 0% 0% Affiliated Computer Services Industrial 2% 6% 8% -3% Technology 10% 3% 13% 7% Technology Services 22% 6% 28% 15% Long Short Real Estate 16% 5% 21% 11% Top 5 21% 9% 108% 42% 150% 65% 36% 16% Summary for the Quarter Ended September 30, 2005 Western Reserve Hedged Equity, LP Quarter Ended September 30, 2005 Positions 1 Performance Ending Exposure 1 58 -1.2% 108% 37 -3.3% 42% 95 -4.3% 150% -3.8% 65% -3.9% 65% Trailing Twelve Months (TTM) Performance Average Exposure 1 21.8% 100% -6.8% 46% 14.4% 146% 10.3% 55% 10.7% 55% Year to Date Comparative Returns 2 Trailing Twelve Months Comparative Returns 2 Composition by Sector (% of Capital) Key Positions Euronet Worldwide Superior Industries Top 5 Winners YTD Short Compucredit H&R Block, Inc. Percent of Capital Largest Long Positions Top 10 Positions SI International Ocwen Financial Portfolio Recovery Patterson Cos. MBNA Corporation eSpeed, Inc. Western Reserve Hedged Equity, LP Cumulative Performance Since Inception (Gross) -9% -5% -1% 4% 8% 12% 16% 20% 24% 28% 32% Dec Jan Feb Mar Apr May Jun Jul Aug Sep Oct Nov Dec Jan Feb Mar Apr May Jun Jul Aug Western Reserve S&P 500 NASDAQ 1 100 Crescent Court, Suite 400 • Dallas, Texas 75201• (214)871-6720 • (214)871-6713 Fax Freely tradable securities. Immaterial position sizes omitted. 2 Class A shares are subject to a one year lock-up and a 20% performance fee; Class B shares are subject to a three year lock-up and a 17% performance fee. 3 Western Reserve Hedged Equity, LP's inception date is January 1, 2004. Please be advised that the past performance of Western Reserve Hedged Equity, LP (the “Fund) is not necessarily indicative of future results. Depending on the timing of a person’s investment in one of the Funds, actual investment returns in the Fund may vary from the returns stated herein. Performance results are estimated, based on both audited and unaudited results, net of management and performance fees and operating expenses. Such performance results assume that a partner invested in the Fund at the inception of the Fund and has not made additional contributions or withdrawals. There is no assurance that at any time the securities held by the Fund will be securities which comprise any of the indices listed above, and the Fund may have substantial cash balances and investments in relatively illiquid securities at any time when compared to the securities comprising a listed index. This report is provided for informational purposes only and is not authorized for use as an offer of sale or a solicitation of an offer to purchase investments in the Fund or any affiliated entity. This report is qualified in its entirety by the more complete information contained in the Fund’s Confidential Private Placement Memorandum and related subscription materials. This report is confidential and may not be reproduced for any purpose. Western Reserve Capital Management, LP serves as the Fund’s investment manager. Its Form ADV Part II and Privacy Policy are available to investors upon request.