1. POVERTY ALLEVIATION PROGRAMMES
IN ANDHRA PRADESH - AN ASSESSMENT
(Sponsored by Planning Commission, Government of India)
S. MAHENDRA DEV
P.PADMANABHA RAO
CENTRE FOR ECONOMIC AND SOCIAL STUDIES
N.O CAMPUS, BEGUMPET,
HYDERABAD –16
August, 2002
1
2. CONTENTS
Executive Summary 3 - 11
Chapter I – Context, Objectives and Methodology 12- 25
1. Context of the Study 12
2. Brief Review of the Literature 14
3. Objectives of the Study 21
4. Methodology of the Study 22
a. Sample Design 22
b. Surveys and Data Collection 23
Chapter II – Performance of the PAPs at Macro – Level 26 - 31
a. Rural Poverty Ratios 26
b. Population and Poor 27
c. Rural Poor by Age Groups and Families 29
d. Coverage of Rural Poor Under IRDP/SGSY 30
e. Coverage under TRYSEM 30
f. Coverage under NOAP 30
g. Coverage under DWCRA, NFBS and NMBS 31
Chapter III - Performance of the PAPs at Micro-Level 32 - 111
I. Income Enhancement Schemes 32
II. Census Survey 33
III. Micro Analysis 45
IV. A. Self Employment Programmes 46
i. Integrated Rural Development Programme (IRDP) 52
a. Leakages 52
b. Retention of Assets 53
c. Income and Employment gains 72
ii. Development of Women and Children in Rural Areas 82
B. Wage Employment Programmes
i. Jawahar Rojgar Yojana (JRY) 86
II. Food and Nutritional Programmes (ICDS) 88
III. Minimum Needs Programme: Indira Awas Yojana (IAY) 90
IV. Income maintenance Programme 92
V. Deepam Scheme 93
VI. Employment Assurance Scheme (EAS) 98
VII. Natural Resource management programme 102
Chapter IV - Suggestions for Improvement 112 – 115
References 116 - 118
Appendix 119 - 125
2
3. EXECUTIVE SUMMARY
The Government of Andhra Pradesh has adopted a multifold strategy to eradicate
poverty, which is multi-dimensional. Eradication of poverty has been the overriding
objective since the beginning of economic planning in India. Eradication of poverty
through overall economic and social development by ensuring equitable access in
resources and skills, as well as by widening the opportunities for gainful employment to
the deprived sections of the society, is enunciated as the principal objectives of all the
rural development programmes initiated by the government. It has assumed significance
more so in the context of ongoing economic reforms due to the apprehensions that the
short-run impact of reforms may not be favorable for the eradication of poverty. It is
known that economic growth alone is not sufficient to reduce poverty and there is a need
for direct state intervention for poverty eradication.
The PAPs can be grouped into five categories. They are: 1.income enhancement
programmes – a. Self Employment Programmes which include IRDP, DWCRA and
TRYSEM and b. wage employment programmes which include JRY and EAS;
2.programmes which focus on providing food and nutritional security viz., PDS and
ICDS; 3. programmes which provide basic minimum services-housing, sanitation,
health, education and income maintenance programmes viz., pension schemes, maternity
benefit scheme and survival benefit scheme; and 5. natural resource management and
livelihoods. Most of the PAPs are designed by the centre and implemented by the State
on fund sharing basis for financing the programmes. The State of Andhra Pradesh has its
own programmes. It has promoted programmes like `Adarana’, `Girl Child Protection’
and `Deepam’. The proposed study makes an attempt to evaluate both Central
Government and State Government poverty alleviation programmes in Andhra Pradesh.
3
4. Objectives of the Study
1. to examine the planning and implementation of the target oriented Poverty
Alleviation Programmes (PAPs);
2. to assess the leakages of the programmes in terms of coverage of non-poor and
non-retention of assets;
3. to examine the impact of the programme on the beneficiaries in terms of changes
in occupational status, income, employment and empowerment of women;
4. to examine whether the programmes have any impact on the non-beneficiary
households;
5. to assess the contribution of the programme to the growth of the local economy;
6. to trace the process of change in the socio-economic status of the beneficiary
households due to PAPs;
7. to capture the perceptions of all the stakeholders on poverty and the existing
PAPs.
Methodology
The study aimed at assessing all the poverty alleviation programmes rather than focusing
on individual components. The programmes are assessed mainly in terms of coverage,
leakages and impact on beneficiaries and non-beneficiaries along with perceptions of the
stakeholders. An alternative methodology is followed, in which income and employment
derived by the beneficiary households from each economic activity are estimated and
income and employment due to the schemes are arrived at by calculating the incremental
activities generated by each scheme. Double difference method is used in case of
watersheds.
This method gives the estimates of income (employment) generated by each scheme. But
one difficulty in this approach is that after participation in the programmes, the
household may stop (reduce) hiring out its labour and use for the programme.
4
5. The study adopted four stage stratified purposive random sampling. Three districts ie.,
Vizianagaram, Anantapur and Nalgonda were selected purposively to represent the
medium developed districts of each region by taking irrigation as a proxy for the level
of development. Three mandals were selected from each district to represent developed,
medium developed and less developed areas. Two villages were selected from each
district based on the coverage of programmes. Thus, in all 18 villages were selected from
9 mandals of three districts. Primary data were collected from beneficiary and non-
beneficiary households through structured questionnaires. Household surveys with
(census as well as sample) structured schedules, PRA exercise and group discussions
with village elders, women groups, implementing agencies, non-officials and NGOs were
done. Case studies of beneficiaries were constructed to examine the process of poverty
alleviation
Successful watersheds from three districts viz., Kurnool, Anantapur and Mahbubnagar
are taken for assessing the full potential in technically completed watersheds in
enhancing rural livelihoods, when implemented under best conditions. Incidentally, all
the selected watersheds are implemented by local NGOs. The total sample is 160
households i.e., 120 beneficiaries (15 to 48% of total beneficiaries) and 40 non-
beneficiaries (3 to 70 percent of non-beneficiaries). The study followed double difference
method.
The evaluation of the impact of anti-poverty programmes have been done at two levels
viz., macro-level and micro-level. Coverage of poor under different programmes has
been assessed at the state level in macro-level evaluations. In micro-level, the issues
taken for evaluation include retention of assets in case of self employment programmes
(IRDP, DWCRA), participation in wage employment programmes (JRY) and coverage
under IAY, benefits flown from the assets in terms of gain in income and employment
and reduction in the deprivation of houseless ness; infrastructure development at the
village level through JRY and the problems faced by the beneficiaries in obtaining the
assets as well as in maintaining the same, mostly in case of self-employment
programmes. At the same time, the indirect benefits from PAPs are also examined in
5
6. terms of their empowerment captured through their participation in state promoted
community based organizations.
Coverage at Macro- Level
Macro level analysis revealed that the percentage of poor people covered under IRDP
was very low at 1.26 percent of rural poor in 1995-96. It increased in 1996-97 but
declined later. The percentage of poor covered under SGSY was 2.84 percent of rural
poor. The percentage of rural poor trained under TRYSEM was 0.48 in 1995-96. It
increased to 2.43 percent in 1996-97, but declined to the earlier level later. The coverage
under NOAP was 35.58 percent in 1996-96 and increased significantly since 1996-97 to
reach 94 percent of rural poor in the age group of more than 60 years in 1999-2000. The
coverage under DWCRA was less than 1 percent and declined over time. But in recent
years, the coverage of DWCRA is quite high. The coverage under national family benefit
scheme (NFBS) was also less than one percent but showed fluctuations. The coverage
under NMBS was higher than DWCRA and NFBS and increased significantly in 1997-98
to 13 percent and thereafter it declined.
Coverage at Micro - level
Micro level analysis focused on income enhancement programmes (IRDP, DWCRA and
JRY), food and nutritional programmes (ICDS), minimum needs programmes (IAY),
social security schemes, and natural resource management and rural livelihoods
(watershed development).
The major findings of micro – level analysis are given below.
Integrated Rural Development Programme (IRDP)
The findings of the study indicate that the beneficiaries under IRDP mainly constituted
small and marginal farmers. Agricultural labour have benefited mainly from animal
6
7. husbandry. Under ISB (industry, service and business) sector, SC’s have received major
benefits which shows that self employment is created to the poor. Labour market is
affected only when assets provided to the beneficiaries are sustained. In the present study,
retention of assets is higher in case of agricultural and minor irrigation assets and is
higher among small & marginal farmers and STs and BCs . Less retention of assets in
ISB sector show their non-preference for self- employment. Retention of assets also
depends on the development of the region.
The entry of non-poor into the programme is varying from 3 to 8 percent across the
selected districts. The expenditure incurred in obtaining the assets under the programme
by the poor accounted for around 7 per cent of the subsidy provided to the poor. The
employment gain to the beneficiary households came to around 120 man days in the
selected districts. The income gains are more pronounced in the developed districts and
among the relatively better off among the poor. The income mobility matrix also indicate
that the crossing of poverty line is more pronounced among the near-poor rather than
among the poorest. The banks are found to be indifferent providing credit to the poorest
of the poor as they are unsure about the repayment from the poorest. As a result the
poorest of the poor are not covered under the programmes. The absence of institutional
building to enhance social capital among the poor for undertaking collective actions with
regard to market intermediation may be one of the main reasons for this.
Development of Women and Children in Rural Areas (DWCRA)
Women thrift and credit groups are homogenous and cohesive (i.e., based on income,
caste and neighborhood). 22% of the members belong to SC, 11% to ST, 67% to BC and
the remaining 4% to others. The average age of members is 35 (i.e., high percentage of
women in the fertility group). For 60% of the groups, saving is the main purpose of
group formation. Majority (94%) of groups showed no defaulters in last 3 months. There
is a high regularity in saving. In the previous 3 months 6% defaulted. There is a high
rotation of group corpus (80% internal loans). An active participation in pulse polio
immunisation (30%) and Janmabhoomi (80%) was observed. There was a gradual shift
from consumption loans (40%) to productive loans (60%). 61% would have gone to
7
8. moneylenders had there been no WSHG), whereas 7.5% of the members would not have
started the activity had there been no WSHG. As 75% of the women is illiterate, book
keeping and maintaining records are poor. A majority of the leaders and the members are
aware of DWCRA Bazars. There is a need to strengthen marketing facilities for the
products of DWCRA groups.
Jawahar Rozgar Yojana (JRY)
Under JRY employment generated per person on an average per year is around 40 days
across the sample villages of selected districts. The works executed under JRY are
found to be helpful in bridging the gap relating to infrastructure. Some of the assets
created under JRY are found to be in bad shape due to lack of proper maintenance. The
employment created is not adequate enough to influence the wage rates in labour
market. The socio-economic background of the participants indicate that the poorer
section of the society are depending on JRY works. The villagers of sample villages
have expressed that the wage employment programmes should be implemented in lean
seasons in the backward and drought prone areas.
Indira Awas Yojana (IAY)
The study finds out that 32% of eligible households have been covered under IAY in the
sample villages . It ranges from 96% among SCs to 7.8% in the case of other castes. 20%
of the poor who are beneficiaries of the anti-poverty programmes have benefited under
IAY. The facilities relating to the housing ,viz., side drains , individual sanitation
electricity connection and protected water supply have been provided.
Deepam
The study reveals that most of the DWCRA members were aware of Deepam Scheme.
They received gas connections through Mandal Development Officers (MDOs) (52
percent), followed by DWCRA leaders (34 percent). For a majority of beneficiaries (45
percent), it took two months to get their gas connection after allotment, 25 percent of
8
9. members got after one month, where as another 25 percent of the beneficiaries received
their connection after 2 months from the date of allotment. Of the total beneficiaries
households, about 70 percent of them are using gas connections when the teams visited
their place. Even after getting gas connections, around 65 percent of them are still using
firewood for cooking and other purposes. The reason is that the price of the refill cylinder
is high. Some of them complained that the transport persons are taking some extra
amount for bringing the cylinder. Those who have sold /not using their gas connections,
the reason is fear of fire accident, as they are residing in a hut. In some cases, the
connection is being used by their village leaders/land lord or relatives from urban area.
Those who are using gas, in some of the households living environment in and around the
kitchen is clean. Because of gas connection there is some improvement in their living
environment. This resulted in improvement in their health also. Earlier, some of them
were suffering with asthama, cold, burning eyes etc. due to smoke. Now they got
relieved from diseases and their health condition is improved, as they are free from
inhaling smoke and burning eyes. Some households explained that due to Deepam
scheme, they are finishing their cooking early, and they were getting some leisure time,
which they can spend in some productive work. In some cases, they explained that after
returning from work, instead of fire wood, they felt that gas is convenient for cooking.
Some explained that preparing of jowar chapathi on gas stove takes more time and also
not tasty when compared to fire wood. The house environment is also very clean as
smoke is not coming out from the gas stove. The roof and walls turn black when they use
fire wood, and vessels will also black and look ugly. With gas stove the vessels look
bright and clean. Some of the households still lack awareness on how to use gas stove
and cylinder. They feel that gas cylinder is dangerous, and if any thing happens their
house may be burnt in the flames. Some of the beneficiaries were selected for gas
connection and still not availed the benefit. They felt that if they took gas connection and
use it, they may loose their kerosene quota. Some beneficiaries took the gas connection
and sold them for higher prices in the near by town and local land lords. The reason is
that they got the connection on their hence they availed the facility, but they donot want
to use the connection. Some of them felt that it is difficult for them to afford to purchase
cylinder, as they get fuel and cow dung free of cost for cooking. There is a need for
9
10. further detailed study on the impact of provision of gas connection, on income
generation, health, education, environmental aspects. etc. A detailed study exclusively
on Deepam will provide a better understanding of the present situation.
Employment Assurance Scheme (EAS)
The study founds that 78 percent of the beneficiaries belonged to wage earners
(agricultural labourers), whereas 16.8 percent of cultivating families also engaged in this
activity. i.e. in all 94.9 percent of the EAS beneficiaries are landless labour and
cultivators (marginal and small farmers). The average size of the beneficiary households
is five. More than sixty percent of the beneficiaries (62.5 percent) were illiterate and 15.4
percent have informal education. About 11 percent studied primary and pre-primary
level education. Only 10 percent of the beneficiaries possess upper primary and high
school level education. 67.8 percent of households have an annual household income of
less than Rs. 8500. (4.4 percent less than Rs. 4500, 22.7 percent have an income of Rs.
4500-6000, and 40.8 percent have an household income in the range of Rs. 6000-8500.
This shows that a majority of the EAS beneficiaries are poor labourers. About 7 percent
of the non poor beneficiaries also received benefits. With regard to sustainability of
wage income and employment under EAS, it was found that once the road and building
works completed, the villagers are not getting any regular wage works other than
agriculture works. The average days employed per beneficiary in a year were found to
be 24 days. The averages wages received per beneficiary is Rs. 41 in cash, and 16 kgs in
the form of rice. No children are involved in these works. The objective of the EAS is
generation of employment on a sustainable basis and the income accrued will supplement
the beneficiary income, which in turn improve his living standards. But in practice, once
these works are completed they are not getting any sustained income through wage
components in addition to the agriculture wages.
Watershed Development Programme
The proportion of area under irrigation has increased by 19 to 129 percent among all
households. Total employment has gone up by 11 to 29 percent. Yield rates have gone
10
11. up for irrigated as well as un-irrigated crops. Only 50 percent of the watersheds studied
are economically viable in terms of incremental returns. The equity effect is not clearly
known, though the impact on rich and medium households possessing of lands seems
higher. Drinking water situation improved substantially. Ground water levels improved
to a limited extent. Migration of labour decreased during execution period. But in
majority of cases, this is not sustained after the executing period. Household’s preference
for education increased. Role of women in financial matters has improved substantially.
11
12. Chapter-I
CONTEXT, OBJECTIVES AND METHODOLOGY
1.Context of the Study
Eradication of poverty has been the overriding objective since the beginning of economic
planning in India. Eradication of poverty through overall economic and social
development by ensuring equitable access in resources and skills, as well as by widening
the opportunities for gainful employment to the deprived sections of the society, is
enunciated as the principal objective of all the rural development programmes initiated by
the government. It has assumed significance more so in the context of ongoing economic
reforms due to the apprehensions that the short-run impact of reforms may not be
favourable for the eradication of poverty. It is known that economic growth alone is not
sufficient to reduce poverty and there is a need for direct State intervention for poverty
eradication.
A number of rural development schemes and programmes have been formulated and
implemented from time to time as measures to attack rural poverty. But it was realized
that these programmes could not deliver the desired results and suffered from a number
of defects. There is also evidence to the fact that the poverty has declined due to the
target oriented Poverty Alleviation Programmes (PAPs) in the late 1980s, despite
deceleration in agriculture growth (Parthasarathy, 1995; Kannan, 1995). On the other
hand, there is an argument that an exclusive focus on poverty eradication programmes, in
the absence of good macro-economic policies resulting in sustained growth is likely to
have short-lived success at best (UNDP, 1999). Hence, it is felt that the poverty
alleviation programmes should contribute for economic growth (Rao, 1992).
The defects in the prevailing policy framework, including its preoccupation with the
immediate gains has resulted in the over exploitation of natural resources for achieving
agricultural growth and reducing rural poverty. On account of the degradation of land
and depletion of ground water resources following deforestation, it is becoming
12
13. increasingly difficult to sustain agricultural growth and rural poverty reduction without
imposing a heavy cost on the society and on the future generations. In order to make
poverty reduction process sustainable, significant initiatives have been brought over
recently to create congenial environment for poverty alleviation in terms of
decentralization to strengthen panchayat raj institutions and group approach through the
formation of women self-help groups. These initiatives are to ensure people’s active
participation in planning, implementation and post-implementation processes. There is a
need to assess the impact of these initiatives on poverty eradication process. Further,
though there are evaluation studies, concurrent and expost, they are focused on individual
components of poverty alleviation programmes and do not take cognizance of all the
components. This is required due to the fact that the focus of all the PAPs on the each of
the poor may increase the probability of the sustainability of poverty reduction process.
Moreover, there are no attempts in the evaluation studies so far conducted to examine the
poverty reduction as a process so that the contributing factors for poverty reduction can
be identified. In this backdrop, the present study is proposed to assess the performance of
PAPs in the State of Andhra Pradesh.
The PAPs can be grouped into five categories. They are: income enhancement
programmes – self employment programmes which include IRDP, DWCRA and
TRYSEM and wage employment programmes which include JRY and EAS; programmes
which focus on providing food and nutritional security viz., PDS and ICDS;
programmes which provide basic minimum services-housing, sanitation, health,
education and income maintenance programmes viz., pension schemes, maternity benefit
scheme and survival benefit scheme and natural resource management and livelihoods.
Most of the PAPs are designed by the centre and implemented by the State on fund
sharing basis for financing the programmes. The State of Andhra Pradesh has its own
programmes. It has promoted programmes like `Adarana’, `Girl Child Protection’ and
`Deepam’. The study makes an attempt to evaluate both Central Government and State
Government poverty alleviation programmes in Andhra Pradesh.
13
14. 2. Brief Review of the Literature of the Relevant Studies
The review of literature focuses on the performance of the anti poverty programmes and
issues emerged related to the programme. A brief review of the studies relating to the
evaluation of some of the programmes in Andhra Pradesh is presented below:
A. Income Enhancement Progrmmes
a. Integrated Rural Development Programme (IRDP)
The recent concurrent evaluation (Fifth Round) of IRDP in Andhra Pradesh has revealed:
the programme has covered 12 per cent of rural households. The selection by the Grama
Sabha was 60 per cent of beneficiaries - this percentage has declined from 92 in the
fourth round of evaluation; the IRDP is contributing to diversification of rural
occupations/employment, with self-employment in non-agriculture being the principal
gainer; three fifths of the assets of old beneficiaries are in productive use, and of the rest
having been sold or transferred and in respect of new beneficiaries 91 per cent are in
production use.
The average net income from IRDP asset is Rs.1898 per annum and is equivalent to less
than two months of wage earnings at the prevailing average agricultural labour for field
labour (man) in the State. A rupee of investment in IRDP assets yielded an income of
Rs.0.55. There is sizeable reduction in the proportion of the poor among old beneficiaries
- all poor having declined from 75 per cent to 56.6 per cent and very poor from 34 per
cent to 16 per cent. A sizeable proportions (a fifth with boys and a quarter with girls) of
beneficiary households have children not currently attending school. Of the beneficiary
households with children, 13 per cent have boy children and 14 per cent have girl
children working to support the family; and some of the beneficiaries (3 per cent)
continue as bonded labour (Venkataramaiah, et al, 1997).
The studies expressed concerned over the leakages during the implementation of the
programme i.e. mis- identification and non retention of the assets. Several studies have
14
15. indicated that between 15-26 percent of those identified were non-poor. The study
conducted by the NIRD reveals that about 17 percent of the beneficiaries assisted were
not in eligible for assistance (Tripathi et al, 1985). The studies conducted by ICM (1996,
97, 99) and Rao (1991, 1993) also reveal the same. Various evaluation studies revealed
that on an average 28 percent of the assets were not retained by the beneficiaries beyond
two years after the assistance (PEO1985, PNRAO 1991, 93, ICM 97, 99). The
beneficiaries find it hard to retain and use even the non- land assets without a supportive
land base. This has been confirmed by these studies. The PEO study found that 88
percent of the beneficiaries experienced income improvement. The studies by ICM, PEO,
NIRD 1985) pointed out that the acquisition of income generating schemes have led to a
process of liberation and enhancement of status to the beneficiaries cannot always be
quantified.
The study by Galab (1987), Parthasarathy (1991) and ICM (1997, 1999) indicted that
differences exist in the generation of income by various IRDP schemes across different
occupations and caste groups. The beneficiaries crossing poverty line due to IRDP varies
significantly according to different studies. The range from 49.5 percent as per PEO
study to 17 percent by the RBI study. The studies of Govt. of India (1986, 87, 89) showed
that 50 percent of the old beneficiaries have crossed poverty line of Rs. 3500 and 12-13
percent of new beneficiaries have crossed poverty line of Rs. 6400. The studies by ICM
and Rao, revealed that the crossing poverty line varies between 6-11 percent. The main
contribution is primary sector and ISB sector schemes. According to Subba Rao (1985)
the lowest income groups have the least income mobility compared to the other income
groups.
In the pursuit of poverty alleviation programmes such as IRDP and JRY etc., concern for
undertaking activities like soil conservation, water harvesting, drainage and construction
of field channels which raise agricultural productivity is not adequate. This integrated
approach is detrimental to raise agriculture productivity as well as to alleviating rural
poverty on a sustainable basis. He further emphasized that self employment programmes
like IRDP have usually proved to be more productive and better integrated with overall
15
16. development in regions which are infrastructurally developed. Less developed regions
are in greater need of labour intensive works for infrastructure development.
The studies by Sudershan (1986), George (1997) revealed that NGOs implemented
programmes are performing well when compared to government implemented
programmes. The study by Haragopal and Balaramulu (1989) revealed that panchayat raj
institutions were intended to ensure peoples participation and improving living conditions
of the people which are neglected. Another deficiency which Sankaran (1998)
highlighted was that village level institutions could not come into their own because of
inadequate devolution of responsibilities and resources in the absence of a well equipped
planning mechanism at decentralized level capable of formulating a single integrated
rural development plan with professional competence enlisting peoples participation and
safeguarding the interests of weaker sections.
b. Development of Women and Children in Rural Areas (DWCRA)
A study on the development of women through DWCRA programme conducted in
upland, delta and agency regions of West Godavari district in the year 1997-98 found:
lack of adequate staff and proper coordination of the staff located in the administrative
hierarchy is constraining the performance of the programme; the size of the DWCRA
Groups, composition of the group and institutional arrangement for maintaining the group
activity and the support mechanism provided by the programme implementation authority
are the determinants of the success of the programme; the heterogeneous groups could
also perform better, as against the popular evidence that only the homogeneous groups
perform well, provided appropriate implementing authority are ensured; and the
programme has contributed positively for the members of the groups in terms of
diversifying themselves from their traditional economic activities and increasing their
income levels which ultimately resulted in the increase of intake of nutritious food levels
(Kanchanya, 1998). On the contrary, there are some DWCRA groups, in the
drought-prone and the backward district, viz., Anantapur, which are not undertaking any
16
17. economic activity either individually or collectively, but utilising the financial assistance
as a interest free loan among themselves (Galab et. al, 1997).
Different micro level studies conducted in A.P revealed that the women with monthly
family income of more that Rs. 1000 increased from 6.5% to 55.0% in Prakasam district;
from 35% to 70% in Cuddapah district; and 1.9% to 35.3% in Adilabad districts. This
also revealed the fact that the project authorities did not take adequate care in selecting
BPL women in Cuddapah district. DWCRA scheme resulted in considerable creation of
full time employment to not only women but also to their male counter parts. The highest
benefit in terms of full time employment to women was obtained in Adilabad district
(64.4%) followed by Cuddapah (54.4%) and Prakasam districts (40%). The scheme has
also created full time employment to the male counterparts of DWCRA women to the
tune of 33% in Cuddapah, 30% in Adilabad and 23.5% in Prakasam districts. Wage
labourers were reduced from 76.8% to 8% in Adilabad and the assistance helped 4% of
housewives and 19% of self employed in their own farm to have alternative self
employment in Adilabad district in case of groups organsied in 1994-95 and 1995-96 (
Jayalakshmi, 1997). For groups organized in 1996-97 to 1997-98 in Adilabad, wage
labourers were reduced from 70% to 56%.
In an innovative study conducted by A.P Mahila Abhivruddhi societyí (APMAS), it was
found that only 16 percent of the 291 SHGs studied, can only be ranked as good based
on the impressions of the investigators on maintenance of books, meetings, internal
lending, leadership, bank linkage and overall functioning of the SHGs. 49% of them
were ranked average and 35% were ranked as poor. In all the three districts studied (
Adilabad, Cuddapah and Vizag), the groups were found to be saving on a regular basis is
78% of the groups save regularly. According to the members across different groups and
across the 3 districts, being part of a group adds value to them and has brought about an
upturn in their lives. 72% of the members of the groups are from weaker sections i.e. SC
í
A.P Mahila Abhivruddhi Society ( APMAS) is a state level technical support institution created to
address the needs of the Self-Helf movement namely quality assessment, quality enhancement and research
and advocacy. It provides technical support to DRDAs, banks, DPIP ( WB Project), AP Rural Livelihood
Project ( DFID), NGOs and other Self-Helf Promoting institutions (SHPIs)
17
18. (19%), ST(9%) and BCs (44%). The members utilize 77% of the credit for consumption
purposes. Idle funds as a percent of total funds available was very high at 33%. The study
concluded that the savings done in the group help them meet their day-to-day
consumption needs thereby reducing their dependency on money lenders ( APMAS,
2002)
c. Training of Rural Youth for Self-Employment (TRYSEM)
A study conducted in Anantapur, the drought-prone and backward district of Andhra
Pradesh has revealed: as high as 12,449 individuals have been trained under the
TRYSEM in the past 15 years - women constitute about 45 per cent, while Scheduled
Castes about 42 per cent of the total individuals trained; training was provided under 51
trades for the candidates selected; of the trained, 26 per cent are self-employed in their
trade after the completion of training, 22 per cent working as wage employees, and the
rest 42 per cent are not able to use the training in any useful way - this provides an
evidence of improper planning of the programme; and forward and backward linkages are
not provided for the economic activities undertaken after the training - this is acting as a
constraint in realising the benefits from the programme (Galab et al, 1997).
d. Wage Employment Programmes
Under rural employment programmes, NREP and RLEGP and presently JRY, and
Employed Assurance Scheme (EAS), the works undertaken have contributed for the
creation of community assets as well as assets to down-trodden sections, besides
providing wage employment to the poor. The watershed programme undertaken with
EAS and Desert Development Programme (DDP) in recent times are contributing for the
restoration of ecological balance, ensuring sustainable agriculture. The benefits flown to
the poor are relatively high from these programmes compared to the self-employment
programmes. However, these programmes have not contributed for the increase in
wages (Galab et al, 1997). The JRY programme could cover 15 per cent of the
unemployed, which can be considered as a significant creation of employment. This
programme has contributed to create interest among elected representatives and to more
18
19. wider participation. It has given greater flexibility to village Panchayats in the choice of
projects. However, the programme needed improvements in two vital respects: it is not
adequately related to agricultural development, and its location and timing needed
improvement (Parthasarathy, 1995). These studies have not evaluated the programmes in
the context of the qualitative and quantitative changes that are taking place. The studies
on labour market have pointed out that when higher wage rates exist, self employment
through asset creation will be a more effective intervention in the labour market than
wage employment programmes (Radhakrishna et al, 1998).
B. Basic Needs
a. Education
The literacy among the poor is very high. Illiteracy is more among the children who are
in the age group of 6-14 years. The gender inequalities are more pronounced among the
poor. Less than 50 per cent of the poor are utilizing Government schools in the villages.
Linking of sending children to schools with providing food security under Revamped
PDS is acting as incentives to some of the poor families to send their children to school
(Galab et al, 1997).
b. Sanitation and Housing
Many of the poor households are residing in semi-pucca and kutcha houses. Some of the
houses are in bad shape for want of maintenance. The Government has succeeded in
reaching poor through regular and IAY to provide pucca houses. However, many of the
needy poor are left out of this programme.
Sanitation has become one of the major issues in the villages. This is more so for the
women. Not only the poor but also the non-poor do not have proper sanitation facilities.
This demands that sanitation programmes have to be given top priority, as the existing
programmes are not able to reach all the people (Galab et. al, 1997).
19
20. C. Food Security and Nutrition Programmes
a. PDS and Food Security
The Government of Andhra Pradesh introduced the subsidized rise scheme in early 80s to
improve the consumption levels of the weaker sections of the society. Since August
1996, a poor household is entitled to 5 kgs of rice per person per month subject to a
ceiling of 20 kgs at Rs.3.50 per kg. Besides rice, they are entitled to sugar and kerosene.
A micro-level study conducted at village level revealed that, in the developed villages,
the scheme has provided access to food to most of the poor, but large percentage of
beneficiaries are non-poor households. In the backward villages, a large percentage of
poor households are excluded from the scheme while a sizeable percentage of the
beneficiaries belong to the non-poor category (Indrakant, 1996).
It has been estimated that the per capita monthly gain in income due to PDS in 1986-87
was nearly Rs.6 in rural areas and nearly Rs.8 in urban areas. Consequently, there was 5-
percentage point and 3-percentage point reduction in poverty in rural and urban areas of
the State, respectively (Radhakrishna et al, 1997).
b. Nutrition Programme
The nutritional and health programme targeted towards children and women in
Anantapur district is Integrated Child Development Scheme (ICDS). This programme is
found to be useful to the poor. The programme has covered only 10 per cent of the poor.
This may be due to the dominant rice subsidy scheme in Andhra Pradesh (Galab, 1997).
D. Income Maintenance Programmes
A recent study conducted on micro-level arrangements for social security at the Centre
for Economic and Social Studies has revealed: Coverage of eligible households for the
social security is inadequate in the case of State implemented social security measures;
20
21. there are, however, indigenous community responses to provide social security among
toddy-tapping and fisherman communities.
The women Self-help Groups(SHGs) promoted by the NGOs are providing social
security to the poor; the SHGs are also integrated with the State programmes and this
integration has produced good results in providing social security for the poor households
at minimum transaction costs and influencing the government to formulate innovative
programmes like `Jeevanjyothi’ for the destitute women (Galab, 1999).
Against the background of the various studies, the present study will examine the
performance of various poverty alleviation programmes such as IRDP, JRY, EAS,
DWCRA, etc., and to suggest suitable policy measures with the following objectives.
3. Objectives of the Study
1. To examine the planning and implementation of the target oriented Poverty
Alleviation Programmes (PAPs);
2. To assess the leakages of the programmes in terms of coverage of non-poor and
non-retention of assets;
3. To examine the impact of the programme on the beneficiaries in terms of changes
in occupational status, income, employment and empowerment of women;
4. To examine whether the programmes have any impact on the non-beneficiary
households;
5. To assess the contribution of the programme to the growth of the local economy;
6. To trace the process of change in the socio-economic status of the beneficiary
households due to PAPs;
7. To capture the perceptions of all the stakeholders on poverty and the existing
PAPs.
21
22. 4. Methodology of the Study
The methodology adopted in the present study differs from those of the earlier evaluation
studies. Earlier studies adopted the “before and after approach, coupled with “with and
without” principle. It should be emphasized that it would be difficult to obtain the
reliable statistical information when the gap between the year in which the programmes
were launched and the year of evaluation is wide. Hence, we had to adopt an alternative
approach, in which, income and employment derived by the beneficiary households from
each economic activity are estimated and income and employment due to the schemes are
arrived at by calculating the incremental activities generated by each scheme. This
method gives the estimates of income (employment) generated by each scheme. But one
difficulty in this approach is that after the participation in the programmes, the household
may stop (reduce) hiring out its labour and use it for the programme. However,
adjustments are made by considering employment and wage data from the households.
a. The Sample Design: The study adopted four stage - stratified - purposive –
random sampling design.
In the First stage, districts were selected. The selection of the districts was done on the
basis of the following considerations:
The state of Andhra Pradesh State consists of three regions, viz., Coastal Andhra,
Telangana and Rayalaseema. Three districts, one from each region were selected. The
selected districts represent the medium developed districts of each region. Level of
irrigation is taken as a proxy for the level of development.
In the Second Stage, mandals were selected. They were selected on the basis of level of
irrigation which is taken as a proxy of development. From each sample district Three
mandals - developed, medium developed, and less developed were selected. This is due
to the fact that level of development determines the performance of the programmes.
Thus in all 9 mandals were selected for this study.
22
23. In the Third Stage, villages were selected. Two villages from each mandal were
selected. Thus, a sample of six villages from each sample district was selected. The
villages are selected basing on coverage of programmes. Thus, in all 18 villages were
selected from three sample districts.
In the Fourth stage, the selection of households was made. In the each selected village
the households were selected on the basis of their occupation category, caste affiliations
and coverage of programmes. Besides this, non-beneficiaries from among the eligible
poor are also selected to identify reasons for their non-participation in the poverty
alleviation programmes. The summary of the sample design of the study is presented in
Table 1.1.
b. Surveys and Data Collection: The study made use of secondary as well as
primary data. The secondary data on various schemes were collected from mandal,
district and state level agencies. The primary data were collected from beneficiary and
non-beneficiary households through structured questionnaires.
Household (census as well as sample) surveys with structured schedules, PRA exercise,
and group discussions with village elders, community leaders, women groups,
implementing agencies, non- officials and NGOs were done. Case studies of beneficiaries
were constructed to examine the process of poverty alleviation. The summary of the
impact assessment methods adopted by the study are presented in Table 1.2
23
24. Table 1.1
SAMPLE DESIGN OF THE STUDY
Sl. Descrip- Descrip- Criteria Description of Description of the Number of Sample Units
No. tion of tion of the Adopted for the the Sample Sample Units Selected
the Sampling Selection of Method
Stage of Unit Sample Units Adopted
Sampling
1 I Stage District Level of Stratified Nalgonda 3 districts. One from each
Irrigation as Purposive Anantapur geographical region
proxy for Sampling Vizianagaram/
development. West Godavari
2 II Stage Mandals Level of Stratified Miryalguda, Nine mandals covering
Development. Purposive S. Atmakur and three mandals from each
Sampling S.Gowraram sample district
(from Nalgonda)
,Parvatipuram,
Gantyada and
Garividi (from
Vizianagaram),
Garladinne,
Nallamada and
Kambadur from
Anantapur district
3 III Stage Villages Coverage of Stratified Ootlapally, 18 villages. Six villages
Programmes. Random Thakkallapally, from each sample district.
Sampling Vallala,Itukulapahad,
Gattikal and Kothapad
(Nalgonda district)
Sirivaram,
Yerraguntla,
Mulkanur,
Reddypally,
Choutakuntapally &
Chennampalem
(Anantapur district)
Kirthibarthi, Vasanta,
kapusambam
K L Puram,
Narsipuram &
Addapuseela
(Vizianagaram dist)
4 IV stage Households Beneficiaries & Stratified 360 households. 20
non beneficiaries Random household from each
on the basis of Sampling village.
their Occupation
and Caste
affiliation and
coverage of
programmes
Note : Level of Irrigation ( i.e., Percentage of gross irrigated area to the gross cropped
area) is taken as the proxy for the development of rural areas.
24
25. Table 1.2
Impact Assessment Methods Adopted by the Study
Sl. No. Description of the Method Description of the Units Covered
1. Survey Method
a. Census Survey All households in 18 villages
b. Sample Survey Selected beneficiary and non-beneficiary
households
2. Rapid Appraisal Method
a. Focus group discussions Beneficiary and non beneficiary households
b. Semi Structured 1.Various implementing agencies at district
interviews with key and mandal levels
informants
2. Non-Governmental Organisations
(NGOs)
3. Village elders, community leaders and
Knowledgeable persons
25
26. CHAPTER-II
PERFORMANCE OF THE PAPS AT MACRO-LEVEL
The evaluation of the impact of anti-poverty programmes has been done at two levels:
macro-level and micro-level. Coverage of poor under different programmes has been
assessed at the state level in macro-level evaluation. In micro-level evaluation, the issues
taken for evaluation include retention of assets in case self employment programmes
(IRDP) and (DWCRA), participation in wage employment programmes (JRY) and
coverage under IAY; benefits flown from the assets in terms of gain in income and
employment and reduction in the deprivation of houseless ness; infrastructure
development at the village level through JRY and the problems faced by the beneficiaries
in obtaining the assets as well as in maintaining the same, mostly in case of self-
employment programmes. At the same time, the indirect benefits from PAPs are also
examined in terms of their empowerment captured through their participation in state
promoted community based organizations (CBOs) viz., watershed associations, water
users associations, mothers committees, village education committees, Vana
Samrakshana Samithis (VSS) and other associations promoted by the civil societies. In
what follows is the detailed account of evaluation of each programme.
As an entry point, in this chapter we examine allocative efficiency by looking at the
coverage of poor population under various schemes under Rural Development
Department.
a. Rural Poverty Ratios: The official estimates from Government of India show low
rural poverty (15.9%) in A.P. On the other hand, other estimates of rural poverty
incidence suggest a significantly higher head count ratio in rural Andhra Pradesh. In a
study on prices and poverty in India, Deaton (1999) estimates unit prices for different
states for the years 1987-88 and 1993-94. Deaton’s estimates suggest that the rural
poverty line for Andhra Pradesh is more or less similar to all India. According to his
estimates, rural poverty ratio for Andhra Pradesh ranges from 29 to 33 % in 1993-94. The
26
27. GOAP has also been using a higher poverty line (Rs. 187 in 1993-94). Based on this
poverty line, the rural head count ratio comes to around 27 % in 1993-94.
Table2.1: Different Estimates of Rural Poverty for Andhra Pradesh: 1993-94 (%)
Studies Head Count Ratio
Expert Group Method 15.9
GOAP 27.0
Deaton, A. 33.0
Note: Deaton's numbers range from 29 per cent to 33 per cent.
Source: Rural Poverty Reduction Task Force Report (GOAP, 2000)
b. Population and Poor : In order to examine the coverage of poor, we need the number
of rural poor in different years. We used the following procedure to get these numbers as
given in Table 2.2.
Table 2.2. Population and Poor
(in Lakhs)
Year Total Rural Rural Poor Rural Poor Rural Poor
Population Population (Using (Using 27% (Using 33%
15.9% poverty poverty
poverty ratio) ratio)
ratio)
1991 665.08 486.21 77.31 131.28 160.45
1993-94 699.38 511.65 81.35 138.15 168.85
1995-96 721.46 527.46 83.87 142.41 174.06
1996-97 730.29 533.92 84.119 144.16 176.19
1997-98 738.48 539.91 85.85 145.78 178.17
1998-99 746.87 546.04 86.82 147.43 180.19
1999-2000 755.58 552.40 87.83 119.15 182.29
2000-2001 764.32 558.119 88.85 120.87 184.41
• The total population figures for the period 1991 to 2001 are taken from the state
Government's Statistical Abstract 1999. The proportion of rural population in total
population of A.P.in 1991 was 73.11 per cent. Same percentage is used to get the
rural population for the subsequent years.
27
29. • We have three numbers of rural poverty ratios (15.9%, 27% and 33%) for the year
1993-94. The same ratios are used for the subsequent years. Applying these numbers
to the rural population provide us the number of rural poor as given in cols. 4-6 of
Table 2.2
c. Rural Poor by Age Groups and Families : In order to examine the coverage of poor
under different schemes, we have to derive the age-specific poor population. We have
used the 1991 proportion of age specific rural population to get age-specific poor
population as given in Table 2.3. For this report, we have used only one poverty ratio (33
per cent) to get the age-specific rural poor. The table shows the age specific rural poor for
15-59, 20-35 and 60+ age groups. To derive the number of families, we assumed family
size as five.
Table 2.3. Rural Poor by Age-Groups and Rural Poor Families
(Using Poverty Ratio of 33%)
(In Lakhs)
Year 15-59 age- 20-35 age 60+ age group No.of Poor
group group Families
1991 90.08 37.83 12.16 32.09
1993-94 94.119 39.81 12.80 33.77
1995-96 97.72 41.04 13.19 34.81
1996-97 98.91 41.55 13.36 35.24
1997-98 100.02 42.01 13.50 35.63
1998-99 101.16 42.49 13.66 36.04
1999-2000 102.34 42.98 13.82 36.46
2000-2001 103.53 43.48 13.98 36.88
d. Coverage of Rural Poor Under IRDP/SGSY : We have used rural poor under 15-
59 age group for IRDP because they belong to the working age group. Table 2.4 shows
the beneficiaries under IRDP/SGSY and the coverage. The percentage of poor people
covered under IRDP was very low at 1.26 per cent in 1995-96. It increased in 1996-97
but declined later. The percentage of poor covered under SGSY was 2.84 per cent.
29
30. Table 2.4. Coverage of the Rural Poor (age group 15-59)under IRDP/SGSY
Year Rural Poor Beneficiarie % of poor Benficiaries % of Poor
under 15-59 s under people under covered
age-group IRDP covered SGSY under
(in Lakhs) (In Lakhs) under (in Lakhs) SGSY
IRDP (%)
(%)
1995-96 97.72 1.229 1.26 -- --
1996-97 98.91 2.031 2.05 -- --
1997-98 100.02 1.621 1.62 -- --
1998-99 101.16 1.41 1.40 -- --
1999-2000 102.34 -- -- 2.910 2.84
e. Coverage under TRYSEM: Under TR YSEM, the population under 18-35 age group
is given training. We have taken 20-35 age- group as we do not have proportions for 18-
35 age group. The coverage under TRYSEM was also very low. The trends are similar to
those for IRDP.
Table 2.5. Coverage of the Rural Poor (age-group 20-35) under TRYSEM
Year Rural Poor under Beneficiaries under % of poor covered
15-59 age group (in TRYSEM (in under TRYSEM
Lakhs) Lakhs) (%)
1995-96 41.04 0.198 0.48
1996-97 41.55 0.010 2.43
1997-98 42.01 0.271 0.65
1998-99 42.49 0.236 0.56
f. Coverage Under National Old Age Pensions (NOAP): We have used above 60+
population to examine coverage under NOAP. The coverage under NOAP seems to be
substantial. It was around 35.58% in 1995-96. It increased significantly since 1996-97
and reached around 94 per cent in 1999-2000.
30
31. Table 2.6. Coverage of the Rural Poor (age-group 60+) under NOAP
Year Rural Poor under Beneficiaries under % of poor covered
60+ age group (in NOAP (in Lakhs) under NOAP (%)
Lakhs)
1995-96 13.19 4.693 35.58
1996-97 13.36 8.944 66.95
1997-98 13.50 8.944 66.25
1998-99 13.66 10.944 80.12
1999-2000 13.82 12.944 93.66
g. Coverage Under Development of Women and Children in Rural Areas
(DWCRA), National Family Benefit Scheme (NFBS), and National Maternity
Benefit Scheme (NMBS)
• The coverage under DWCRA was less than 1 per cent and declined over time. But in
recent years the coverage of DWCRA is quite high.
• The Coverage under NFBS was also less than one per cent but showed fluctuations
• The coverage under NMBS was higher than two schemes. It increased significantly in
1997-8 to 13 per cent and thereafter it declined.
Table 2.7.Coverage of the Rural Poor Families Under DWCRA, NFBS and NMBS
Year No.of Benefici % of Benefici % of Benefici % of
Rural aries poor aries poor aries poor
Poor under families under families under families
Families DWCR covered NFBS covered NMBS covered
A (in under (in under (in under
Lakhs) DWCR Lakhs) NFBS Lakhs) NMBS
A (%) (%) (%)
1995-96 34.81 0.172 0.49 0.045 0.13 2.039 5.86
1996-97 35.24 o.177 0.50 0.292 0.83 2.480 6.81
1997-98 35.63 0.070 0.20 0.492 0.55 4.659 13.10
1998-99 36.04 0.038 0.11 0.386 0.29 4.041 11.2
1999-2000 36.46 -- -- 0.310 0.85 3.476 9.53
31
32. Chapter 3
PERFORMANCE OF THE PAPs AT MICRO-LEVEL.
The Government of Andhra Pradesh has adopted a multifold strategy to eradicate
poverty, which is multi-dimensional. The following are the key elements of the strategy.
These elements of the strategy are inter-linked and build on each other.
1. Pursuit of rapid economic growth.
2. Promotion of human development
3. Enhancing social capital of the poor by fostering organizations of the poor and
their capacity building
4. Promotion of sustainable livelihoods of the poor
5. Focus on backward mandals and the poorest of the poor.
6. Re-designing the administrative delivery machinery.
In line with this strategy, the performance of poverty alleviation programmes
implemented in AP is assessed. The performance of poverty alleviation programmes at
micro-level is assessed in terms of coverage, leakage and their impact. Different poverty
alleviation programmes implemented in Andhra Pradesh are categorized under the
following five broad groups:
I. Income enhancement programmes.
There are two types in this group.
A. Self- employment programmes which include IRDP, DWCRA, and
TRYSEM.
B. Wage employment programmes which include JRY.
II. Food and nutritional programmes : ICDS.
III. Minimum needs programme : Indira Awas Yojana (IAY).
32
33. IV. Income maintenance programmes : Pensions schemes, Maternity Benefit
Programmes
and Survival Benefit Programmes,
V. Natural resource management and livelihoods: Watershed Development.
A census study was conducted among 7170 households. A sample of 358 beneficiaries
and 70 non- beneficiaries have been selected from the households covered in census
survey. Information was collected from all the 358 households to examine the
implementation of different Poverty Alleviation Programmes (PAPs) as listed above.
Table 3.1: District –wise Sample Study Villages
Sl. District Mandal Village
No
1 Anantapur Garladinne Sirivaram
Yerraguntla
Nallamada Chowtakuntpally
Reddypally
Kambadur Mulkanur
Chennampalem
2 Vizianagaram Gantyada Krithiburthy
Vasanta
Garividi Kapusambam
K L Puram
Parvatipuram Narsipuram
Addapuseela
3 Nalgonda Miryalguda Ootlapally
Thakkallapally
S. Gowraram Vallala
Itikalapadu
S. Atmakur Gattikal
Kothapad
33
34. Census Survey
Census study has been undertaken to analyze the demographic and social characteristics
of all the households in the 18 study villages spread over 9 mandals of 3 districts. The
socio-economic characteristics such as land holdings size, occupation, caste composition,
educational levels are examined to understand the level of living of the population.
Besides this, retention of assets, level of empowerment of people is also analyzed in the
developed as well as backward mandals.
Households and Population: There are 7170 households in the 18 study villages. Out of
which 4184 households belong to backward mandals and the rest 2986 households are
from developed mandals. Of the total households, 21.3% belong to Scheduled Caste,
6.3% STs, 54.6% BCs, and the rest 17.8% Ocs (table 3.4). In both backward and
developed mandals BCs constitute a substantial proportion (58.3%, and 49.2%
respectively), while the SC constitute 6 and 6.8 respectively (table 3.2)
Table 3.2: Demographic Particulars Across Caste Groups
Sl Particulars Backward mandals
No SC ST BC OC Total
1 Households 871 251 2439 623 4184
20.8 6.0 58.3 14.9 100.0
2 Population 3717 1060 10777 2766 18320
20.3 5.8 58.8 15.1 100.0
3 Adult males 1179 334 3876 990 6379
18.5 33 60.7 15.5 34.81
4 Adult females 1196 377 3731 1023 6327
19.0 6.0 58.9 16.1 34.53
5 Children 1342 349 3170 753 5614
24.0 6.2 56.4 13.4 30.64
6 Household size 4.3 4.2 4.4 4.4 4.4
(Avg)
The total population of the 18 sample villages is 31248, of which 34.38 percent adult
males, 33.73 percent adult females and the rest 31.89 percent children. The average size
of the family is 4.4. In the backward mandals, the size of the household is the highest
among BCs and OCs (4.4%), while it was less among STs (4.2 %). But in the developed
mandals the household size is 4.1 among SCs (table 3.3).
34
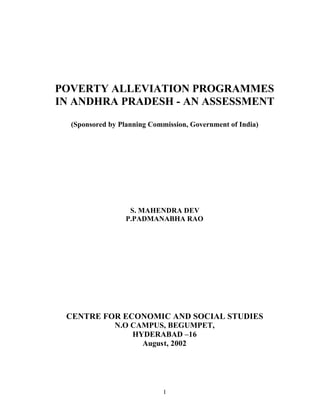
35. DISTRICT WISE POPULATION
50
40
30 VIZIANAGARAM
ANANTAPUR
20 NALGONDA
10
0
Male Female Children
Population Across Social Groups
100
% of population
80 VIZIANAGARA
M
60 ANANTAPUR
40
NALGONDA
20
0
SC ST BC OC
Social Groups
35
36. Table 3.3. Demographic Particulars across Caste Groups
Sl Particulars Developed mandals
No SC ST BC OC Total
1 Households 656 204 1469 657 2986
22.0 6.8 49.2 22.0 100.0
2 Population 2691 869 6489 2879 12928
20.8 6.7 50.2 22.3 100.0
3 Adult males 824 286 2217 1037 4364
18.9 6.5 50.8 23.8 33.75
4 Adult females 811 298 2139 964 4212
19.2 7.1 50.8 22.9 32.58
5 Children 1056 285 2133 878 4352
24.3 6.5 49.0 20.2 33.66
6 Household size 4.1 4.3 4.4 4.4 4.3
(Avg)
The category analysis shows that average size of household is highest at 4.6 among
cultivators and less at 4.2 among agricultural labour and non- agricultural labour in the
backward mandals. In the developed mandals same trend is continuing (appendix).
Table 3.4. Demographic Particulars across Caste Groups (overall)
Sl Particulars Overall
No SC ST BC OC Total
1 Households 1527 455 3908 1280 7170
21.3 6.3 54.6 17.8
2 Population 6408 1929 7266 5645 31248
20.5 6.2 55.2 18.1
3 Adult males 2003 620 6093 2027 10743
18.6 5.8 56.7 18.8 34.35
4 Adult females 2007 675 5870 1987 10539
19.1 6.4 55.7 18.8 33.73
5 Children 2398 634 5303 1631 9966
24.1 6.4 53.2 16.3 31.39
6 Household size 4.2 4.2 4.4 4.4 4.4
(Avg)
Note: Figures in parenthesis indicate percentage to the totals
Social and Occupational Groups: Of the total population covered by the survey, in the
backward mandals 58.5 percent belongs to BCs, 20.8 percent SCs, 6.0 percent STs, and
the rest 14.9 percent OCs. Whereas in the developed mandals also, a substantial
proportion of population is from backward classes (55.2 percent), followed by SCs (20.5,
36
37. and OC (18.1%). By occupation – wise, agricultural labour constitute a substantial
portion in the backward mandals (32.7), where as cultivators followed by agricultural
labour (35.0 percent) constitute major share in the developed mandals (47.1 %)
(appendix 2).
ALL THREE DISTRICTS
14%
22%
SC
ST
7%
BC
OC
57%
Educational Status: Educational level helps in proper utilization and retention of assets
provided under different schemes. More than half (63.1 %) of the persons in the
surveyed households were found to be illiterate. The proportion of illiterates in the
backward mandals is 71.8 %, whereas in the developed mandals it is 50.8 percent
(appendix).
In the backward mandals, 10 % of the households has at least primary or pre-primary
level of education, whereas in the developed mandal the proportion of BCs is 26.8
percent, followed by OCs. At the high school and college level the proportion of BCs
37
38. and OCs are more than 60 percent. The educational level of SCs and STs at all the levels
are less than 20 percent. The occupation wise analysis shows that there are more number
of educated among the cultivators when compared to other category of households. The
illiteracy among the agricultural labourers is 40.6%. This is more in the backward
mandals (appendix 3).
In the developed mandals, the illiterates are more among BCs (48.5 percent), followed by
OCs (25.1 percent). But BCs and OCs have a major share in all the educational
categories. The percentage of illiterates is more among agricultural labourers (45.3
percent). But in all the educational categories, the proportion of cultivators is more
(appendix 3).
Land holding size: According to land holding size, the beneficiaries are categorized into
six groups viz., large farmers (more than 10 acres), Semi-medium farmers (7.5 – 10
acres), medium farmers (5-7.5 acres), small farmers (2.5 – 5.0 acres), Marginal farmers
(less than 2.5 acres), Agricultural and non- agricultural labourers & others (appendix 4).
The proportion labour households are very less in OCs (12.5 percent) in the sample study
villages. The proportion of SCs and STs are more in the labour and other category of
households both in developed and backward mandals. The percent of agricultural
labourers are more pronounced in the developed mandals (58 percent) when compared to
backward mandals (41.2 percent). The major proportion of large land holdings (>10
acres) has been possessed by other caste households (68.1%). This proportion is 74.4
percent in the Developed mandals and 63.8 percent in the backward mandals. The
majority of medium farmers possessed 5 acres or more land (54.5 percent), whereas the
majority of small holdings (less than 2.5 acres) are possessed by BC in the backward
mandals (appendix 4).
Income: The households income are categorized into 5 income groups i.e. less than Rs.
4500 (destitute), Rs. 4500-6000 (very poor), Rs. 6501 – 8500 (poor), Rs. 8500-12000
(moderately poor) and Rs. 12000 and above (non poor).
38
39. Table 3.5. Household Income across Caste Groups
Sl Annual Income Backward mandals
No (in Rs.) SC ST BC OC Total
1 Upto Rs. 4500 18.94 2.39 8.0 2.41 381 (9.11)
2 Rs. 4501-6000 22.04 13.94 20.46 11.08 795 (19.0)
3 Rs. 6001-8500 27.67 44.22 31.86 21.99 1266 (30.2)
4 Rs. 8501-12000 22.85 25.5 19.64 32.74 946 (22.6)
5 Above Rs. 12000 8.27 13.94 20.05 31.78 796 (19.02)
6 Total 871 (100.0) 251((100.0) 2439 (100.0) 623 (100.0) 4184 (100.0)
Sl Annual Income Developed mandals
No (in Rs.) SC ST BC OC Total
1 Upto Rs. 4500 1.83 .98 2.65 5.33 88 (2.95)
2 Rs. 4501-6000 7.47 8.33 7.15 12.02 250 (8.36)
3 Rs. 6001-8500 53.05 58.33 39.28 24.96 1208 (40.45)
4 Rs. 8501-12000 31.1 24.51 30.77 22.68 855 (28.39)
5 Above Rs. 12000 6.55 7.84 20.15 35.01 585 (19.59)
6 Total 100.0 100.0 100.0 100.0 2986 (100.0)
Sl Annual Income Overall
No (in Rs.) SC ST BC OC Total
1 Upto Rs. 4500 11.59 1.76 5.98 3.91 469 (6.54)
2 Rs. 4501-6000 15.78 11.43 15.45 11.56 1045 (14.57)
3 Rs. 6001-8500 38.57 50.55 34.65 23.51 2474 (34.50)
4 Rs. 8501-12000 26.39 25.05 23.82 27.58 1801 (25.12)
5 Above Rs. 12000 7.66 11.21 20.01 33.44 1381 (19.26)
6 Total 100.0 100.0 100.0 100.0 7170 (100.0)
Of the total 7170 households, 19.26 households are non poor i.e. they have an annual
income of Rs. 12000 or more. The percentage of non-poor is high among OCs (33.44%)
followed by BCs (20.0%), STs (11.21%) and SCs (7.66%). People farther away from
poverty line i.e. households getting less than Rs. 6000 per annum is high among SCs
(27.37%). It shows that SCs are the most deprived section in the sample villages.
Though the total percent of population below poverty line is almost same for backward
and developed mandals, the percent of households farther away from poverty line (Rs.
6000 per annum) is high in backward mandals (28.11%) than developed mandal
(11.31%).
39
40. Ownership of Assets: In the Backward mandals all the plough bullocks are with BCs
(60.6 percent), followed by OCs with 22.9 percent. 90 percent of sheep are with BCs
most of them are traditional golla caste, whereas 35 percent of goats are with SCs. In the
developed mandals similar trend is observed. Thus in overall the study shows that more
than 50 percent of the assets are owned by the cultivators of which majority of them are
BCs. The agricultural labourers owned more sheep and goat units than cultivators.
Membership in Village Societies: Membership in village societies across caste groups
in the sample villages is shown in table 3.6.The social capital represented by membership
in village societies viz., milk societies, watershed committees, water user associations,
education committee, mothers committee and other committees was more pronounced in
developed mandals. 87.4 percent of total members in societies in the sample villages are
from developed mandals only. In the developed mandals, percent of members from B.Cs
is higher (64.81) than that in backward mandals (51.97%). S.Ts could not participate in
village societies in backward mandals. However, they formed 3.63 percent of total
membership in developed mandals. The role played by O.Cs in the total membership in
developed mandals (16.57%) is less than that in backward mandals (21.26%) on the
whole, the membership in village societies is from B.Cs (63.19%), followed by O.Cs
(17.16%),SCs (15.28%) and S.Ts (3.17%).
Table 3.6 . Membership in Village Societies across Caste Groups
Sl Particulars Backward mandals
No SC ST BC OC Total
1 Milk societies 17.6 0 54.4 28.0 68
2 Watershed committee 50.0 50.0 6
3 Water users associations 75.0 25.0 8
4 Education committee 70.5 11.9 17
5 Mothers committee 80 0 20.0 20.0 14
6 Other committee 35.7 57.1 7.2 14
Total 22 66 27 127
Sl Particulars Developed mandals
No SC ST BC OC Total
1 Milk societies 2.7 6.6 75.3 15.4 182
2 Watershed committee 0 0 90.0 10.0 10
3 Water users associations 0 0 100.0 0 1
4 Education committee 6.7 60.0 33.3 15
5 Mothers committee 12.5 0 87.5 0 16
6 Other committee 18.9 3.1 61.0 17.0 657
Total 132 32 571 146 881
40
41. Sl Particulars Overall
No SC ST BC OC Total
1 Milk societies 6.8 4.8 69.6 18.8 250
2 Watershed committee 0 0 75.0 25.0 16
3 Water users associations 0 0 77.8 22.2 9
4 Education committee 12.5 0 65.6 21.9 32
5 Mothers committee 22.2 0 77.8 0 30
6 Other committee 19.4 2.9 60.9 16.8 671
Total 154 32 637 173 1008
Availing Development Programmes in Sample Villages: It was observed from table
3.7 that a higher proportion of IRDP beneficiaries (57.18%), SHG beneficiaries
(56.88%), IAY beneficiaries (51.83%), old age pensioners (55%), widow pensioners
(52.83%) are from developed mandals. However, people from backward mandals utilized
JFM programme (80.39%), JRY/ EAS (63.88%) and DWCRA (57.11%) in a higher
proportion (table 3.7)
On the whole, retention of assets is high. It is 76.06 percent in IRDP; 82.78 percent In
DWCRA and 88.53 percent for Deepam (gas connections). Beneficiaries from developed
mandals showed higher retention of assets.
Table 3.7: Utilization of Development Programmes in Sample Villages
Sl.no Particulars Backward Developed Overall
Mandals Mandals
1 IRDP beneficiaries 152 (42.82) 230 (57.18) 355 (100)
2 Status of the asset (asset) 68.42 81.77 76.06
3 DWCRA beneficiaries 859 (57.11) 645 (42.89) 1504 (100)
4 Status of the asset (intact) 75.32 92.71 82.78
5 SHG beneficiaries 682 (47.73) 747 (52.57) 1429 (100)
6 Involvement of JRY/EAS 313 (63.88) 177 (36.12) 490 (100)
7 Deepam beneficiaries 188 (43.12) 248 (56.88) 436 (100)
8 Connection status (intact) 89.30 88.71 88.53
9 IAY beneficiaries 395 (48.17) 425 (51.83) 820 (100)
10 JFM beneficiaries 41 (80.39) 10 (19.61) 51 (100)
11 Old age pensions 72 (45.0) 88 (55.0) 160 (100)
12 Widow pensions 25 (47.17) 28 (52.83) 53 (100)
13 Maternity benefits 56 (50.0) 56 (50.0) 112 (100)
41
42. Availing of various development programmes across caste groups is shown in table 3.8
for both backward and developed mandals. In the sample villages, SCs are the main
beneficiaries, from JRY/EAS (59.4%) and IAY (62.4%). STs constituted major part of
JFM beneficiaries with 43.1 percent of the total. Members from BCs are the main
beneficiaries in all other schemes.
SCs from backward mandals utilized DWCRA, SHG and Deepam schemes better than
their counterparts in developed mandals. They comprised higher proportion under these
schemes than SCs from developed mandals. However retention of assets is higher among
SCs of developed mandals only. OCs from developed mandals formed higher proportion
of beneficiaries in developmental programmes than OCs from backward mandals.
Table 3.8. Availing Development Programmes across Caste Groups
Sl Particulars Backward mandals Developed mandals Overall
No SC ST BC OC Total SC ST BC OC Total SC ST BC OC Total
1 IRDP 22.37 4.61 57.24 15.79 100.0 22.66 3.94 52.71 20.69 100.0 22.54 4.23 54.65 18.59 100.0
beneficiaries
2 Status of the 67.6 85.7 67.8 66.7 68.42 67.4 400.0 84.1 88.1 81.7 67.5 93.4 76.8 80.3 76.1
asset (asset)
3 DWCRA 26.9 13.1 48.7 11.3 100.0 12.9 10.9 57.5 18.7 100.0 20.8 12.2 52.5 14.5 100.0
beneficiaries
4 Status of the 71.4 95.5 73.4 69.1 75.3 90.4 90.0 92.7 95.8 92.7 76.4 93.4 825 83.9 82.8
asset (intact)
5 SHG 42.1 1.8 42.5 13.6 100.0 22.2 5.4 52.6 19.8 100.0 31.7 3.6 47.8 16.9 100.0
beneficiaries
6 Involvement of 63.9 1.9 31.0 3.2 100.0 51.4 1.7 42.4 4.5 100.0 59.4 1.8 35.1 3.7 100.0
JRY/EAS
7 Deepam 54.8 5.3 29.3 10.6 100.0 19.8 8.5 54.8 16.9 100.0 34.9 7.1 43.8 14.2 100.0
beneficiaries
8 Connection 81.6 100.0 94.5 100.0 88.3 93.8 80.9 87.5 90.5 88.7 85.5 87.1 89.5 93.5 88.5
status (intact)
9 IAY 54.9 17.2 24.1 3.8 100.0 69.4 5.2 21.9 3.5 100.0 62.4 11.0 22.9 3.7 100.0
beneficiaries
10 JFM 31.8 53.6 14.6 100.0 60.0 30.0 10.0 100.0 37.3 43.1 17.6 2.0 100.0
beneficiaries
11 Old age 16.7 11.1 58.3 13.9 100.0 27.3 9.1 43.2 20.4 100.0 22.5 10.0 50.0 17.5 100.0
pensions
12 Widow pensions 32.0 56.0 12.0 100.0 21.4 10.7 25.0 42.9 100.0 26.4 5.7 39.6 28.3 100.0
13 Maternity 32.0 56.0 12.0 100.0 21.4 10.7
benefits
Availing Development Programmes across Occupational Category: The scheme-wise
availing of development programmes across occupational categories in both backward
and developed mandals is shown in table 3.9. Cultivators and agricultural labourers are
the main beneficiaries from all the development programmes in the sample villages.
Together, they account for more than 70 percent of beneficiaries in all the programmes.
Overall, cultivators form 46.2 percent of IRDP beneficiaries, as against only 31.8 percent
42
43. by agricultural labourers. However, JRY/EAS, IAY and JFM are utilised mainly by
agricultural labourers and they formed 57.4, 59.0 and 88.3 percent of beneficiaries,
respectively.
Agricultural labourers in backward mandals could get higher share in the development
programmes, as the cultilvators’ share in these mandals is less than that of their
counterparts in developed mandals
Table 3.9. Availing Development Programmes across Occupational Category
Backward Mandals
Sl.no Particulars Cultivator Agl.lab Nagl Artisan Trade Service Others Total
1 IRDP beneficiaries 48 (31.6) 598 (38.8) 12 (7.9) 7 (4.7) 13 (8.5) 0 13 (8.5) 152
2 Status of the asset (intact) 44 (91.6) 47 (79.6) 3 (25.0) 4 (57.1) 2 (15.4) 0 4 (30.7) 104
3 DWCRA beneficiaries 147 (16.9) 391 (45.5) 94 (10.9) 31 (36) 49 (5.7) 25 (2.9) 122 (14.2) 859
4 Status of the asset (intact) 118 (80.2) 319 (81.5) 90 (95.7) 28 (90.3) 26 (53.1) 21 (84.0) 45 (36.8) 647
5 SHG beneficiaries 181 (26.5) 254 (37.3) 150 (21.9) 20 (2.9) 23 (3.4) 18 (2.7) 36 (5.3) 682
6 Involvement of JRY/EAS 76 (24.3) 165 (52.7) 28 (8.9) 11 (3.5) 7 (2.3) 5 (1.6) 21 (6.7) 313
7 Deepam beneficiaries 63 (33.5) 57 (30.3) 43 (22.9) 1 (0.5) 3 (1.6) 2 (1.1) 19 (10.1) 188
8 Connection status (intact) 63 (100) 42 (73.6) 41 (95.3) 1 (100) 3 (100) 2 (100) 14 (73.6) 166
9 IAY beneficiaries 75 (19.0) 226 (57.2) 51 (12.9) 6 (1.5) 5 (1.3) 3 (0.8) 29 (7.3) 395
10 JFM beneficiaries 1 (2.4) 38 (92.7) 2 (4.9) 0 0 0 0 41
11 Old age pensions 5 (6.9) 40 (55.6) 11 (15.2) 1 (1.4) 2 (2.8) 3 (4.2) 10 (13.9) 72
12 Widow pensions 3 (12.0) 15 (60.0) 2 (8.0) 0 2 (8.0) 1 (4.0) 2 (8.0) 25
13 Maternity benefits 21.43 26.79 21.43 10.71 8.93 3.57 7.14 56
Developed Mandals
Sl.no Particulars Cultivat Agl.lab Nagl Artisan Trade Service Others Total
or
1 IRDP beneficiaries 116 (57.1) 54 (26.6) 14(6.9) 3 (1.5) 5 (2.5) 2 (1.0) 9 (4.4) 203 (100)
2 Status of the asset intact) 101 (87.1) 34 (62.9) 13 ((92.8) 3 (100) 5 (100) 2 (100) 8 (88.9) 166 (81.8)
3 DWCRA beneficiaries 326(50.5) 169 (26.2) 81 (12.6) 6 (0.9) 11 (1.7) 9 (1.4) 43 (6.7) 645 (100)
4 Status of the asset (intact) 305 (93.6) 158 (93.5) 81 (100) 6 (100) 10((90.9) 9 (100) 29 (67.4) 595 (92.7)
5 SHG beneficiaries 384 (51.4) 261 (34.9) 31 (4.3) 10 (1.3) 22 (2.9) 13 (1.7) 26 (3.5) 747 (100)
6 Involvement of JRY/EAS 43 (24.3) 116 (65.6) 3 (1.7) 3 (1.7) 2 (1.1) 5 (2.8) 5 (2.8) 177 (100)
7 Deepam beneficiaries 115 (46.4) 73 (29.4) 27 (10.9) 4 (1.6) 8 (3.2) 5 (2.0) 16 (6.5) 248(100)
8 Connection status (intact) 104 (90.4) 68 (93.2) 22 (81.4) 4 (100) 8 (100) 4 (80.0) 10 (62.5) 220 (88.7)
9 IAY beneficiaries 122 (28.7) 258 (60.7) 9 (2.2) 4 (0.9) 3 (0.6) 9 (2.2) 20 (4.7) 425 (100)
10 JFM beneficiaries 3 (30.0) 7 (70.0) 00 0 0 0 0 10 (100)
11 Old age pensions 20 (22.7) 47 (53.4) 7 (8.0) 0 2 (2.3) 4 (4.5) 8 (9.1) 88 (100)
12 Widow pensions 8 (28.6 14 (50.0) 3 (10.7) 1 (3.5) 0 0 2 (7.2) 28 (100)
13 Maternity benefits 37.5 39.29 1.79 5.36 1.79 5.36 8.93 100.0
43