SlideShare a Scribd company logo
1 of 7
Diffusion and Osmosis
         Many aspects of the life of a cell depend on the fact that atoms and molecules have kinetic energy and
are constantly in motion. This kinetic energy causes molecules to bump into each other and move in new
directions. One result of this molecular motion is the process of diffusion.
         Diffusion is the random movement of molecules from an area of higher concentration of those molecules
to an area of lower concentration. For example, if one were to open a bottle of hydrogen sulfide (H2S has the odor
of rotten eggs) in one corner of a room, it would not be long before someone in the opposite corner would
perceive the smell of rotten eggs. The bottle contains a higher concentration of H 2S molecules than the room does
and, therefore, the H2S gas diffuses from the area of higher concentration to the area of lower concentration.
Eventually a dynamic equilibrium will be reached; the concentration of H 2S will be approximately equal throughout
the room and no net movement of H2S will occur from one area to the other.
         Osmosis is a special case of diffusion. Osmosis is the diffusion of water through a selectively permeable
membrane (a membrane that allows for diffusion of certain solutes and water) from a region of higher water
potential to a region of lower water potential. Water potential is the measure of free energy of water in a solution.
          Diffusion and osmosis do not entirely explain the movement of ions or molecules into and out of cells.
One property of a living system is active transport. This process uses energy from ATP to move, substances through
the cell membrane. Active transport usually moves substances against a concentration gradient, from regions of
low concentration of that substance into regions of higher concentration.

Exercise 1: Qualitative Observation of Diffusion
In this experiment you will qualitatively measure diffusion of small molecules through dialysis tubing, an example
of a selectively permeable membrane. Small solute molecules and water molecules can move freely through a
selectively permeable membrane, but larger molecules will pass through more slowly, or perhaps not at all. The
movement of a solute through a selectively permeable membrane is called dialysis. The size of the minute pores in
the dialysis tubing determines which substances can pass through the membrane.
A solution of glucose and starch will be placed inside a bag of dialysis tubing. Distilled water will be placed in a
beaker, outside the dialysis bag. After 30 minutes have passed, the solution inside the dialysis tubing and the
solution in the beaker will be tested for glucose and starch. The presence of glucose will be tested with Benedict’s
solution, Testape®, or Clinistix®. The presence of starch will be tested with Lugol’s solution (Iodine Potassium-
Iodide, or IKI)
    Procedure – Done as Demonstration
    1.   Obtain a 30-cm piece of 2.5-cm dialysis tubing that has been soaking in water. Tie off one end of the
         tubing to form a bag. To open the other end of the bag, rub the end between your fingers until the edges
         separate.
    2.   Test the 15% glucose/1% starch solution for the presence of glucose. Record the results.
    3.   Place 15 mL of the 15% glucose/1% starch solution in the bag. Tie off the other end of the bag, leaving
         sufficient space for the expansion of the contents in the bag. Record the color of the solution.
    4.   Fill a 250-mL beaker or cup two-thirds full with distilled water. Add approximately 4 mL of Lugol’s
         solution to the distilled water and record the color of the solution. Test this solution for glucose and
         record the results.                                           Figure 1: Experimental Set-Up Exercise 1
    5.   Immerse the bag in the beaker of solution.
    6.   Allow the setup to stand for approximately 30 minutes
         or until you see a distinct color change in the bag or in
                                                                                                            IKI solution
         the beaker. Record the final color of the solution in the
         bag, and of the solution in the beaker.
    7.   Test the liquid in the beaker and in the bag for the
         presence of glucose. Record the results.                                                         15% glucose
                                                                                                          1% starch solution
Exercise 2: Quantitative Determination of Osmosis
        In this experiment you will use dialysis tubing to investigate the relationship between solute
concentration and the movement of water through a selectively permeable membrane by the process of osmosis.
         When two solutions have the same concentration of solutes, they are said to be isotonicto each other (iso
means same, -ton means condition, -ic means pertaining to). If the two solutions are separated by a selectively
permeable membrane, water will move between the two solutions, but there will be no netchange in the amount
of water in either solution.
        If two solutions differ in the concentration of solutes that each has, the one with more solute is
hypertonic to the one with less solute (hyper- means over, more than). The solution that has less solute is
hypotonic to the one with more solute (hypo- means under or less than). These words can only be used to
compare solutions.
         Now consider two solutions separated by a selectively permeable membrane. The solution that is
hypertonic to the other must have more solute and therefore less water. At standard atmospheric pressure, the
water potential of the hypertonic solution is less than the water potential of the hypotonic solution, so the net
movement of water will be from the hypotonic solution into the hypertonic solution. Label the sketch below
(Figure 2) to indicate which solution is hypertonic, which is hypotonic, and use arrows to show the initial
netmovement of water.
    Procedure
    1.   Obtain six 30 cm strips of presoaked dialysis tubing.
    2.   Tie a knot in one end of each piece of dialysis tubing     Figure 2: Experimental Set-up for Exercise 2
         to form six bags. Pour approximately 10 mL of each
         of the following solutions into separate bags:
              a. Distilled water
              b. 0.2 M sucrose
              c. 0.4 M sucrose
              d. 0.6 M sucrose                                                                          dH2O
              e. 0.8 M sucrose
              f. 1.0 M sucrose
    3.   Remove most of the air from each bag by drawing                                              Sucrose solution
         the dialysis bag between two fingers. Tie off the
         other end of the bag. Leave sufficient space for the
         expansion of the contents in the bag. (The solution
         should fill only about one-third to one-half of the
         piece of tubing.)
    4.   Rinse each bag gently with distilled water to remove any sucrose spilled during filling.
    5.   Carefully blot the outside of each bag and record the initial mass of each bag, expressed in grams.
    6.   Fill six 250 mL beakers or cups two-thirds full with distilled water.
    7.   Immerse each bag in one of the beakers of distilled H20 and label the beaker to indicate the molarity of
         the solution in the dialysis bag. Be sure to completely submerge each bag.
    8.   Let them stand for 30 minutes.
    9.   At the end of 30 minutes remove the bags from the water. Carefully blot and determine the mass of each
         bag.
    10. Record your group's data and share data with the class.
    11. Obtain all data from the other lab groups in your class for statistical analysis.
    12. Graph both your individual data and the class statistics.


                                                                                                                    2
Exercise 3: Quantitative Determination of Water Potential
         In this part of the exercise you will use potato cores placed in different molar concentrations of sucrose in
order to determine the water potential of potato cells. First, however, we will explore what is meant by the term
“water potential.”
        Botanists use the term water potential when predicting the movement of water into or out of plant cells.
Water potential is abbreviated by the Greek letter psi (Ψ) and it has two components: a physical pressure
component (pressure potential Ψp) and the effects of solutes (solute potential Ψs).
                                                             P      S
        Water will always move from an area of higher water potential (higher free energy; more water
molecules) to an area of lower water potential (lower free energy; fewer water molecules). Water potential then,
measures the tendency of water to leave one place in favor of another place. You can picture the water diffusing
“down” a water potential gradient, just as a ball with a high potential energy has the ability to roll down a hill to a
lower potential energy.
          Water is affected by two physical factors. One factor is the addition of solutes which lower the water
potential. The other factor is pressure potential (physical pressure). An increase in pressure raises the water
potential. By convention, the water potential of pure water at atmospheric pressure is defined as being zero (Ψ =
0). For instance, it can be calculated that a 0.1 M solution of sucrose at atmospheric pressure (Ψp= 0) has a water
potential of –2.3 bars due to the solute (Ψ = -2.3).
         Movement of H2O into and out of a cell is influenced by the solute potential (relative concentration of
solute) on either side of the cell membrane. If water moves out of the cell, the cell will shrink. If water moves into
an animal cell, it will swell and may even burst. In plant cells, the presence of a cell wall prevents cells from
bursting as water enters the cells, but pressure eventually builds up inside the cell and affects the net movement
of water. As water pushes against the bag or cell wall. The pressure would cause, for example, the water to rise in
an osmometer tube or increase the pressure on a cell wall. It is important to realize that water potential and
solute concentration are inversely related. The addition of solutes lowers the water potential of the system. In
summary, solute potential is the effect that solutes have on a solution’s overall water potential.
          Movement of H2O into and out of a cell is also influenced by the pressure potential (physical pressure) on
either side of the cell membrane. Water movement is directly proportional to the pressure on a system. For
example, pressing on the plunger of a water-filled syringe causes the water to exit via any opening. In plant cells
this physical pressure can be exerted by the cell pressing against the partially elastic cell wall. Pressure potential is
usually positive in a living cell; in dead xylem elements it is often negative.
          It is important for you to be clear about the numerical relationships between water potential and its
components, pressure potential and solute potential. The water potential value can be positive, zero, or negative.
Remember that water will move across a membrane in the direction of the lower water potential. An increase in
pressure potential results in a more positive value and a decrease in pressure potential (tension or pulling) results
in a more negative value. In contrast to pressure potential, solute potential is always negative; since pure water
has a water potential of zero, any solutes will make the solution have a lower (more negative) water potential.
Generally, an increase in solute potential makes the water potential value more negative and an increase in
pressure potential makes the water potential more positive.
                                                                                           Figure 3:Sample System with Water
          To illustrate the concepts discussed above, we will look at a sample system      Potential Calculations:
using Figure 3. When a solution, such as that inside a potato cell, is separated from
                                                                                                          Ψ = ΨP + Ψs
pure water by a selectively permeable cell membrane, water will move (by osmosis)
from the surrounding water where water potential is higher, into the cell where water                        Beginning of Observation
potential is lower (more negative) due to the solute potential (Ψs). In Figure 3a the                        Pure Water
                                                                                                             0=0+0
potential of pure water (Ψ) is 0 and the solute potential (Ψs) in potato is –3. We will
assume, for purposes of explanation, the solute is not diffusing out of the cell. By the                     Potato Cell
end of the observation, the movement of water into the cell causes the cell to swell and                     -3 = 0 + -3
the cell contents to push against the cell wall to produce an increase in pressure                 a
potential (turgor) (Ψp= 3). Eventually, enough turgor pressure builds up to balance the                      Ending of Observation
negative solute potential of the cell. When the water potential of the cell equals the                       Pure Water
                                                                                                             0=0+0

                                                                                                                        3
                                                                                                                Potato Cell
                                                                                                                0 = 3 + -3
                                                                                                     b
water potential of the pure water outside the cell (Ψ of cell = Ψ of pure water = 0), a dynamic equilibrium is
reached and there will be no net water movement (Figure 3b).


                                                                                                                 4
If you were to add solute to the water outside the potato cells, the water potential of thesolution
surrounding the cells would decrease, It is possible to add just enough solute to thewater so that the water
potential outside the cell is the same as the water potential inside thecell. In this case, there will be no net
movement of water. This does not mean, however, that thesolute concentrations inside and outside the cell are
equal, because water potential inside thecell results from the combination of both pressure potential and solute
potential (Figure 4).
                                  Figure 4: Potato Cell in Water with Additional Solute


                                                                               Water with Solute
                                                                               -12 = 0 + -12


                                                                               Potato Cell
                                                                               -12 = 3 + -15

         If enough solute is added to the water outside the cells, water will leave the cells, movingfrom an area of
higher water potential to an area of lower water potential. The loss of waterfrom the cells will cause the cells to
lose turgor. A continued loss of water will eventually causethe cell membrane to shrink away from the cell wall
(plasmolysis).
    Methods
    1. Pour 100 mL of the appropriate solution into a labeled container.
    2. Using a French fry slicer, cut a potato into rectangular boxes that are approximately 1 cm per side.
    3. Use a knife to cut potato cubes. Do not include any skin on the cubes.
    4. Keep your potato cubes in a covered beaker until a balance is available to use.
    5. Determine the mass of each of the potato cubes and record the mass.
    6. Put the cubes into the prepared containers of sucrose solution.
    7. Cover the beaker with plastic wrap to prevent evaporation.
    8. Let them stand overnight.
    9. Remove the cubes from the beakers, blot them gently on a paper towel, and determine their mass.
   10. Record your group's final mass and share all data with the class.
   11. Obtain all data from the other lab groups in your class for statistical analysis.
   12. Graph both your individual data and the class statistics.

                                    This is your part of your prelab: Procedure
        The class will determine specific procedures for accumulating data. Come to class ideas on what
    concentrations of solution to test, how to distribute the trials among the class as well as prepared to discuss
    the advantages and disadvantages of different options. All lab groups could conduct a replicate for each
    concentration of solution. A different strategy would be to have each lab group responsible for a particular
    concentration and perform several replicates. Either strategy would have important implications on the
    accuracy and precision of the gathered data; both strategies will require safeguards to minimize error.

    Analysis:Calculation of Water Potential from Experimental Data
    1. The water potential of the potato cells will be equal to the water potential of thesolution at equilibrium.
    2. Knowing the solute potential of the solution (Ψs ) and knowing that the pressure potential of the solution
       is zero (Ψp = 0) allows you to calculate the water potential of the solution. The water potential will be
       equal to the solute potential of the solution.
                           Ψ = 0 + Ψs or Ψ = Ψs
    3. The solute potential of a sucrose solution can be calculated using the following formula:
                        Ψs = -iCRT

                                                                                                                       5
where i =   Ionization constant (for sucrose this is 1.0 because sucrose does not ionize in water)
                  C=     Molar concentration (independent variable)
                  R=     Pressure constant (R = 0.0831 liter bars/mole - K)
                  T=     Temperature K (273 + °C of solution)
Exercise 4 Observation of Onion Cell Plasmolysis
Plasmolysis is the shrinking of the cytoplasm of a plant cell in response to diffusion of water outof the
cell and into a hypertonic solution (high solute concentration) surrounding the cell asshown in Figure 5.
During plasmolysis the cellular membrane pulls away from the cell wall. Inthe next lab exercise you will
examine the details of the effects of highly concentrated solutionson diffusion and cellular contents.

               Figure 5: Plant Cells in Varying Environments with Net Movement of Water Shown


    Procedure (we’ll do this as a class)
    1. Prepare a wet mount of a small piece of the epidermis of an onion.
    2. Observe under 100X magnification.
    3. Sketch and describe the appearance of the onion cells.
    4. Add 2 or 3 drops of 15% NaCl to one edge of the cover slip. Draw this salt solution across the
       slide by touching a piece of paper towel to the fluid under the opposite edge of the cover slip.
    5. Sketch and describe the onion cells.
    6. Remove the cover slip and flood the onion epidermis with fresh water.
    7. Observe under 100X.
    8. Sketch and describe the onion cells.


                                       Academic honesty in science labs
Science is, by definition, a collaborative endeavor. Therefore, many of the assignments you hand in will
be the products of working with other students. As with all work, the work you hand in must represent
your own personal comprehension. Simply rewording or paraphrasing another student’s work is the
same as copying verbatim. The Science Department will consider such work to be plagiarized.
It is especially true that lab reports are a collaborative endeavor. Other students are crucial in executing
the procedures of a lab and in collecting the data. As you leave the lab, however, all work beyond this
point, including, but not limited to: creation of graphs, analysis of data, summarizing results, and
answering specific questions is expected to be your own work - completed without help from others.
When it’s required that you seek information from outside sources, you must cite your sources by using
an acceptable “references cited” method. Do not make the mistake of citing only direct quotes. You
must cite references for information obtained from other sources even if you paraphrase or reword the
information.


                                                                                                                  6
Pre-Lab Thinking. Write a short paragraph which summarizes answers to the following four tasks.
    1. State the main goal of the experiment.
    2. Suggest the hypotheses we seek to test in this experiment.
    3. Identify the potential confounding variables in the experiment and outline how you will attempt
        to control these.
    4. Answer the prelab question on page 5.
    5. Describe the data that will be collected in the experiment.

Post-Lab analysis
   1. The data collected during the experiment is to be recorded and tabulated as follows:
       a. Complete tables of both qualitative and quantitative data, including calculations of relevant
           descriptive statistics.
       b. Construct plots of the % change in mass for the dialysis bags and potatoes as a function of
          solution concentration.
       c. Calculate the water potential of potato
       d. Comment on the accuracy and precision of the data collected during the experiment.
   2. Analyze the data set by responding to the following:
      a. State the inferences (conclusions) that most logically follow from the data.
       b. Comment on if these inferences are/are not debatable, given the data gathered in this study
          and the evidence to this point.
       c. Identify if your hypotheses for this experiment were/were not supported by the experiment
          results. Describe your change in reasoning (if any) in relation to the results.


                                                                                                        7

More Related Content

What's hot

Preparing a Standard Solution
Preparing  a Standard SolutionPreparing  a Standard Solution
Preparing a Standard Solutionsweemoi khor
 
Cell Membrane And Cell Transport Notes New
Cell Membrane And Cell Transport Notes NewCell Membrane And Cell Transport Notes New
Cell Membrane And Cell Transport Notes NewFred Phillips
 
Chapter 3 Movement of Substances Lesson 3 - Active transport and the comparis...
Chapter 3 Movement of Substances Lesson 3 - Active transport and the comparis...Chapter 3 Movement of Substances Lesson 3 - Active transport and the comparis...
Chapter 3 Movement of Substances Lesson 3 - Active transport and the comparis...j3di79
 
Bulk Transport.pptx
Bulk Transport.pptxBulk Transport.pptx
Bulk Transport.pptxParagPatgiri
 
Transport of biomolecules across cell membrane
Transport of biomolecules across cell membraneTransport of biomolecules across cell membrane
Transport of biomolecules across cell membraneMohan Raj
 
Lab 3 diffusion and osmosis fall 2014
Lab 3   diffusion and osmosis fall 2014Lab 3   diffusion and osmosis fall 2014
Lab 3 diffusion and osmosis fall 2014Amy Hollingsworth
 
Introduction to bacteria
Introduction to bacteriaIntroduction to bacteria
Introduction to bacteriaAllison Miller
 
Osmosis, diffusion, active transport
Osmosis, diffusion, active transportOsmosis, diffusion, active transport
Osmosis, diffusion, active transportMarthese Azzopardi
 
The Streak plate method,
 The Streak plate method,  The Streak plate method,
The Streak plate method, Dr Qureshi
 
Application of streaking
Application of streakingApplication of streaking
Application of streakingJyotsna Verma
 
Movement in & Out Cell.ppt
Movement in & Out Cell.pptMovement in & Out Cell.ppt
Movement in & Out Cell.pptayusriningsih2
 
Biology Catalase Lab
Biology Catalase LabBiology Catalase Lab
Biology Catalase Labchristok77
 

What's hot (20)

Cell membrane
Cell membraneCell membrane
Cell membrane
 
Preparing a Standard Solution
Preparing  a Standard SolutionPreparing  a Standard Solution
Preparing a Standard Solution
 
Biology Lab Report 2
Biology Lab Report 2Biology Lab Report 2
Biology Lab Report 2
 
Agar slant
Agar slantAgar slant
Agar slant
 
2.2 water
2.2 water 2.2 water
2.2 water
 
Cell fractionation
Cell fractionationCell fractionation
Cell fractionation
 
Cell Membrane And Cell Transport Notes New
Cell Membrane And Cell Transport Notes NewCell Membrane And Cell Transport Notes New
Cell Membrane And Cell Transport Notes New
 
Circulation
CirculationCirculation
Circulation
 
Chapter 3 Movement of Substances Lesson 3 - Active transport and the comparis...
Chapter 3 Movement of Substances Lesson 3 - Active transport and the comparis...Chapter 3 Movement of Substances Lesson 3 - Active transport and the comparis...
Chapter 3 Movement of Substances Lesson 3 - Active transport and the comparis...
 
Bulk Transport.pptx
Bulk Transport.pptxBulk Transport.pptx
Bulk Transport.pptx
 
Transport of biomolecules across cell membrane
Transport of biomolecules across cell membraneTransport of biomolecules across cell membrane
Transport of biomolecules across cell membrane
 
Lab 3 diffusion and osmosis fall 2014
Lab 3   diffusion and osmosis fall 2014Lab 3   diffusion and osmosis fall 2014
Lab 3 diffusion and osmosis fall 2014
 
Introduction to bacteria
Introduction to bacteriaIntroduction to bacteria
Introduction to bacteria
 
Osmosis, diffusion, active transport
Osmosis, diffusion, active transportOsmosis, diffusion, active transport
Osmosis, diffusion, active transport
 
Osmosis
OsmosisOsmosis
Osmosis
 
The Streak plate method,
 The Streak plate method,  The Streak plate method,
The Streak plate method,
 
Application of streaking
Application of streakingApplication of streaking
Application of streaking
 
Movement in & Out Cell.ppt
Movement in & Out Cell.pptMovement in & Out Cell.ppt
Movement in & Out Cell.ppt
 
Biology Catalase Lab
Biology Catalase LabBiology Catalase Lab
Biology Catalase Lab
 
Transport across cell membrane
Transport across cell membraneTransport across cell membrane
Transport across cell membrane
 

Viewers also liked

1 p9 onion cells 291110
1 p9 onion cells 2911101 p9 onion cells 291110
1 p9 onion cells 291110drgav2005
 
Biologi f4 sbp akhir tahun 2008
Biologi f4 sbp akhir tahun 2008Biologi f4 sbp akhir tahun 2008
Biologi f4 sbp akhir tahun 2008Stanley Lee
 
Bio22 Lab - Ex 4 (Cell Transport - Osmosis in Human RBC)
Bio22 Lab - Ex 4 (Cell Transport - Osmosis in Human RBC)Bio22 Lab - Ex 4 (Cell Transport - Osmosis in Human RBC)
Bio22 Lab - Ex 4 (Cell Transport - Osmosis in Human RBC)Josh Protacio
 
Onion and cheek cell lab
Onion and cheek cell labOnion and cheek cell lab
Onion and cheek cell labD Sanders
 
Experiment 2 transport of materials across cell membranes and plant cell wate...
Experiment 2 transport of materials across cell membranes and plant cell wate...Experiment 2 transport of materials across cell membranes and plant cell wate...
Experiment 2 transport of materials across cell membranes and plant cell wate...Nadine Uy
 
Tor the onion router
Tor  the onion routerTor  the onion router
Tor the onion routerAshly Liza
 
Osmosis report powerpoint
Osmosis report powerpointOsmosis report powerpoint
Osmosis report powerpointclairebloom
 
Osmosis project of chemistry
Osmosis project of chemistryOsmosis project of chemistry
Osmosis project of chemistryAyushi Sharma
 
Laporan Praktikum Difusi Osmosis dan Plasmolisis
Laporan Praktikum Difusi Osmosis dan PlasmolisisLaporan Praktikum Difusi Osmosis dan Plasmolisis
Laporan Praktikum Difusi Osmosis dan PlasmolisisNur Meili Zakiyah
 
ReverseOsmosisLabReport
ReverseOsmosisLabReportReverseOsmosisLabReport
ReverseOsmosisLabReportJanet Mok
 
132441402 chapter-3-movement-of-substances-across-the-plasma-membrane
132441402 chapter-3-movement-of-substances-across-the-plasma-membrane132441402 chapter-3-movement-of-substances-across-the-plasma-membrane
132441402 chapter-3-movement-of-substances-across-the-plasma-membraneLim Yee Yern
 
Diffusion lab
Diffusion labDiffusion lab
Diffusion lab14771
 
Osmosis lab report
Osmosis lab reportOsmosis lab report
Osmosis lab reportAbood Omar
 
The effects of hypotonic, hypertonic and isotonic
The effects of hypotonic, hypertonic and isotonicThe effects of hypotonic, hypertonic and isotonic
The effects of hypotonic, hypertonic and isotonicDewi Sivasamy
 
Chapter 3 Movement of Substances Lesson 2 - Effects of isotonic, hypotonic & ...
Chapter 3 Movement of Substances Lesson 2 - Effects of isotonic, hypotonic & ...Chapter 3 Movement of Substances Lesson 2 - Effects of isotonic, hypotonic & ...
Chapter 3 Movement of Substances Lesson 2 - Effects of isotonic, hypotonic & ...j3di79
 

Viewers also liked (20)

Cells Osmosis
Cells OsmosisCells Osmosis
Cells Osmosis
 
1 p9 onion cells 291110
1 p9 onion cells 2911101 p9 onion cells 291110
1 p9 onion cells 291110
 
Biologi f4 sbp akhir tahun 2008
Biologi f4 sbp akhir tahun 2008Biologi f4 sbp akhir tahun 2008
Biologi f4 sbp akhir tahun 2008
 
Bio22 Lab - Ex 4 (Cell Transport - Osmosis in Human RBC)
Bio22 Lab - Ex 4 (Cell Transport - Osmosis in Human RBC)Bio22 Lab - Ex 4 (Cell Transport - Osmosis in Human RBC)
Bio22 Lab - Ex 4 (Cell Transport - Osmosis in Human RBC)
 
Igcse2010 fernando enzymes
Igcse2010 fernando enzymesIgcse2010 fernando enzymes
Igcse2010 fernando enzymes
 
Onion and cheek cell lab
Onion and cheek cell labOnion and cheek cell lab
Onion and cheek cell lab
 
Experiment 2 transport of materials across cell membranes and plant cell wate...
Experiment 2 transport of materials across cell membranes and plant cell wate...Experiment 2 transport of materials across cell membranes and plant cell wate...
Experiment 2 transport of materials across cell membranes and plant cell wate...
 
Plasmolysis
PlasmolysisPlasmolysis
Plasmolysis
 
Igcse2010 -osmosis & diffusion
Igcse2010 -osmosis & diffusionIgcse2010 -osmosis & diffusion
Igcse2010 -osmosis & diffusion
 
Tor the onion router
Tor  the onion routerTor  the onion router
Tor the onion router
 
Osmosis report powerpoint
Osmosis report powerpointOsmosis report powerpoint
Osmosis report powerpoint
 
Classificazione software
Classificazione softwareClassificazione software
Classificazione software
 
Osmosis project of chemistry
Osmosis project of chemistryOsmosis project of chemistry
Osmosis project of chemistry
 
Laporan Praktikum Difusi Osmosis dan Plasmolisis
Laporan Praktikum Difusi Osmosis dan PlasmolisisLaporan Praktikum Difusi Osmosis dan Plasmolisis
Laporan Praktikum Difusi Osmosis dan Plasmolisis
 
ReverseOsmosisLabReport
ReverseOsmosisLabReportReverseOsmosisLabReport
ReverseOsmosisLabReport
 
132441402 chapter-3-movement-of-substances-across-the-plasma-membrane
132441402 chapter-3-movement-of-substances-across-the-plasma-membrane132441402 chapter-3-movement-of-substances-across-the-plasma-membrane
132441402 chapter-3-movement-of-substances-across-the-plasma-membrane
 
Diffusion lab
Diffusion labDiffusion lab
Diffusion lab
 
Osmosis lab report
Osmosis lab reportOsmosis lab report
Osmosis lab report
 
The effects of hypotonic, hypertonic and isotonic
The effects of hypotonic, hypertonic and isotonicThe effects of hypotonic, hypertonic and isotonic
The effects of hypotonic, hypertonic and isotonic
 
Chapter 3 Movement of Substances Lesson 2 - Effects of isotonic, hypotonic & ...
Chapter 3 Movement of Substances Lesson 2 - Effects of isotonic, hypotonic & ...Chapter 3 Movement of Substances Lesson 2 - Effects of isotonic, hypotonic & ...
Chapter 3 Movement of Substances Lesson 2 - Effects of isotonic, hypotonic & ...
 

Similar to Diffusion and osmosis student handout

Similar to Diffusion and osmosis student handout (8)

4 biological membranes
4 biological membranes4 biological membranes
4 biological membranes
 
Movement in and out of a cell
Movement in and out of a cellMovement in and out of a cell
Movement in and out of a cell
 
Essay On Osmosis Lab
Essay On Osmosis LabEssay On Osmosis Lab
Essay On Osmosis Lab
 
CELL DRINKING, CELL EATING.ppt
CELL DRINKING, CELL EATING.pptCELL DRINKING, CELL EATING.ppt
CELL DRINKING, CELL EATING.ppt
 
Movement of substances 2013
Movement of substances 2013Movement of substances 2013
Movement of substances 2013
 
Osmosis In Red Onion Cells
Osmosis In Red Onion CellsOsmosis In Red Onion Cells
Osmosis In Red Onion Cells
 
Diffusion.pptx
Diffusion.pptxDiffusion.pptx
Diffusion.pptx
 
Osmosis n diffusion
Osmosis n diffusionOsmosis n diffusion
Osmosis n diffusion
 

More from ilanasaxe

Stats concept map (1)
Stats concept map (1)Stats concept map (1)
Stats concept map (1)ilanasaxe
 
Central dogma
Central dogmaCentral dogma
Central dogmailanasaxe
 
Central dogma
Central dogmaCentral dogma
Central dogmailanasaxe
 
Genetic Disorders and Variations on Mendel's Principles
Genetic Disorders and Variations on Mendel's Principles Genetic Disorders and Variations on Mendel's Principles
Genetic Disorders and Variations on Mendel's Principles ilanasaxe
 
Blackworm Lab Set Up
Blackworm Lab Set UpBlackworm Lab Set Up
Blackworm Lab Set Upilanasaxe
 
Crayfish lab set up
Crayfish lab set upCrayfish lab set up
Crayfish lab set upilanasaxe
 
Plant pigments and photosynthesis
Plant pigments and photosynthesisPlant pigments and photosynthesis
Plant pigments and photosynthesisilanasaxe
 
Flower fruit seed lab domb reworked 10.12
Flower fruit seed lab domb reworked 10.12Flower fruit seed lab domb reworked 10.12
Flower fruit seed lab domb reworked 10.12ilanasaxe
 
Osmosis and diffusion post lab questions
Osmosis and diffusion post lab questionsOsmosis and diffusion post lab questions
Osmosis and diffusion post lab questionsilanasaxe
 
Cell Function Concept Map
Cell Function Concept MapCell Function Concept Map
Cell Function Concept Mapilanasaxe
 
Beta gal lab writeup
Beta gal lab writeupBeta gal lab writeup
Beta gal lab writeupilanasaxe
 
Enzyme Concept Map
Enzyme Concept MapEnzyme Concept Map
Enzyme Concept Mapilanasaxe
 
Concept map for 2FS
Concept map for 2FSConcept map for 2FS
Concept map for 2FSilanasaxe
 
A critical thinking framework for understanding excellence in biological thin...
A critical thinking framework for understanding excellence in biological thin...A critical thinking framework for understanding excellence in biological thin...
A critical thinking framework for understanding excellence in biological thin...ilanasaxe
 
Honors Biology Pre-Assessment for Modules 1 and 2
Honors Biology Pre-Assessment for Modules 1 and 2Honors Biology Pre-Assessment for Modules 1 and 2
Honors Biology Pre-Assessment for Modules 1 and 2ilanasaxe
 
What lives where and why preassessment
What lives where and why preassessmentWhat lives where and why preassessment
What lives where and why preassessmentilanasaxe
 
Grade profiles
Grade profilesGrade profiles
Grade profilesilanasaxe
 
Intro to cellular respiration
Intro to cellular respirationIntro to cellular respiration
Intro to cellular respirationilanasaxe
 
Potato catalase pictures
Potato catalase picturesPotato catalase pictures
Potato catalase picturesilanasaxe
 
Section 2-4, Enzymes
Section 2-4, EnzymesSection 2-4, Enzymes
Section 2-4, Enzymesilanasaxe
 

More from ilanasaxe (20)

Stats concept map (1)
Stats concept map (1)Stats concept map (1)
Stats concept map (1)
 
Central dogma
Central dogmaCentral dogma
Central dogma
 
Central dogma
Central dogmaCentral dogma
Central dogma
 
Genetic Disorders and Variations on Mendel's Principles
Genetic Disorders and Variations on Mendel's Principles Genetic Disorders and Variations on Mendel's Principles
Genetic Disorders and Variations on Mendel's Principles
 
Blackworm Lab Set Up
Blackworm Lab Set UpBlackworm Lab Set Up
Blackworm Lab Set Up
 
Crayfish lab set up
Crayfish lab set upCrayfish lab set up
Crayfish lab set up
 
Plant pigments and photosynthesis
Plant pigments and photosynthesisPlant pigments and photosynthesis
Plant pigments and photosynthesis
 
Flower fruit seed lab domb reworked 10.12
Flower fruit seed lab domb reworked 10.12Flower fruit seed lab domb reworked 10.12
Flower fruit seed lab domb reworked 10.12
 
Osmosis and diffusion post lab questions
Osmosis and diffusion post lab questionsOsmosis and diffusion post lab questions
Osmosis and diffusion post lab questions
 
Cell Function Concept Map
Cell Function Concept MapCell Function Concept Map
Cell Function Concept Map
 
Beta gal lab writeup
Beta gal lab writeupBeta gal lab writeup
Beta gal lab writeup
 
Enzyme Concept Map
Enzyme Concept MapEnzyme Concept Map
Enzyme Concept Map
 
Concept map for 2FS
Concept map for 2FSConcept map for 2FS
Concept map for 2FS
 
A critical thinking framework for understanding excellence in biological thin...
A critical thinking framework for understanding excellence in biological thin...A critical thinking framework for understanding excellence in biological thin...
A critical thinking framework for understanding excellence in biological thin...
 
Honors Biology Pre-Assessment for Modules 1 and 2
Honors Biology Pre-Assessment for Modules 1 and 2Honors Biology Pre-Assessment for Modules 1 and 2
Honors Biology Pre-Assessment for Modules 1 and 2
 
What lives where and why preassessment
What lives where and why preassessmentWhat lives where and why preassessment
What lives where and why preassessment
 
Grade profiles
Grade profilesGrade profiles
Grade profiles
 
Intro to cellular respiration
Intro to cellular respirationIntro to cellular respiration
Intro to cellular respiration
 
Potato catalase pictures
Potato catalase picturesPotato catalase pictures
Potato catalase pictures
 
Section 2-4, Enzymes
Section 2-4, EnzymesSection 2-4, Enzymes
Section 2-4, Enzymes
 

Diffusion and osmosis student handout

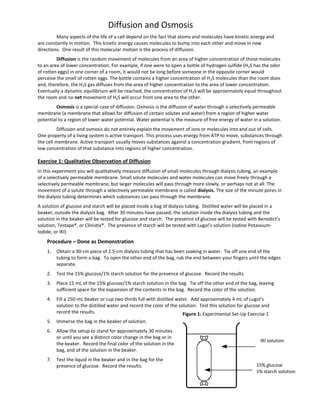
  • 1. Diffusion and Osmosis Many aspects of the life of a cell depend on the fact that atoms and molecules have kinetic energy and are constantly in motion. This kinetic energy causes molecules to bump into each other and move in new directions. One result of this molecular motion is the process of diffusion. Diffusion is the random movement of molecules from an area of higher concentration of those molecules to an area of lower concentration. For example, if one were to open a bottle of hydrogen sulfide (H2S has the odor of rotten eggs) in one corner of a room, it would not be long before someone in the opposite corner would perceive the smell of rotten eggs. The bottle contains a higher concentration of H 2S molecules than the room does and, therefore, the H2S gas diffuses from the area of higher concentration to the area of lower concentration. Eventually a dynamic equilibrium will be reached; the concentration of H 2S will be approximately equal throughout the room and no net movement of H2S will occur from one area to the other. Osmosis is a special case of diffusion. Osmosis is the diffusion of water through a selectively permeable membrane (a membrane that allows for diffusion of certain solutes and water) from a region of higher water potential to a region of lower water potential. Water potential is the measure of free energy of water in a solution. Diffusion and osmosis do not entirely explain the movement of ions or molecules into and out of cells. One property of a living system is active transport. This process uses energy from ATP to move, substances through the cell membrane. Active transport usually moves substances against a concentration gradient, from regions of low concentration of that substance into regions of higher concentration. Exercise 1: Qualitative Observation of Diffusion In this experiment you will qualitatively measure diffusion of small molecules through dialysis tubing, an example of a selectively permeable membrane. Small solute molecules and water molecules can move freely through a selectively permeable membrane, but larger molecules will pass through more slowly, or perhaps not at all. The movement of a solute through a selectively permeable membrane is called dialysis. The size of the minute pores in the dialysis tubing determines which substances can pass through the membrane. A solution of glucose and starch will be placed inside a bag of dialysis tubing. Distilled water will be placed in a beaker, outside the dialysis bag. After 30 minutes have passed, the solution inside the dialysis tubing and the solution in the beaker will be tested for glucose and starch. The presence of glucose will be tested with Benedict’s solution, Testape®, or Clinistix®. The presence of starch will be tested with Lugol’s solution (Iodine Potassium- Iodide, or IKI) Procedure – Done as Demonstration 1. Obtain a 30-cm piece of 2.5-cm dialysis tubing that has been soaking in water. Tie off one end of the tubing to form a bag. To open the other end of the bag, rub the end between your fingers until the edges separate. 2. Test the 15% glucose/1% starch solution for the presence of glucose. Record the results. 3. Place 15 mL of the 15% glucose/1% starch solution in the bag. Tie off the other end of the bag, leaving sufficient space for the expansion of the contents in the bag. Record the color of the solution. 4. Fill a 250-mL beaker or cup two-thirds full with distilled water. Add approximately 4 mL of Lugol’s solution to the distilled water and record the color of the solution. Test this solution for glucose and record the results. Figure 1: Experimental Set-Up Exercise 1 5. Immerse the bag in the beaker of solution. 6. Allow the setup to stand for approximately 30 minutes or until you see a distinct color change in the bag or in IKI solution the beaker. Record the final color of the solution in the bag, and of the solution in the beaker. 7. Test the liquid in the beaker and in the bag for the presence of glucose. Record the results. 15% glucose 1% starch solution
  • 2. Exercise 2: Quantitative Determination of Osmosis In this experiment you will use dialysis tubing to investigate the relationship between solute concentration and the movement of water through a selectively permeable membrane by the process of osmosis. When two solutions have the same concentration of solutes, they are said to be isotonicto each other (iso means same, -ton means condition, -ic means pertaining to). If the two solutions are separated by a selectively permeable membrane, water will move between the two solutions, but there will be no netchange in the amount of water in either solution. If two solutions differ in the concentration of solutes that each has, the one with more solute is hypertonic to the one with less solute (hyper- means over, more than). The solution that has less solute is hypotonic to the one with more solute (hypo- means under or less than). These words can only be used to compare solutions. Now consider two solutions separated by a selectively permeable membrane. The solution that is hypertonic to the other must have more solute and therefore less water. At standard atmospheric pressure, the water potential of the hypertonic solution is less than the water potential of the hypotonic solution, so the net movement of water will be from the hypotonic solution into the hypertonic solution. Label the sketch below (Figure 2) to indicate which solution is hypertonic, which is hypotonic, and use arrows to show the initial netmovement of water. Procedure 1. Obtain six 30 cm strips of presoaked dialysis tubing. 2. Tie a knot in one end of each piece of dialysis tubing Figure 2: Experimental Set-up for Exercise 2 to form six bags. Pour approximately 10 mL of each of the following solutions into separate bags: a. Distilled water b. 0.2 M sucrose c. 0.4 M sucrose d. 0.6 M sucrose dH2O e. 0.8 M sucrose f. 1.0 M sucrose 3. Remove most of the air from each bag by drawing Sucrose solution the dialysis bag between two fingers. Tie off the other end of the bag. Leave sufficient space for the expansion of the contents in the bag. (The solution should fill only about one-third to one-half of the piece of tubing.) 4. Rinse each bag gently with distilled water to remove any sucrose spilled during filling. 5. Carefully blot the outside of each bag and record the initial mass of each bag, expressed in grams. 6. Fill six 250 mL beakers or cups two-thirds full with distilled water. 7. Immerse each bag in one of the beakers of distilled H20 and label the beaker to indicate the molarity of the solution in the dialysis bag. Be sure to completely submerge each bag. 8. Let them stand for 30 minutes. 9. At the end of 30 minutes remove the bags from the water. Carefully blot and determine the mass of each bag. 10. Record your group's data and share data with the class. 11. Obtain all data from the other lab groups in your class for statistical analysis. 12. Graph both your individual data and the class statistics. 2
  • 3. Exercise 3: Quantitative Determination of Water Potential In this part of the exercise you will use potato cores placed in different molar concentrations of sucrose in order to determine the water potential of potato cells. First, however, we will explore what is meant by the term “water potential.” Botanists use the term water potential when predicting the movement of water into or out of plant cells. Water potential is abbreviated by the Greek letter psi (Ψ) and it has two components: a physical pressure component (pressure potential Ψp) and the effects of solutes (solute potential Ψs). P S Water will always move from an area of higher water potential (higher free energy; more water molecules) to an area of lower water potential (lower free energy; fewer water molecules). Water potential then, measures the tendency of water to leave one place in favor of another place. You can picture the water diffusing “down” a water potential gradient, just as a ball with a high potential energy has the ability to roll down a hill to a lower potential energy. Water is affected by two physical factors. One factor is the addition of solutes which lower the water potential. The other factor is pressure potential (physical pressure). An increase in pressure raises the water potential. By convention, the water potential of pure water at atmospheric pressure is defined as being zero (Ψ = 0). For instance, it can be calculated that a 0.1 M solution of sucrose at atmospheric pressure (Ψp= 0) has a water potential of –2.3 bars due to the solute (Ψ = -2.3). Movement of H2O into and out of a cell is influenced by the solute potential (relative concentration of solute) on either side of the cell membrane. If water moves out of the cell, the cell will shrink. If water moves into an animal cell, it will swell and may even burst. In plant cells, the presence of a cell wall prevents cells from bursting as water enters the cells, but pressure eventually builds up inside the cell and affects the net movement of water. As water pushes against the bag or cell wall. The pressure would cause, for example, the water to rise in an osmometer tube or increase the pressure on a cell wall. It is important to realize that water potential and solute concentration are inversely related. The addition of solutes lowers the water potential of the system. In summary, solute potential is the effect that solutes have on a solution’s overall water potential. Movement of H2O into and out of a cell is also influenced by the pressure potential (physical pressure) on either side of the cell membrane. Water movement is directly proportional to the pressure on a system. For example, pressing on the plunger of a water-filled syringe causes the water to exit via any opening. In plant cells this physical pressure can be exerted by the cell pressing against the partially elastic cell wall. Pressure potential is usually positive in a living cell; in dead xylem elements it is often negative. It is important for you to be clear about the numerical relationships between water potential and its components, pressure potential and solute potential. The water potential value can be positive, zero, or negative. Remember that water will move across a membrane in the direction of the lower water potential. An increase in pressure potential results in a more positive value and a decrease in pressure potential (tension or pulling) results in a more negative value. In contrast to pressure potential, solute potential is always negative; since pure water has a water potential of zero, any solutes will make the solution have a lower (more negative) water potential. Generally, an increase in solute potential makes the water potential value more negative and an increase in pressure potential makes the water potential more positive. Figure 3:Sample System with Water To illustrate the concepts discussed above, we will look at a sample system Potential Calculations: using Figure 3. When a solution, such as that inside a potato cell, is separated from Ψ = ΨP + Ψs pure water by a selectively permeable cell membrane, water will move (by osmosis) from the surrounding water where water potential is higher, into the cell where water Beginning of Observation potential is lower (more negative) due to the solute potential (Ψs). In Figure 3a the Pure Water 0=0+0 potential of pure water (Ψ) is 0 and the solute potential (Ψs) in potato is –3. We will assume, for purposes of explanation, the solute is not diffusing out of the cell. By the Potato Cell end of the observation, the movement of water into the cell causes the cell to swell and -3 = 0 + -3 the cell contents to push against the cell wall to produce an increase in pressure a potential (turgor) (Ψp= 3). Eventually, enough turgor pressure builds up to balance the Ending of Observation negative solute potential of the cell. When the water potential of the cell equals the Pure Water 0=0+0 3 Potato Cell 0 = 3 + -3 b
  • 4. water potential of the pure water outside the cell (Ψ of cell = Ψ of pure water = 0), a dynamic equilibrium is reached and there will be no net water movement (Figure 3b). 4
  • 5. If you were to add solute to the water outside the potato cells, the water potential of thesolution surrounding the cells would decrease, It is possible to add just enough solute to thewater so that the water potential outside the cell is the same as the water potential inside thecell. In this case, there will be no net movement of water. This does not mean, however, that thesolute concentrations inside and outside the cell are equal, because water potential inside thecell results from the combination of both pressure potential and solute potential (Figure 4). Figure 4: Potato Cell in Water with Additional Solute Water with Solute -12 = 0 + -12 Potato Cell -12 = 3 + -15 If enough solute is added to the water outside the cells, water will leave the cells, movingfrom an area of higher water potential to an area of lower water potential. The loss of waterfrom the cells will cause the cells to lose turgor. A continued loss of water will eventually causethe cell membrane to shrink away from the cell wall (plasmolysis). Methods 1. Pour 100 mL of the appropriate solution into a labeled container. 2. Using a French fry slicer, cut a potato into rectangular boxes that are approximately 1 cm per side. 3. Use a knife to cut potato cubes. Do not include any skin on the cubes. 4. Keep your potato cubes in a covered beaker until a balance is available to use. 5. Determine the mass of each of the potato cubes and record the mass. 6. Put the cubes into the prepared containers of sucrose solution. 7. Cover the beaker with plastic wrap to prevent evaporation. 8. Let them stand overnight. 9. Remove the cubes from the beakers, blot them gently on a paper towel, and determine their mass. 10. Record your group's final mass and share all data with the class. 11. Obtain all data from the other lab groups in your class for statistical analysis. 12. Graph both your individual data and the class statistics. This is your part of your prelab: Procedure The class will determine specific procedures for accumulating data. Come to class ideas on what concentrations of solution to test, how to distribute the trials among the class as well as prepared to discuss the advantages and disadvantages of different options. All lab groups could conduct a replicate for each concentration of solution. A different strategy would be to have each lab group responsible for a particular concentration and perform several replicates. Either strategy would have important implications on the accuracy and precision of the gathered data; both strategies will require safeguards to minimize error. Analysis:Calculation of Water Potential from Experimental Data 1. The water potential of the potato cells will be equal to the water potential of thesolution at equilibrium. 2. Knowing the solute potential of the solution (Ψs ) and knowing that the pressure potential of the solution is zero (Ψp = 0) allows you to calculate the water potential of the solution. The water potential will be equal to the solute potential of the solution. Ψ = 0 + Ψs or Ψ = Ψs 3. The solute potential of a sucrose solution can be calculated using the following formula: Ψs = -iCRT 5
  • 6. where i = Ionization constant (for sucrose this is 1.0 because sucrose does not ionize in water) C= Molar concentration (independent variable) R= Pressure constant (R = 0.0831 liter bars/mole - K) T= Temperature K (273 + °C of solution) Exercise 4 Observation of Onion Cell Plasmolysis Plasmolysis is the shrinking of the cytoplasm of a plant cell in response to diffusion of water outof the cell and into a hypertonic solution (high solute concentration) surrounding the cell asshown in Figure 5. During plasmolysis the cellular membrane pulls away from the cell wall. Inthe next lab exercise you will examine the details of the effects of highly concentrated solutionson diffusion and cellular contents. Figure 5: Plant Cells in Varying Environments with Net Movement of Water Shown Procedure (we’ll do this as a class) 1. Prepare a wet mount of a small piece of the epidermis of an onion. 2. Observe under 100X magnification. 3. Sketch and describe the appearance of the onion cells. 4. Add 2 or 3 drops of 15% NaCl to one edge of the cover slip. Draw this salt solution across the slide by touching a piece of paper towel to the fluid under the opposite edge of the cover slip. 5. Sketch and describe the onion cells. 6. Remove the cover slip and flood the onion epidermis with fresh water. 7. Observe under 100X. 8. Sketch and describe the onion cells. Academic honesty in science labs Science is, by definition, a collaborative endeavor. Therefore, many of the assignments you hand in will be the products of working with other students. As with all work, the work you hand in must represent your own personal comprehension. Simply rewording or paraphrasing another student’s work is the same as copying verbatim. The Science Department will consider such work to be plagiarized. It is especially true that lab reports are a collaborative endeavor. Other students are crucial in executing the procedures of a lab and in collecting the data. As you leave the lab, however, all work beyond this point, including, but not limited to: creation of graphs, analysis of data, summarizing results, and answering specific questions is expected to be your own work - completed without help from others. When it’s required that you seek information from outside sources, you must cite your sources by using an acceptable “references cited” method. Do not make the mistake of citing only direct quotes. You must cite references for information obtained from other sources even if you paraphrase or reword the information. 6
  • 7. Pre-Lab Thinking. Write a short paragraph which summarizes answers to the following four tasks. 1. State the main goal of the experiment. 2. Suggest the hypotheses we seek to test in this experiment. 3. Identify the potential confounding variables in the experiment and outline how you will attempt to control these. 4. Answer the prelab question on page 5. 5. Describe the data that will be collected in the experiment. Post-Lab analysis 1. The data collected during the experiment is to be recorded and tabulated as follows: a. Complete tables of both qualitative and quantitative data, including calculations of relevant descriptive statistics. b. Construct plots of the % change in mass for the dialysis bags and potatoes as a function of solution concentration. c. Calculate the water potential of potato d. Comment on the accuracy and precision of the data collected during the experiment. 2. Analyze the data set by responding to the following: a. State the inferences (conclusions) that most logically follow from the data. b. Comment on if these inferences are/are not debatable, given the data gathered in this study and the evidence to this point. c. Identify if your hypotheses for this experiment were/were not supported by the experiment results. Describe your change in reasoning (if any) in relation to the results. 7