Factors to Consider When Choosing Accounts Payable Services Providers.pptx
A1030109
1. International Journal of Engineering Research and Development
e-ISSN: 2278-067X, p-ISSN: 2278-800X, www.ijerd.com
Volume 10, Issue 3 (March 2014), PP.01-09
1
Hydrochemical Facies Classification and Groundwater Quality
Studies in Eastern Niger Delta, Nigeria
1
Amadi, A. N., 1
Olasehinde, P. I., 2
Dan-Hassan, M. A,
1
Okoye, N. O. and 3
Ezeagu, G. G.
1
Department of Geology, Federal University of Technology, Minna, Nigeria
2
Rural Water Supply and Sanitation Department, FCT Water Board, Garki, Abuja, Nigeria
3
University Health Services, Federal University of Technology, Minna, Nigeria
Abstract:- Soil and water pollution are major environmental problem facing many coastal regions of the world
due to high population, urbanization and industrialization. The hydrofacies and water quality of the coastal
plain-sand of part of Eastern Niger-Delta, Nigeria was investigated in this study. Hydrogeological investigations
show that the aquifers in the area are largely unconfined sands with intercalations of gravels, clay and shale
which are discontinuous and however form semi-confined aquifers in some locations. The observed wide ranges
and high standard deviations and mean in the geochemical data are evidence that there are substantial
differences in the quality/composition of the groundwater within the study area. The plot of the major cations
and anions on Piper, Durov, and Scholler diagrams indicated six hydrochemical facies in the area: Na-Cl, Ca-
Mg-HCO3, Na-Ca-SO4, Ca-Mg-Cl, Na-Fe-Cl and Na-Fe-Cl-NO3. The groundwater quality of the area was
evaluated using water quality index. The study identified salt intrusion and high iron content and poor sanitation
as contributors to the soil and water deterioration in the area. Saltwater/freshwater interface occurs between 5 m
to 185 m while iron-rich water is found between 20 m to 175 m. The first two factors are natural phenomenon
due to the proximity of the aquifer to the ocean and probably downward leaching of marcasite contained in the
overlying lithology into the shallow water table while the last factors is the results of various anthropogenic
activities domiciled in the area. The peoples in the region are advised to imbibed good hygiene and sanitary
habit.
I. INTRODUCTION
Eastern Niger Delta is the operational base of major oil producing and servicing companies in Nigeria.
Petroleum exploration and exploitation have triggered adverse environmental impacts in the Delta area of
Nigeria through incessant environmental, socio-economic and physical disasters that have accumulated over the
years due to limited scrutiny and lack of assessment (Achi, 2003; Amadi et al., 2012a). In Nigeria, immense
tracts of mangrove forests have been destroyed as a result of petroleum exploitation in the mangroves and these
have not only caused degradation to the environment and destroyed the traditional livelihood of the region but
have caused environmental pollution that has affected weather conditions, soil fertility, groundwater, surface
water, aquatic and wildlife. If this trend is allowed to continue unabated, it is most likely that the food web
complexes in this wetland might be at a higher risk of induced heavy metal contamination (Amadi, et al., 2010).
This unhealthy situation continues to attract the interest of environmental observers and calls for evaluation of
the impact of exploration and exploitation activities in the coastal areas of Nigeria and this is part of what this
paper intends to address.
To meet the ever-increasing water demand in the region, groundwater is being extensively used to
supplement the surface water thereby subjecting it to over-exploitation for domestic, agricultural, urban and
industrial uses which results in the deterioration of groundwater in coastal areas (Macklin, et al., 2003).
Increasing urbanization is taking place along the coastlines of the Niger Delta and causing increased use of
groundwater and it has a large impact on the quality and quantity of groundwater system in the area. In many
countries around the world, including Nigeria, groundwater supplies may have become contaminated through
various human activities, which have impact on the health and economic status of the people. The discharge of
untreated waste water, soakaway, pit-latrine as well as agricultural water runoff from farms can all lead to the
deterioration and contamination of groundwater in coastal aquifers via infiltration through the overlying
formation (Abdel-Satar, 2001; Adams et al., 2008).
Land and water are precious natural resources on which rely the sustainability of agriculture,
industrialization and the civilization of mankind. Unfortunately, they have been subjected to severe exploitation
and contamination due to anthropogenic activities such as industrial effluent, solid waste landfills, gas flaring,
oil spillage and petroleum refining leading to the release of heavy metals into the environment (Bellos and
Swaidis, 2005; Ahmad et al., 2010). Each source of contaminant has its own damaging effects to plants, animals
and ultimately to human health, but those that add heavy metals to soils and waters are of serious concern due to
2. Hydro chemical Facies Identification and Groundwater Quality Studies in Eastern Niger Delta, Nigeria
2
their persistence in the environment and carcinogenicity to human beings. Unlike the organic pollutants which
are biodegradable (Ammann et al., 2002; Adams, et al., 2008) heavy metal ions are not biodegradable (Bird et
al., 2003; Lee et al., 2007), thus making them a source of great concern. Through food chain, the heavy metals
bioaccumulate in living organism and reach level that cause toxicological effects (Kraft et al., 2006; Aktar, et
al., 2010). Human health, agricultural development and the ecosystem are all at risk unless soil and water
systems are effectively managed (Akoto, et al., 2008). Close relationship exist between groundwater quality and
land use as various land use activities can result in groundwater contamination.
Statement of the Problems
The impact of hydrocarbon pollution in terms of gas flaring and oil spillage on the environment and
health of host communities in Niger Delta, Nigeria is of great concern. The upsurge in human activities due to
the presence of oil companies in the area and the propensity of contaminant infiltrating through the porous and
permeable formation into the shallow groundwater table has necessitated the study, which intended to provide
useful information on the degree of aquifer contamination resulting from anthropogenic activities in the area.
This is important because the physical, chemical and bacteriological characteristics of groundwater determine its
application, management and remediation processes. In view of the economic activities domiciled in the region,
it becomes imperative to undertake a comprehensive study of the effects of human activities on the
aquifer/groundwater quality in the area.
Aims of the Research
The study seeks to provide baseline information on the quality as the suitability of the groundwater in
the area for domestic purposes.
Justification of the Research
The need to identify, evaluate and categorize the hydrochemical facies in Eastern Niger Delta is long
overdue. For more than 50 years now, petroleum prospection, exploration, exploitation and refining as well as
other industrial and agricultural activities have been going on in the area and the impact of these human
activities on the environment in general and groundwater in particular has not been determined and this is what
this study intended to achieve. No study has provided a platform to evaluate the impact, the various human
activities might have on the groundwater system as well as design a pollution control and protection measures
that will prevent pollutant coming in contact with groundwater system. The present study is targeted at
addressing these deficiencies.
II. MATERIALS AND METHODS
Study Area Description
The study area lies within the eastern Niger Delta region of Nigeria between latitude 440I
N to 5º40I
N
and longitude 6º50I
E to 7º50I
E (Figure 1). It covers parts of Port-Harcourt, Aba and Owerri and a total area of
approximately 12,056 km2
. The area is low lying with a good road network system. The topography is under the
influence of tides which results in flooding especially during the rainy season (Nwankwoala and Mmom, 2007).
The prevalent climatic condition in the area comprises of the rainy (March to October) and dry (November to
February) seasons characterized by high temperatures, low pressure and high relative humidity throughout the
year. A short spell of dry season referred to as the ‘August break’ is often felt in August and is caused by the
deflection of the moisture-laden current. Due to vagaries of weather, the August break sometimes occurs in July
or September.
Figure 1: Map of Niger Delta showing the study area
3. Hydro chemical Facies Identification and Groundwater Quality Studies in Eastern Niger Delta, Nigeria
3
Geology and Hydrogeology of the Area
The study area (Port-Harcourt, Aba, Owerri and environs) is underlain by Pliocene-Pleistocene Benin
Formation (Figure 2) belonging to the Benin Formation. The type locality of the formation is in Port-Harcourt,
Aba and Owerri where the formation overlies the older Ogwashi-Asaba Formation (Ezeigbo and Aneke, 1993).
The formation outcrops sometimes in both surface (outcrop) and subsurface in mode of occurrence. Reyment
(1965) described the formation as extensive reddish earth made up of loose, poorly sorted sands underlying
recent Quaternary sedimentary deposits of southern Nigeria. It consists mainly of sands, sandstone and gravel
with clays occurring in lenses (Onyeagocha, 1980). The sands and sandstones are fine to coarse grained, partly
unconsolidated with varying thickness (Avbovbo, 1978). The formation has a thick sequence of sediments about
2100 m thick deposited in the continental phase of the Niger Delta (Weber and Daukoru, 1976). Within the
study area the thickness of the formation is probably 900m and its maximum thickness near the sea is about
1,820 m. The Benin Formation is composed mostly of high resistant fresh water bearing continental sand and
gravel with clay and shale intercalations (Ofoegbu, 1998). The sediments represent upper deltaic plain deposits
(Peters, 1991). The formation comes in contact with the Ogwahi–Asaba Formation in the northern part and with
Alluvium in the southern part and thickens southwards into the Atlantic Ocean (Figure 2). The sandy unit which
constitutes about 95% of the rock in the area is composed of over 96% guartz (Onyeagocha, 1980).
3 0 3 6 Kilometers
Figure 2: Geological Map of the Eastern Niger Delta showing the study area
(Modified from Weber and Daukoru, 1976)
Sampling
A total of 140 groundwater samples were collected between January, 2009 and November, 2011 using
two sets of polyethylene bottles of one liter capacity, for cation and anion analysis and labeled accordingly. The
boreholes were allowed to flow for about 2 minutes before the water is collected, and containers were
thoroughly washed and rinsed with the water to be collected into them. Samples for the determination of cations
were stabilized with a drop of dilute hydrochloric acid on collection. All the samples were preserved by
refrigeration and analyzed within 24 hours of collection. The analyses were carried out in accordance with
APHA standard. Spectrophotometric method was used to analyze for cations and anions. The physical
parameters pH and conductivity were determined on the field using a calibrated pH meter and conductivity
meter respectively. The microbial analysis was done using carried out using the filter membrane method and
presumptive count and each sample was incubated for at least 24 hours
III. RESULTS AND DISCUSSIONS
The statistical summary of the groundwater data is shown in Table 1. A cursory examination of Table 1
reveals that majority of the groundwater samples in the area are characterized by low pH (3.84 – 7.74), due to
the problem of acid-rain in the area, and high concentration of: silica (0.22 – 101.89), temperature (26.50 –
31.60), electrical conductivity (28.00 – 752.00), total dissolved solids (12.00 – 605.00), chloride (12.00 –
721.00) and sulphate (0.10 – 250.40). Table 1 also shows wide range with corresponding high mean and
standard deviation values for chloride, EC, salinity, silica, sulphate and TDS. This is an indication that there are
substantial differences in the quality/composition of the groundwater system in the aquifer within the study area.
The arithmetic means were determined in order to know what the central tendency for each physical, chemical
and bacteriological properties concentration could be. The deviations in the aiming grade from a typical normal
4. Hydro chemical Facies Identification and Groundwater Quality Studies in Eastern Niger Delta, Nigeria
4
concentration were analyzed using kurtosis test. An evaluation of the symmetry in the value distribution
applying the skewness test was carried out and majority of the hydrologic date are non-normal or positive
skewed.
The pH ranged between 3.84 and 7.74 with a mean value of 5.46 (Table 1). The pH is an important
indicator of water quality and the extent of pollution (Amadi et al., 2010; Amadi et al., 2012). The mean pH of
the groundwater falls below the acceptable range of 6.50-8.50 postulated by Nigerian Standard for Drinking
Water Quality (NSDWQ, 2007).
Table 1: Statistical Summary of the Groundwater data from the Study Area
Parameters Min. Max. Mean St. Dev. Skewness Kurtosis
Arsenic
Bicarbonate
CO3
-
0.001
3.03
0.00
0.016
58.04
0.00
0.007
16.31
0.00
0.009
12.89
0.00
0.001
2.15
0.00
0.003
4.48
0.00
BOD 3.20 8.23 5.60 6.85 1.23 2.10
Cadmium
Calcium
0.07
2.00
0.19
118.30
0.14
46.53
0.09
3.50
0.03
1.56
0.06
3.22
Cobalt 0.00 0.08 0.03 0.19 0.05 0.02
Chloride 12.00 721.00 275.20 171.25 1.32 1.66
Chromium
Copper
0.02
0.03
0.11
1.15
0.07
0.08
0.05
0.17
0.06
3.35
0.10
10.83
COD 7.80 12.98 10.60 9.68 3.45 3.98
E.Cond(µs/cm) 28.00 752.00 254.00 231.50 0.76 -0.78
EC(cfu/100ml) 0.00 18.00 6.00 0.42 0.36 0.74
Fluoride 0.01 2.33 0.85 0.74 0.94 -0.55
T. Hardness 2.50 142.00 54.31 41.49 1.80 1.95
Iron 0.05 6.87 0.62 1.41 3.76 14.46
Lead 0.02 1.09 0.08 0.19 5.13 27.52
Mercury
Magnesium
0.002
0.23
0.004
88.90
0.003
33.16
0.001
2.35
0.001
0.87
0.002
0.36
Manganese 0.01 0.78 0.19 0.24 1.41 0.88
Nickel
Nitrate
0.01
0.03
0.40
64.00
0.28
17.82
0.21
6.68
0.15
3.35
0.13
13.53
pH 3.84 7.74 5.46 1.02 -0.51 -0.38
Phosphate 0.04 30.79 10.29 0.26 1.02 0.12
Potassium 0.04 60.89 20.47 0.22 0.04 -0.79
Salinity 10.00 820.00 265.47 193.98 2.07 4.23
Silica 0.38 101.89 8.38 19.92 4.13 17.46
Sodium 0.22 153.45 61.59 0.94 0.18 -0.81
Strontium 0.91 4.50 3.02 1.14 -0.51 -1.01
Sulphate 0.10 250.40 98.62 52.53 0.98 1.99
TDS 12.00 605.00 255.00 119.65 0.64 -0.75
Temp.(o
C) 26.50 31.60 28.70 0.89 0.45 -0.41
TSS 0.11 55.00 14.60 6.59 3.48 14.70
TC (cfu/ml) 0.00 48.00 15.00 11.80 2.82 5.62
Zinc 0.03 10.09 0.70 1.73 5.45 30.38
BOD-biochemical oxygen demand; COD-chemical oxygen demand; TC-total coliform;
E.Cond-Electrical Conductivity EC-Escherichia coli; TSS-total suspended solid
It could be attributed to the impact of acid rain witnessed in the area, which might have resulted from
the accumulation effect of gas flaring in the area. The temperature of the groundwater ranged from 26.50o
C to
31.60o
C with an average value of 28.70o
C. These values were found to be within the maximum permissible limit
(NSDWQ, 2007). The wide range in temperature values may be attributed to the heating effect of gas flaring on
the region and subsequent acid rain formation which infiltrates into the shallow static water table. The low pH as
shown in the pH distribution map of the area, is an indication of acidity in the groundwater from the area and
may be linked to acid-rain formation probably caused by non-stop gas flaring-where the gas associated with oil
extraction is burnt off into the atmosphere, a method adopted by oil companies operating in the area, as means
of getting rid of associated gas in the course of oil exploitation.
5. Hydro chemical Facies Identification and Groundwater Quality Studies in Eastern Niger Delta, Nigeria
5
Temperature is a measure of the degree of hotness or coldness of a substance. It is an important water
quality parameter which plays a major role in the distribution and abundance of organisms. Aquatic organism
like other organisms is tolerant of certain ranges of temperature outside which they cannot function. Many
biological processes in water are known to be influenced by changes in environmental temperature and chemical
substances dissolve more readily as temperature increases, unlike most gases which become less soluble as
temperature rises.
The concentration of Escherichia coli (E.coli) ranged between 0.00-18.00 cfu/100ml with an average
value of 6.00 cfu/100ml while total coliform (TC) varied from 0.00-48.00 cfu/ml and a mean value of 15.00
cfu/ml (Table 1). Their presence in groundwater is an indication of faecal contamination. The practice of
unlined pit-latrine and soakaway in shallow aquifer region like the eastern Niger Delta exposes the groundwater
to faecal contamination and good sanitary system is advocated for the area due to the vulnerability of its aquifer
system. Faecal contamination causes water-borne diseases such as cholera, typhoid, meningitis and diarrhea as
well as morbidity and mortality among children. It also causes acute renal failure and hemolytic anemia in
adults (Khadse et al., 2008; Juang et al., 2009).
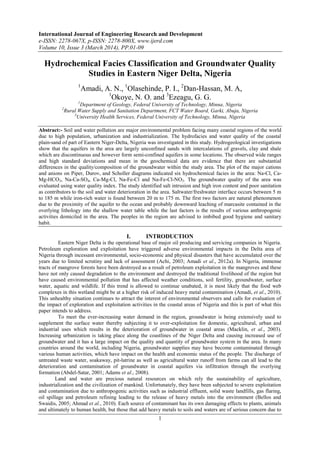
The major cations and anions were interpreted using Piper, Durov and Schoeller diagrams. Water Quality
Index and Metal Pollution Index were applied in the groundwater data and the results revealed the groundwater
in the area has deteriorated due to huge human activities and poor sanitation.
Piper Diagram
Piper diagram outline certain fundamental principles in a graphic procedure which appears to be an
effective tool in separating analytical data for critical study with respect to sources of the dissolved constituents
in water. Piper diagram consists of three parts: two trilinear diagrams along the bottom and one diamond-shaped
diagram in the middle. The trilinear diagram illustrates the relative concentration of cations (left diagram) and
anions (right diagram) in each sample. The concentration of 8 major ions (Na+
, K+
, Mg2+
, Ca2+
, Clˉ, CO3
2-
,
HCOˉ3 and SO4
2-
) are represented on a trilinear diagram by grouping the K+
with Na+
and the CO3
2-
with HCOˉ
3,
thus reducing the number of parameters for plotting to 6. On the Piper diagram, the relative concentration of the
cations and anions are plotted in the lower triangles, and the resulting two points are extended into the central
field to represent the total ion concentrations. The degree of mixing between freshwater and saltwater can also
be shown on the Piper diagram. The Piper diagram (Figure 3) can also be used to classify the hydrochemical
facies of the groundwater samples according to their dominant ions. The water in the area is majorly Na-Cl-
facies, followed by Ca-Mg-HCO3-facies, Na-Ca-SO4-facies, Ca-Mg-Cl-facies, Na-Fe-Cl-facies and Na-Fe-Cl-
NO3-facies in their order of dominance respectively. This implies that the water in the area has some marine
interference and the aquifer stained with iron from marcasite.
Figure 3: A Representative Piper Diagram for the Study Area
6. Hydro chemical Facies Identification and Groundwater Quality Studies in Eastern Niger Delta, Nigeria
6
Durov-Diagrams
Durov diagram is another mean of categorizing the hydrochemical facies of both surface and
groundwater. The Durov diagram plots the major ions as percentages of milli-equivalents in two base triangles.
The total cations and the total anions are set equal to 100% and the data points in the two triangles are projected
onto a square grid which lies perpendicular to the third axis in each triangle. This plot reveals useful properties
and relationships for large sample groups. The Durov diagram (Figure 4) shows clustering of data points and
this indicate samples that have similar compositions. The clustering of the data points concentrated around the
Na+K/Cl region indicating possible marine origin. The hydrochemical facies identified are: Na-Cl-facies, Ca-
Mg- HCO3-facies, Na-Ca- SO4-facies, Ca-Mg-Cl-facies, Na-Fe-Cl-facies and Na-Fe-Cl-NO3-facies.
Figure 4: A Representative Durov diagram for the Area
4.7.5 Schoeller-Plots
These semi-logarithmic diagrams were developed to represent major ion analyses in meq/l and to
demonstrate different hydrochemical water types on the same diagram (Figure 5). This type of graphical
representation has the advantage that, unlike the trilinear diagrams, actual sample concentrations are displayed
and compared.
7. Hydro chemical Facies Identification and Groundwater Quality Studies in Eastern Niger Delta, Nigeria
7
Mg Ca Na+K Cl SO4 HCO3
0.001
0.01
0.1
1.
10.
Concentration (meq/l)
Legend:
Well-water samples
Figure 5: A typical Schoeller-Diagram for the area
Water Quality Index
Water quality index (WQI) of the studied groundwater samples was performed in order to get an
overall impression about the samples in a multidimensional space defined by the analyzed parameters. The
water quality index (WQI) was calculated from the point view of suitability of the water for human consumption
by using the weighted arithmetic index method. The quality rating scale for each parameter qi was calculated by
using this expression:
qi = (Ci / Si ) x 100
A quality rating scale (qi) for each parameter is assigned by dividing its concentration (Ci) in each
water sample by its respective Nigerian Standard for Drinking Water Quality (Si) and the result multiplied by
100. The Relative weight (wi) was obtained by a value inversely proportional to the recommended standard (Si)
of the corresponding parameter (Amadi et al., 2012):
wi = 1/Si
The overall Water Quality Index (WQI) was calculated by aggregating the quality rating (qi) with unit weight
(wi) linearly.
i = n
WQI = (Σqiwi)
n =1
Where:
qi: the quality of the ith parameter,
wi: the unit weight of the ith parameter and
n: the number of the parameter considered.
The overall water quality of an area is therefore obtained using the formular:
Overall
wi
wiqiWQI
The physico-chemical and bacteriological parameters analyzed were used to calculate the WQI in
accordance with the procedures as outlined. The computed overall WQI value was 285.20 and this means that
the groundwater in the area falls within the ‘very poor quality’ as illustrated in Table 2.
8. Hydro chemical Facies Identification and Groundwater Quality Studies in Eastern Niger Delta, Nigeria
8
Overall
wi
wiqiWQI = 460442.528 = 285.20
The high value of WQI obtained may be as a result of the high concentration of salinity, TDS, TH, EC,
COD, nitrate, copper, iron, nickel, zinc, lead, chromium and coliform bacteria in the groundwater which can be
attributed to natural sources through saltwater intrusion and chemical weathering processes as well as
anthropogenic sources through the various human activities such as oil spill, gas flaring and indiscriminate
dumping of waste in the area.
Table 2: Water Quality Classification Based on WQI Value
WQI value Water quality Water samples (%)
<50 Excellent 16
50-100 Good water 24
100-200 Poor water 28
200-300 Very poor water 20
>300 Unsuitable for drinking 12
IV. CONCLUSION AND RECOMMENDATIONS
The hydrochemical facies analysis was executed with the use of Piper Diagram, Durov Diagram and
Schoeller-Diagram while the quality status of the groundwater was assessed using water quality index
technique. The study has clearly established that salt intrusion, high iron content, hydrocarbon pollution and
poor sanitation constitute a major source of soil and water pollution in the oil producing region of Eastern Niger
Delta, Nigeria. The soil pH is generally low, signifying acidic soil. The study revealed that poor groundwater
quality in the area is as a result of both natural and anthropogenic factor activities domiciled in the area. It has
resulted to classic environmental and health challenges in their host communities. Groundwater abstraction in
the area should be reduced and hygiene and good sanitary habit should be inculcated by the people in the area.
REFERENCE
[1]. Abdel-Satar, A. M., (2001). Environmental studies on the impact of the drains effluent upon the
southern sector of Lake Manzalah. Egyptian Journal of Aquatic Biology, 5, 17-30.
[2]. Achi, C., (2003). Hydrocarbon Exploitation, Environmental degradation and Poverty: The Niger Delta
experience. In proceedings of the Environmental Pollution Conference, Dublin, 78-94.
[3]. Adams, R. H., Guzmán-Osorio, F. J., & Zavala, C. J. (2008). Water repellency in oil contaminated
sandy and clayey soils. International Journal of Environmental Science and Technology, 5(4), 445-
454.
[4]. Ahmad, M. K., Islam, S., Rahman, S., Haque, M. R. & Islam, M. M., (2010). Heavy metals in water,
sediment and some fishes of Buriganga River, Bangladesh. International Journal of Environmental
Resources, 4(2), 321-332.
[5]. Akoto, O., Bruce, T. N., & Darko, G., (2008). Heavy metals pollution profiles in streams serving the
Owabi reservoir. African Journal of Environmental Science and Technology, 2(11), 354-359.
[6]. Aktar, M. W., Paramasivam. M., Ganguly, M., Purkait, S., & Sengupta, D., (2010). Assessment and
occurrence of various heavy metals in surface water of Ganga river around Kolkata: a study for toxicity
and ecological impact. Environmental Monitoring and Assessment,160(2), 207-213.
doi.10.1007/s10661-008-0688-5.
[7]. Amadi, A. N., Olasehinde, P. I., Yisa, J., Okosun, E. A., Nwankwoala, H. O. and Alkali, Y. B., (2012).
Geostatistical assessment of groundwater quality from coastal aquifers of EasternNiger Delta, Nigeria.
Geosciences, 2(3), 51–59, doi: 10.5923/j.geo.20120203.03
[8]. Amadi, A. N., Yisa, J., Okoye, N. O. & Okunlola, I. A., (2010). Multivariate statistical evaluation of
the hydrochemical facies in Aba, Southeastern Nigeria. International Journal of Biology and Physical
Sciences, 15(3), 326-337.
[9]. Ammann, A. A., Michalke, B. & Schramel, P., (2002). Speciation of heavy metals in environmental
water by ion chromatography coupled to ICP-MS. Analatia Bioanal Chemistry, 372(3), 448-452.
[10]. APHA, (1995). Standards methods for the examination of water and wastewater. 19th
Edition
[11]. American Water Works Association, Washington DC.
[12]. Avbovbo, A. A., (1978). Tertiary lithostratigraphy of Niger Delta: Bulletin of American Association of
Petroleum Geology, 62, 297– 306.
1614.45
9. Hydro chemical Facies Identification and Groundwater Quality Studies in Eastern Niger Delta, Nigeria
9
[13]. Bellos, D. & Sawidis, T., (2005). Chemical pollution monitoring of the River Pinios Thessalia Greece.
Journal of Environmental Management, 76, 282-292.
[14]. Bird, G., Brewer, P., Macklin, M., Balteanu, D., Driga, B., Serban, M. & Zaharia, S., (2003). The solid
state partitioning of contaminant metals and as in river channel sediments of the mining affected Tisa
drainage basin, northwestern Romania and eastern Hungary. Applied Geochemistry, 18(10), 1583-
1595.
[15]. Ezeigbo, H. I. and Aneke, B. C., (1993). Water Resources Development plan for Benin City and
environs. Journal Mining Geology, 29(2), 147–159.
[16]. Filatov, N., Pozdnyakov, D., Johannessen, O., Pettersson, L. & Bobylev, L., (2005). White Sea: Its
Marine Environment and Ecosystem Dynamics Influenced by Global Change. Springer and Praxis
Publishing, UK, 472p.
[17]. Juang, D. F., Lee, C. H. & Hsueh, S. C. (2009). Chlorinated volatile organic compounds found near the
water surface of heavily polluted rivers. International Journal of Environmental Science and
Technology, 6(4), 545-556.
[18]. Khadse, G. K., Patni, P. M., Kelkar, P. S. & Devotta, S., (2008). Qualitative evaluation of Kanhan river
and its tributaries flowing over central Indian plateau. Environmental Monitoring and Assessment,
147(1-3), 83-92.
[19]. Kraft, C., Tumpling, W. & Zachmann, D.W., (2006). The effects of mining in Northern Romania
[20]. on the heavy metal distribution in sediments of the rivers Szamos. International Journal Environmental
Science Technology, 7(4), 785-792.
[21]. Lee, C. L., Li, X. D., Zhang, G., Li, J., Ding, A. J. & Wang, T., (2007). Heavy metals and Pb isotopic
composition of aerosols in urban and suburban areas of Hong Kong and Guangzhou, South China
Evidence of the long-range transport of air contaminants. Environmental Pollution, 41(1), 432-447.
[22]. Macklin, M. G., Brewer, P. A., Balteanu, D., Coulthard, T. J., Driga, B., Howard, A. J & Zaharia, S.,
(2003). The long term fate and environmental significance of contaminant metals released by the
January and March 2000 mining tailings dam failure in Maramures County, upper Tisa basin, Romania.
Applied Geochemistry, 18(2), 241-257.
[23]. NSDWQ, (2007). Nigerian Standard for Drinking Water Quality. Nigerian Industrial Standard,
NIS:554, 1-14.
[24]. Nwankwoala, H. O. & Mmom, P. C., (2007). Towards sustainable management of Groundwater in the
greater Port Harcourt metropolis. A paper presented at the 15th
annual conference of the Nigerian
Environmental Society, held at the hotel presidential, Port Harcourt.
[25]. Ofoegbu, C. O., (1998). Groundwater and mineral resources of Nigeria. Earth Evolution Science,
Viewing, Germany, 45-47.
[26]. Onyeagocha, A. C., (1980). Petrography and depositional environment of the Benin Formation,
Nigeria. Journal of Mining and Geology, 17, 147-151.
[27]. Petters, S.W., (1991) Some Late Tertiary foraminifera from parabe-1 well, Eastern Niger Delta. Revista
Espanola de micropaleontologia, Spain, 11, 1190-133.
[28]. Reyment, R. A., (1965). Aspects of the geology of Nigeria, University of Ibadan press, 145-147.
[29]. Weber, K. J. & Dankoru. E. M., (1976). Petroleum geology of Niger Delta, Tokyo, 9th
World
Petroleum Congress Proceedings, London Applied Publishers, Ltd., 2, 209 – 221.