Trading the cloud the chikou span (part two)
•
8 likes•5,793 views

Part two of my Chikou span guide. In this guide I show traders how we can use the Chikou span to plot strong support and resistance lines.

Recommended
More Related Content
What's hot
What's hot (20)
Viewers also liked
Viewers also liked (8)
Similar to Trading the cloud the chikou span (part two)
Similar to Trading the cloud the chikou span (part two) (20)
Recently uploaded
Recently uploaded (20)
Trading the cloud the chikou span (part two)
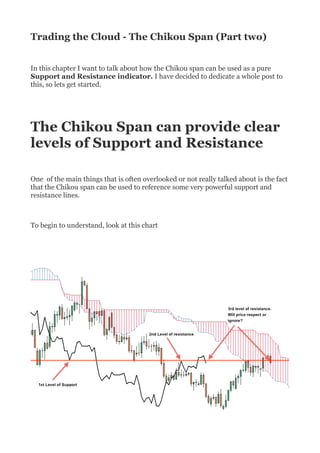
- 1. Trading the Cloud - The Chikou Span (Part two) In this chapter I want to talk about how the Chikou span can be used as a pure Support and Resistance indicator. I have decided to dedicate a whole post to this, so lets get started. The Chikou Span can provide clear levels of Support and Resistance One of the main things that is often overlooked or not really talked about is the fact that the Chikou span can be used to reference some very powerful support and resistance lines. To begin to understand, look at this chart
- 2. Looking at the chart above, you can see that the chikou span can provide support and resistance lines for future moves. Because the chikou span represents prior closing prices, it is perfect for mapping past areas of support/resistance. We can find these Support and Resistance lines by drawing a horizontal line across the 'points' created by the Chikou span, this helps us to see these key levels and utilise on our analysis and trading decisions. In the chart above I have taken an example of support and resistance by drawing a line across 3 points of the chikou span. I will break this down to explain it better. As you can see in the first instance, price at first respected the support, but then 11 candles later broke through, turning the support into a resistance. Once a support line is broken it becomes resistance, and visa versa. Now lets look at the second point of resistance
- 3. You can now see price again respected the resistance and struggled to break through. until 6 candles later where it seems to have broken upwards but soon dropped back below. So we are at the point on the chart where price is undecided on direction. Will it respect the resistance and move down?, or will it respect the support and move up?
- 4. Luckily because price is now trading in the Kumo cloud we are advised to not open any new trades until price breaks out from either side. And of course you know this because you should have read my beginners Kumo trading guide.....right?.....good. So we now wait, if price breaks above Kumo we can open a BUY trade if price breaks below Kumo cloud then we would open a SELL trade. This is a great example of how we can use 2 or more of the components of ichimoku to decide where price will move. There is a lot more detail to go into about how we can use the Chikou span as a Support and Resistance tool, including how sometimes it can almost mimic the common S/R Fibonacci indicator which is used by most Forex traders worldwide, I will be covering this in my advanced ichimoku guides in future blog posts. Lastly I want to leave you with this chart.
- 5. You can see by just adding some simple lines across recurring points of the Chikou Span can help you plot some very reliable Support and Resistance areas. load up some charts on your PC and try doing this yourself now. If you have any questions or there is something you didn't understand and need a little more help, don't hesitate to leave a comment below and I will do my best to help you. We have now covered the basics of the Chikou Span, in my next blog post I will be looking at the Tenkou Sen. See you then Chris (admin)