
Recommended
More Related Content
More from guest20ee0
Recently uploaded
Recently uploaded (20)
Tmd Evening Update10202008
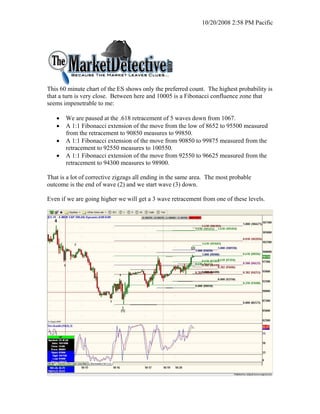
- 1. 10/20/2008 2:58 PM Pacific This 60 minute chart of the ES shows only the preferred count. The highest probability is that a turn is very close. Between here and 10005 is a Fibonacci confluence zone that seems impenetrable to me: • We are paused at the .618 retracement of 5 waves down from 1067. • A 1:1 Fibonacci extension of the move from the low of 8652 to 95500 measured from the retracement to 90850 measures to 99850. • A 1:1 Fibonacci extension of the move from 90850 to 99875 measured from the retracement to 92550 measures to 100550. • A 1:1 Fibonacci extension of the move from 92550 to 96625 measured from the retracement to 94300 measures to 98900. That is a lot of corrective zigzags all ending in the same area. The most probable outcome is the end of wave (2) and we start wave (3) down. Even if we are going higher we will get a 3 wave retracement from one of these levels.
- 2. 10/20/2008 2:58 PM Pacific TMD/DW The market detective provides personal market opinion based on sound technical analysis and research. However, no warranty is given or implied as to its true reliability. The market detective will make errors and mistakes. The market detective is not an investment adviser and is not making recommendations to buy, sell, or place orders relating to the futures contracts, ETFs, or stocks that he writes about. The responsibility for decisions made from information contained in this service are solely that of the individual subscriber. The individual must fully research and make his/her own decisions before acting on any information provided by the market detective. The market detective assumes no responsibility for subscriber investment or trading results.