(Vedika) Low Rate Call Girls in Pune Call Now 8250077686 Pune Escorts 24x7
ecolab Ecolab_BusDesc_FinHigh
1. Description
of Business
Ecolab is the leading global developer and marketer of premium cleaning, sanitizing, pest elimination, maintenance and repair products and services for the
world’s hospitality, foodservice, institutional and industrial markets. Founded in 1923 and headquartered in St. Paul, Minn., Ecolab reaches customers in more than
160 countries across North America, Europe, Asia Pacific, Latin America, the Middle East and Africa, and employs more than 21,000 associates worldwide.
Customers include hotels and restaurants; healthcare and educational facilities; quickservice (fast-food and convenience stores) units; grocery stores; commercial
and institutional laundries; light industry; dairy plants and farms; food and beverage processors; pharmaceutical and cosmetic facilities; and the vehicle wash
industry. Products and services are marketed by the industry’s largest and best-trained direct sales-and-service force, numbering more than 12,000 associates who
advise and assist customers in meeting a full range of cleaning, sanitation and service needs.
Ecolab common stock is traded on the New York Stock Exchange and Pacific Exchange under the symbol ECL. Ecolab news releases and other selected
investor information are available on the Internet at www.ecolab.com.
Forward-Looking Statements and Risk Factors
We refer readers to the company’s disclosure, entitled “Forward-Looking Statements and Risk Factors,” which is located on page 30 of this Annual Report.
Financial
Highlights
Percent Change
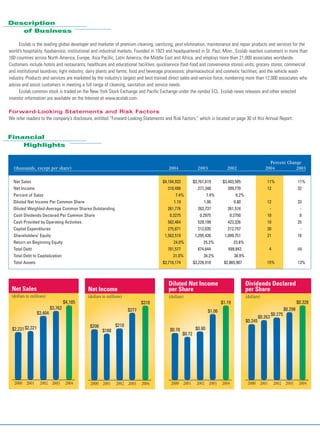
(thousands, except per share) 2004 2003 2002 2004 2003
Net Sales $4,184,933 $3,761,819 $3,403,585 11% 11%
Net Income 310,488 277,348 209,770 12 32
Percent of Sales 7.4% 7.4% 6.2%
Diluted Net Income Per Common Share 1.19 1.06 0.80 12 33
Diluted Weighted-Average Common Shares Outstanding 261,776 262,737 261,574 - -
Cash Dividends Declared Per Common Share 0.3275 0.2975 0.2750 10 8
Cash Provided by Operating Activities 582,464 529,199 423,326 10 25
Capital Expenditures 275,871 212,035 212,757 30 -
Shareholders’ Equity 1,562,519 1,295,426 1,099,751 21 18
Return on Beginning Equity 24.0% 25.2% 23.8%
Total Debt 701,577 674,644 699,842 4 (4)
Total Debt to Capitalization 31.0% 34.2% 38.9%
Total Assets $3,716,174 $3,228,918 $2,865,907 15% 13%
Diluted Net Income Dividends Declared
Net Sales Net Income per Share per Share
(dollars in millions) (dollars in millions) (dollars) (dollars)
$4,185 $0.328
$1.19
$310
$3,762 $0.298
$277 $1.06
$3,404 $0.275
$0.263
$0.245
$210
$206
$2,231 $2,321 $0.80
$0.78
$188
$0.72
2000 2001 2002 2003 2004 2000 2001 2002 2003 2004 2000 2001 2002 2003 2004
2000 2001 2002 2003 2004
2. Net Sales Ecolab Business Mix 2004
(dollars in millions)
United States 51% G International 49%
$4,185
G Institutional 25% Europe/Africa/ME 35%
$3,762
$3,404 G Food & Beverage 8% Asia Pacific 7%
G Pest Elimination 5% Canada 3%
G Kay 5% Latin America 3%
G GCS Service 3% Other 1%
G Professional Products 1%
G Healthcare 1%
G Vehicle Care 1%
G Textile Care 1%
G Water Care Services 1%
2002 2003 2004
Customers/Markets
Served
Customers Healthcare facilities Light manufacturing industries
Dairy farms and plants Fleet and vehicle wash
Full-service restaurants
Food, beverage and brewery plants
Quickservice restaurants
Markets
Pharmaceutical and cosmetic facilities
Hotels
Office buildings United States
Food retail
Shopping malls Europe/Africa/ME
Schools
Recreational facilities Asia Pacific
Colleges and universities
Building service contractors Canada
Laundries
Cruise lines Latin America
Hospitals
Foodservice operators
Nursing homes
Sales-and-Service
Ecolab
Associates
Stock Performance
2002 2003 2004 (December 31) 2002 2003 2004
Quarter Low High Low High Low High
Institutional* 3,125 3,190 3,055
First $19.43 $23.94 $23.08 $26.00 $26.12 $28.61
Kay 245 275 325
Second 21.25 24.00 24.21 27.92 27.95 31.77
Pest Elimination 1,555 1,645 1,725
Third 18.27 24.51 23.78 26.80 29.04 31.80
Professional Products** 175 180 95
Fourth 20.71 25.20 25.15 27.89 31.32 35.59
Healthcare** - - 70
GCS Service 530 535 470
Textile Care 85 80 75
Food & Beverage 395 405 450
Ecolab Stock Performance Comparison
Water Care Services 100 95 95
$38
Vehicle Care 100 100 100
∑ Ecolab Stock Price 1.70
$36
Europe/Africa/ME 3,370 3,285 3,915
∑ Ecolab Stock Price Index, Dec. 31, 2001=1.00
$34
Asia Pacific 925 1,015 960
∑ S&P 500 Index, Dec. 31, 2001 = 1.00 1.50
$32
Canada 320 340 355
Ecolab, S&P 500 Indices
$30
Ecolab Stock Price
1.30 Latin America 485 540 590
$28
Total 11,410 11,685 12,280
$26 1.10
$24
*2004 decrease of 250 associates due to
$22 0.90 the sale of a grease management product line.
$20 **2004 reflects the separation of Healthcare
0.70 from Professional Products.
$18
4Q 1Q 2Q 3Q 4Q 1Q 2Q 3Q 4Q 1Q 2Q 3Q 4Q
2001 2002 2003 2004