
Recommended
More Related Content
What's hot
What's hot (14)
Viewers also liked
Viewers also liked (20)
Similar to Amd Q207 Financials
Similar to Amd Q207 Financials (20)
More from earningsreport
More from earningsreport (20)
Recently uploaded
Recently uploaded (20)
Amd Q207 Financials
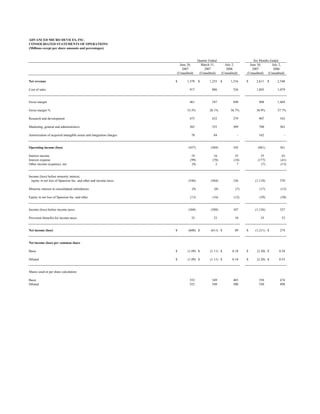
- 1. ADVANCED MICRO DEVICES, INC. CONSOLIDATED STATEMENTS OF OPERATIONS (Millions except per share amounts and percentages) Quarter Ended Six Months Ended June 30, March 31, July 2, June 30, July 2, 2007 2007 2006 2007 2006 (Unaudited) (Unaudited) (Unaudited) (Unaudited) (Unaudited) Net revenue $ 1,378 $ 1,233 $ 1,216 $ 2,611 $ 2,548 Cost of sales 917 886 526 1,803 1,079 Gross margin 461 347 690 808 1,469 Gross margin % 33.5% 28.1% 56.7% 30.9% 57.7% Research and development 475 432 279 907 543 Marketing, general and administrative 365 335 309 700 565 Amortization of acquired intangible assets and integration charges 78 84 - 162 - Operating income (loss) (457) (504) 102 (961) 361 Interest income 19 16 35 35 63 Interest expense (99) (78) (18) (177) (41) Other income (expense), net (9) 2 7 (7) (13) Income (loss) before minority interest, equity in net loss of Spansion Inc. and other and income taxes (546) (564) 126 (1,110) 370 Minority interest in consolidated subsidiaries (9) (8) (7) (17) (13) Equity in net loss of Spansion Inc. and other (13) (16) (12) (29) (30) Income (loss) before income taxes (568) (588) 107 (1,156) 327 Provision (benefit) for income taxes 32 23 18 55 53 Net income (loss) $ (600) $ (611) $ 89 $ (1,211) $ 274 Net income (loss) per common share Basic $ (1.09) $ (1.11) $ 0.18 $ (2.20) $ 0.58 Diluted $ (1.09) $ (1.11) $ 0.18 $ (2.20) $ 0.55 Shares used in per share calculation Basic 552 549 485 550 474 Diluted 552 549 500 550 498
- 2. ADVANCED MICRO DEVICES, INC. CONSOLIDATED BALANCE SHEETS (Millions) June 30, March 31, December 31, 2007 2007 2006* (Unaudited) (Unaudited) Assets Current assets: Cash, cash equivalents and marketable securities $ 1,594 $ 1,167 $ 1,541 Accounts receivable, net 648 667 1,140 Inventories 892 938 814 Prepaid expenses and other current assets 410 344 443 Deferred income taxes 54 71 25 Total current assets 3,598 3,187 3,963 Property, plant and equipment, net 4,575 4,405 3,987 Goodwill 3,180 3,186 3,217 Net investment in Spansion Inc. 326 345 371 Acquisition related intangible assets, net 1,065 1,136 1,207 Other assets 480 453 402 Total Assets $ 13,224 $ 12,712 $ 13,147 Liabilities and Stockholders' Equity Current liabilities: Accounts payable $ 985 $ 1,365 $ 1,338 Accrued compensation and benefits 192 160 177 Accrued liabilities 768 719 716 Deferred income on shipments to distributors 92 181 169 Current portion of long-term debt and capital lease obligations 219 182 125 Other current liabilities 220 304 327 Total current liabilities 2,476 2,911 2,852 Deferred income taxes 56 43 31 Long-term debt and capital lease obligations, less current portion 5,318 3,659 3,672 Other long-term liabilities 610 591 517 Minority interest in consolidated subsidiaries 292 303 290 Stockholders' equity: Capital stock: Common stock, par value 6 6 5 Capital in excess of par value 5,237 5,372 5,316 Retained (deficit) earnings (932) (332) 308 Accumulated other comprehensive income 161 159 156 Total stockholders' equity 4,472 5,205 5,785 Total Liabilities and Stockholders' Equity $ 13,224 $ 12,712 $ 13,147 * Derived from the December 31, 2006 Audited Financial Statements of Advanced Micro Devices, Inc.
- 3. ADVANCED MICRO DEVICES, INC. SELECTED CORPORATE DATA (Unaudited) (Millions except headcount and percentages) Quarter Ended Six Months Ended June 30, March 31, July 2, June 30, July 2, Segment Information (1) 2007 2007 2006 2007 2006 Computing Solutions (2) Net revenue $ 1,098 $ 918 $ 1,216 $ 2,016 $ 2,553 Operating income (loss) $ (258) $ (321) $ 136 $ (579) $ 448 Graphics (3) Net revenue 195 197 - 392 - Operating income (loss) (50) (35) - (85) - Consumer Electronics (4) Net revenue 85 118 - 203 - Operating income (loss) (22) (4) - (26) - All Other (5) Net revenue - - - - (5) Operating income (loss) (127) (144) (34) (271) (87) Total AMD Net revenue $ 1,378 $ 1,233 $ 1,216 $ 2,611 $ 2,548 Operating income (loss) $ (457) $ (504) $ 102 $ (961) $ 361 Other Data Depreciation & amortization (excluding amortization of acquired intangible assets) $ 255 $ 243 $ 193 $ 498 $ 367 Capital additions $ 414 $ 586 $ 455 $ 1,000 $ 765 Headcount 16,719 16,745 10,967 16,719 10,967 Adjusted EBITDA (6) $ (143) $ (196) $ 318 $ (339) $ 735 (1) Starting in Q406, the Company no longer allocates employee stock-based compensation and profit sharing expenses to its segments. These expenses are recorded in the All Other category. Prior period information has been restated to conform to current period presentation. (2) Computing Solutions segment includes what was formerly the Computation Products segment and the Embedded Products segment as well as revenue from sales of chipsets sold by ATI prior to AMD's acquisition of ATI. (3) Graphics segment includes 3D graphics, video and multimedia products developed for use in desktop and notebook computers, including home media PCs, professional workstations and servers. (4) Consumer Electronics segment includes products and revenue related to mobile phones and PDAs, digital televisions and other consumer electronics and revenue from royalties received in connection with sales of game console systems that incorporate the Company’s products. (5) All Other category includes employee stock-based compensation expense, profit sharing expense, certain operating expenses and credits that are not allocated to the operating segments, and Personal Internet Communicator (PIC) related activities in Q206 and for six months ended Q206. Also included in this category are the ATI acquisition-related and integration charges incurred in Q207 and Q107 and severance charges incurred in Q207. Details of the ATI acquisition-related, integration and severance charges and employee stock-based compensation expense are shown below. ATI acquisition-related, integration and severance charges: Employee stock-based compensation expense: Q207 Q107 Q207 Q107 Q206 Cost of sales Amortization of acquired intangible assets $ 71 $ 71 $ 2 $2 $ 2 Integration charges 7 13 Research and development 14 14 7 Subtotal 78 84 Marketing, general and administrative 15 12 9 Cost of fair value adjustment of acquired inventory $ 31 $ 28 $ 18 - 29 ATI acquisition-related and integration charges $ 78 $ 113 Severance $ 16 $- Total $ 94 $ 113 (6) Reconciliation of Net income (loss) to Adjusted EBITDA* Q207 Q107 Q206 Net income (loss) $ (600) $ (611) $ 89 Depreciation and amortization 255 243 193 Amortization of acquired intangible assets 71 71 - Interest expense 99 78 18 Provision (benefit) for income taxes 32 23 18 Adjusted EBITDA $ (143) $ (196) $ 318 * The Company defines Adjusted EBITDA as net income (loss) adjusted for depreciation and amortization, amortization of acquired intangible assets, interest expense and taxes. The Company calculated and communicated Adjusted EBITDA because management believes it is of interest to investors and lenders in relation to its overall capital structure and its ability to borrow additional funds. The Company’s calculation of Adjusted EBITDA may or may not be consistent with the calculation of this measure by other companies in the same industry. Investors should not view Adjusted EBITDA as an alternative to the U.S. GAAP operating measure of net income or U.S. GAAP liquidity measures of cash flows from operating, investing and financing activities. In addition, Adjusted EBITDA does not take into account changes in certain assets and liabilities as well as interest and income taxes that can affect cash flows.