SlideShare a Scribd company logo
1 of 3
ADVANCED MICRO DEVICES, INC.
CONSOLIDATED STATEMENTS OF OPERATIONS
(Millions except per share amounts and percentages)


                                                                                                                             Quarter Ended                           Year Ended
                                                                                                           Dec. 29,            Sept. 29,        Dec. 31,       Dec. 29,      Dec. 31,
                                                                                                            2007                 2007            2006           2007          2006*
                                                                                                         (Unaudited)          (Unaudited)     (Unaudited)    (Unaudited)

Net revenue                                                                                             $        1,770       $       1,632    $     1,773    $     6,013    $    5,649

Cost of sales                                                                                                     985                 963           1,132          3,751         2,856


Gross margin                                                                                                      785                 669             641          2,262         2,793

Gross margin %                                                                                                    44%                 41%             36%            38%           49%

Research and development                                                                                          473                 467             385          1,847         1,205

Marketing, general and administrative                                                                             321                 352             296          1,373         1,140

In-process research and development                                                                                     -                -            416              -           416

Amortization of acquired intangible assets and integration charges                                                     61               76             73            299            79

Impairment of goodwill and acquired intangible assets                                                            1,608                   -              -          1,608                -


Operating income (loss)                                                                                         (1,678)               (226)          (529)        (2,865)           (47)

Interest income                                                                                                     19                  19             22             73           116
Interest expense                                                                                                   (95)                (95)           (67)          (367)         (126)
Other income (expense), net                                                                                          1                  (1)             2             (7)          (13)


Income (loss) before minority interest,
  equity in net loss of Spansion Inc. and other and income taxes                                                (1,753)               (303)          (572)        (3,166)           (70)

Minority interest in consolidated subsidiaries                                                                         (9)              (9)            (8)           (35)           (28)

Equity in net loss of Spansion Inc. and other                                                                      (69)                (57)            (5)          (155)           (45)


Income (loss) before income taxes                                                                               (1,831)               (369)          (585)        (3,356)         (143)

Provision (benefit) for income taxes                                                                               (59)                 27             (9)            23            23


Net income (loss)                                                                                       $       (1,772) $             (396) $        (576)   $    (3,379) $       (166)


Net income (loss) per common share

Basic                                                                                                   $        (3.06) $            (0.71) $       (1.08)   $     (6.06) $       (0.34)

Diluted                                                                                                 $        (3.06) $            (0.71) $       (1.08)   $     (6.06) $       (0.34)


Shares used in per share calculation

Basic                                                                                                             579                 554             531            558           492
Diluted                                                                                                           579                 554             531            558           492


* Amounts for the year ended December 31, 2006 were derived from the December 31, 2006 audited financial statements.
ADVANCED MICRO DEVICES, INC.
CONSOLIDATED BALANCE SHEETS
(Millions)
                                                                                                         Dec. 29,            Sept. 29,           Dec. 31,
                                                                                                          2007                 2007               2006*
                                                                                                       (Unaudited)          (Unaudited)

Assets

Current assets:
  Cash, cash equivalents and marketable securities                                                 $           1,889    $           1,528    $         1,541
  Accounts receivable, net                                                                                       640                  682              1,140
  Inventories                                                                                                    821                  839                814
  Prepaid expenses and other current assets                                                                      402                  432                443
  Deferred income taxes                                                                                           64                   62                 25


          Total current assets                                                                                 3,816                3,543              3,963

Property, plant and equipment, net                                                                             4,720                4,725              3,987
Goodwill                                                                                                       1,907                3,165              3,217
Investment in Spansion Inc.                                                                                        -                    -                371
Acquisition related intangible assets, net                                                                       587                  994              1,207
Other assets                                                                                                     520                  507                402


Total Assets                                                                                       $          11,550    $          12,934    $        13,147

Liabilities and Stockholders' Equity

Current liabilities:
  Accounts payable                                                                                 $           1,009    $           1,064    $         1,338
  Accrued compensation and benefits                                                                              186                  198                177
  Accrued liabilities                                                                                            821                  858                769
  Deferred income on shipments to distributors                                                                   101                  106                169
  Current portion of long-term debt and capital lease obligations                                                238                  218                125
  Other current liabilities                                                                                      270                  283                327

          Total current liabilities                                                                            2,625                2,727              2,905

Deferred income taxes                                                                                              6                   32                 31
Long-term debt and capital lease obligations, less current portion                                             5,031                5,117              3,672
Other long-term liabilities                                                                                      633                  650                517
Minority interest in consolidated subsidiaries                                                                   265                  283                237

Stockholders' equity:
   Capital stock:
      Common stock, par value                                                                                      6                    6                  5
      Capital in excess of par value                                                                           5,921                5,280              5,316
   Retained earnings (deficit)                                                                                (3,100)              (1,328)               308
   Accumulated other comprehensive income                                                                        163                  167                156

          Total stockholders' equity                                                                           2,990                4,125              5,785


Total Liabilities and Stockholders' Equity                                                         $          11,550    $          12,934    $        13,147


* Amounts for the year ended December 31, 2006 were derived from the December 31, 2006 audited financial statements.
ADVANCED MICRO DEVICES, INC.
SELECTED CORPORATE DATA
(Unaudited)
(Millions except headcount and percentages)

                                                                                                                                                      Quarter Ended                                                                                           Year Ended
                                                                                                                            Dec. 29,                           Sept. 29,                       Dec. 31,                                         Dec. 29,                       Dec. 31,
Segment Information                                                                                                          2007                                2007                           2006                                             2007                           2006


Computing Solutions (1)
   Net revenue                                                                                                          $    1,402                               $ 1,283                        $ 1,486                                         $    4,702                 $ 5,367
   Operating income (loss)                                                                                              $       21                               $ (112)                        $    65                                         $     (670)                $   680

Graphics (2)
    Net revenue                                                                                                                259                                     252                            166                                              903                        166
    Operating income (loss)                                                                                                    (12)                                     (3)                           (27)                                            (100)                       (27)

Consumer Electronics (3)
    Net revenue                                                                                                                109                                      97                            120                                             408                         120
    Operating income (loss)                                                                                                     12                                      (3)                            20                                             (17)                         20

All Other (4)
     Net revenue                                                                                                                -                                       -                                1                                             -                           (4)
     Operating income (loss)                                                                                                 (1,699)                                   (108)                          (587)                                         (2,078)                      (720)

Total AMD
    Net revenue                                                                                                         $ 1,770                                  $ 1,632                        $ 1,773                                         $ 6,013                    $ 5,649
    Operating income (loss)                                                                                             $ (1,678)                                $ (226)                        $ (529)                                         $ (2,865)                  $   (47)


Other Data

Depreciation & amortization (excluding
    amortization of acquired intangible assets)                                                                         $      273                               $     263                      $     224                                       $    1,034                 $      791

Capital additions                                                                                                       $      267                               $     419                      $     666                                       $    1,686                 $ 1,856

Headcount                                                                                                                   16,420                                   16,498                         16,464                                          16,420                     16,464


Adjusted EBITDA (5)                                                                                                     $      203                               $      60                      $     169                                       $      (76)                $ 1,237


(1) Computing Solutions segment includes what was formerly the Computation Products segment and the Embedded Products segment as well as revenue from sales of ATI chipsets.

(2) Graphics segment includes graphics, video and multimedia products developed for use in desktop and notebook computers, including home media PCs, professional workstations and
    servers.
(3) Consumer Electronics segment includes products for and revenue related to mobile phones and PDAs, digital televisions and other consumer electronics and royalties received in
    connection with the sale of game console systems that incorporate the Company’s technology.
(4) All Other category includes employee stock-based compensation expense, profit sharing expense, certain operating expenses and credits that are not allocated to the operating
    segments, and Personal Internet Communicator (PIC) related activities in 2006. Also included in this category are the ATI acquisition-related and severance charges. Details of the
    ATI acquisition-related and severance charges and employee stock-based compensation expense are shown below.

     ATI acquisition-related and severance charges:                                                                                                                            Employee stock-based compensation expense:
                                                                                         Quarter Ended                                   Year Ended                                                                      Quarter Ended                                       Year Ended
                                                                                     Q407     Q307 Q406                                 FY07    FY06                                                                 Q407   Q307      Q406                                  FY07    FY06
     Amortization of acquired intangible assets                                    $     58 $ 71 $ 47                                  $ 271 $ 47                                                                    $ 3$         2$2                                      $    9$       8
                                                                                                                                                                               Cost of sales
                                                                                          3       5     26                                  28      32                         Research and development                12        14     13                                     54       30
     Integration charges
                                                                                   $     61 $ 76 $ 73                                  $ 299 $ 79                              Marketing, general and administrative   11        11     12                                     49       39
      Subtotal
                                                                                      1,608        -     -                               1,608       -
     Impairment of goodwill and acquired intangible assets                                                                                                                                                           $ 26 $      27 $ 27                                   $ 112 $ 77
     In-process research and development                                                  -        -   416                                   -     416
                                                                                          -        -    62                                  29      62
     Cost of fair value adjustment of acquired inventory
                                                                                   $ 1,669 $ 76 $ 551                                  $ 1,936 $ 557
      ATI acquisition-related charges
                                                                                          -       2      -                                  18       -
     Severance
                                                                                   $ 1,669 $ 78 $ 551                                  $ 1,954 $ 557
       Total ATI acquisition-related and severance charges

(5) Reconciliation of Net income (loss) to Adjusted EBITDA*
                                                                                         Quarter Ended                                    Year Ended
                                                                                    Q407      Q307 Q406                                  FY07     FY06
     Net income (loss)                                                             $ (1,772) $ (396) $ (576)                           $ (3,379) $ (166)
     Depreciation and amortization                                                      273     263     224                               1,034      791
     In-process research and development                                                  -        -    416                                   -      416
     Amortization of acquired intangible assets                                          58      71      47                                 271       47
     Impairment of goodwill and acquired intangible assets                            1,608        -      -                               1,608        -
     Interest expense                                                                    95      95      67                                 367      126
     Provision (benefit) for income taxes                                               (59)     27      (9)                                 23       23
     Adjusted EBITDA                                                               $ 203 $ 60 $ 169                                    $    (76) $ 1,237


   * The Company defines Adjusted EBITDA as net income (loss) adjusted for depreciation and amortization, in-process research and development, amortization of acquired intangible assets, impairment of goodwill and acquired intangib
    assets, interest expense and taxes. The Company calculated and communicated Adjusted EBITDA because management believes it is of interest to investors and lenders in relation to its overall capital structure and its ability to borrow
    additional funds. The Company’s calculation of Adjusted EBITDA may or may not be consistent with the calculation of this measure by other companies in the same industry. Investors should not view Adjusted EBITDA as an
    alternative to the U.S. GAAP operating measure of net income or U.S. GAAP liquidity measures of cash flows from operating, investing and financing activities. In addition, Adjusted EBITDA does not take into account changes in
    certain assets and liabilities as well as interest and income taxes that can affect cash flows.

More Related Content

What's hot

conoco phillips 2004Fourth Quarter
conoco phillips 2004Fourth Quarterconoco phillips 2004Fourth Quarter
conoco phillips 2004Fourth Quarterfinance1
 
conoco phillips 2005Third Quarter
conoco phillips 2005Third Quarterconoco phillips 2005Third Quarter
conoco phillips 2005Third Quarterfinance1
 
conoco phillips 2005Fourth Quarter
conoco phillips 2005Fourth Quarterconoco phillips 2005Fourth Quarter
conoco phillips 2005Fourth Quarterfinance1
 
conoco phillips 2006Fourth Quarter
conoco phillips 2006Fourth Quarterconoco phillips 2006Fourth Quarter
conoco phillips 2006Fourth Quarterfinance1
 
AES 2007 Fact Book Update FINAL
 AES 2007 Fact Book Update FINAL AES 2007 Fact Book Update FINAL
AES 2007 Fact Book Update FINALfinance19
 
fluor annual reports 2003
fluor annual reports 2003fluor annual reports 2003
fluor annual reports 2003finance15
 

What's hot (10)

Amd Results Q406
Amd Results Q406Amd Results Q406
Amd Results Q406
 
conoco phillips 2004Fourth Quarter
conoco phillips 2004Fourth Quarterconoco phillips 2004Fourth Quarter
conoco phillips 2004Fourth Quarter
 
Q1 2009 Earning Report of Potlatch Corp
Q1 2009 Earning Report of Potlatch CorpQ1 2009 Earning Report of Potlatch Corp
Q1 2009 Earning Report of Potlatch Corp
 
conoco phillips 2005Third Quarter
conoco phillips 2005Third Quarterconoco phillips 2005Third Quarter
conoco phillips 2005Third Quarter
 
Q1 2009 Earning Report of Sandisk
Q1 2009 Earning Report of SandiskQ1 2009 Earning Report of Sandisk
Q1 2009 Earning Report of Sandisk
 
conoco phillips 2005Fourth Quarter
conoco phillips 2005Fourth Quarterconoco phillips 2005Fourth Quarter
conoco phillips 2005Fourth Quarter
 
conoco phillips 2006Fourth Quarter
conoco phillips 2006Fourth Quarterconoco phillips 2006Fourth Quarter
conoco phillips 2006Fourth Quarter
 
AES 2007 Fact Book Update FINAL
 AES 2007 Fact Book Update FINAL AES 2007 Fact Book Update FINAL
AES 2007 Fact Book Update FINAL
 
Amd Q108 Financials
Amd Q108 FinancialsAmd Q108 Financials
Amd Q108 Financials
 
fluor annual reports 2003
fluor annual reports 2003fluor annual reports 2003
fluor annual reports 2003
 

Similar to AMD Reports Q4 and FY 2007 Financial Results

advanced micro devices Q408Financials
advanced micro devices Q408Financialsadvanced micro devices Q408Financials
advanced micro devices Q408Financialsfinance34
 
AMD Q408Financials
AMD Q408FinancialsAMD Q408Financials
AMD Q408Financialsfinance34
 
AMD-Q408Financials
AMD-Q408FinancialsAMD-Q408Financials
AMD-Q408Financialsfinance34
 
AMD Q408Financials
AMD Q408FinancialsAMD Q408Financials
AMD Q408Financialsfinance34
 
advanced micro devices Q408Financials
advanced micro devices Q408Financialsadvanced micro devices Q408Financials
advanced micro devices Q408Financialsfinance34
 
advanced micro devices Q207Financials
advanced micro devices Q207Financialsadvanced micro devices Q207Financials
advanced micro devices Q207Financialsfinance34
 
advanced micro devices Q307Financials
advanced micro devices Q307Financialsadvanced micro devices Q307Financials
advanced micro devices Q307Financialsfinance34
 
advanced micro devices Q208Financials
advanced micro devices Q208Financialsadvanced micro devices Q208Financials
advanced micro devices Q208Financialsfinance34
 
advanced micro devices ResultsQ406
advanced micro devices ResultsQ406advanced micro devices ResultsQ406
advanced micro devices ResultsQ406finance34
 
advanced micro devices Q308Financials
advanced micro devices Q308Financialsadvanced micro devices Q308Financials
advanced micro devices Q308Financialsfinance34
 
Q1 2009 Earning Report of Advanced Micro Devices
Q1 2009 Earning Report of Advanced Micro DevicesQ1 2009 Earning Report of Advanced Micro Devices
Q1 2009 Earning Report of Advanced Micro Devicesearningreport earningreport
 
4Q06OpStats_FNAL_022307
4Q06OpStats_FNAL_0223074Q06OpStats_FNAL_022307
4Q06OpStats_FNAL_022307finance49
 
reliance steel & aluminum 2006_AnnualReport
reliance steel & aluminum  2006_AnnualReportreliance steel & aluminum  2006_AnnualReport
reliance steel & aluminum 2006_AnnualReportfinance32
 
advanced micro devices Q108Financials
advanced micro devices Q108Financialsadvanced micro devices Q108Financials
advanced micro devices Q108Financialsfinance34
 
AES 2007 Fact Book Update FINAL
 AES 2007 Fact Book Update FINAL AES 2007 Fact Book Update FINAL
AES 2007 Fact Book Update FINALfinance19
 
AES 2007Fact Book Update fINAL
 AES 2007Fact Book Update fINAL AES 2007Fact Book Update fINAL
AES 2007Fact Book Update fINALfinance19
 
chubb 8922 Supplementary Investor Information
chubb 8922 Supplementary Investor Informationchubb 8922 Supplementary Investor Information
chubb 8922 Supplementary Investor Informationfinance18
 

Similar to AMD Reports Q4 and FY 2007 Financial Results (20)

advanced micro devices Q408Financials
advanced micro devices Q408Financialsadvanced micro devices Q408Financials
advanced micro devices Q408Financials
 
AMD Q408Financials
AMD Q408FinancialsAMD Q408Financials
AMD Q408Financials
 
AMD-Q408Financials
AMD-Q408FinancialsAMD-Q408Financials
AMD-Q408Financials
 
AMD Q408Financials
AMD Q408FinancialsAMD Q408Financials
AMD Q408Financials
 
advanced micro devices Q408Financials
advanced micro devices Q408Financialsadvanced micro devices Q408Financials
advanced micro devices Q408Financials
 
advanced micro devices Q207Financials
advanced micro devices Q207Financialsadvanced micro devices Q207Financials
advanced micro devices Q207Financials
 
Amd Q207 Financials
Amd Q207 FinancialsAmd Q207 Financials
Amd Q207 Financials
 
advanced micro devices Q307Financials
advanced micro devices Q307Financialsadvanced micro devices Q307Financials
advanced micro devices Q307Financials
 
advanced micro devices Q208Financials
advanced micro devices Q208Financialsadvanced micro devices Q208Financials
advanced micro devices Q208Financials
 
advanced micro devices ResultsQ406
advanced micro devices ResultsQ406advanced micro devices ResultsQ406
advanced micro devices ResultsQ406
 
advanced micro devices Q308Financials
advanced micro devices Q308Financialsadvanced micro devices Q308Financials
advanced micro devices Q308Financials
 
Q1 2009 Earning Report of Advanced Micro Devices
Q1 2009 Earning Report of Advanced Micro DevicesQ1 2009 Earning Report of Advanced Micro Devices
Q1 2009 Earning Report of Advanced Micro Devices
 
4Q06OpStats_FNAL_022307
4Q06OpStats_FNAL_0223074Q06OpStats_FNAL_022307
4Q06OpStats_FNAL_022307
 
4Q05OpStats
4Q05OpStats4Q05OpStats
4Q05OpStats
 
4Q05OpStats
4Q05OpStats4Q05OpStats
4Q05OpStats
 
reliance steel & aluminum 2006_AnnualReport
reliance steel & aluminum  2006_AnnualReportreliance steel & aluminum  2006_AnnualReport
reliance steel & aluminum 2006_AnnualReport
 
advanced micro devices Q108Financials
advanced micro devices Q108Financialsadvanced micro devices Q108Financials
advanced micro devices Q108Financials
 
AES 2007 Fact Book Update FINAL
 AES 2007 Fact Book Update FINAL AES 2007 Fact Book Update FINAL
AES 2007 Fact Book Update FINAL
 
AES 2007Fact Book Update fINAL
 AES 2007Fact Book Update fINAL AES 2007Fact Book Update fINAL
AES 2007Fact Book Update fINAL
 
chubb 8922 Supplementary Investor Information
chubb 8922 Supplementary Investor Informationchubb 8922 Supplementary Investor Information
chubb 8922 Supplementary Investor Information
 

More from earningsreport

Eastman 4Q and Full Year 2008 Earnings
Eastman 4Q and Full Year 2008 Earnings Eastman 4Q and Full Year 2008 Earnings
Eastman 4Q and Full Year 2008 Earnings earningsreport
 
Gentex investor presentation
Gentex investor presentationGentex investor presentation
Gentex investor presentationearningsreport
 
L.B. Foster Reports Fourth Quarter Operating Results
L.B. Foster Reports Fourth Quarter Operating ResultsL.B. Foster Reports Fourth Quarter Operating Results
L.B. Foster Reports Fourth Quarter Operating Resultsearningsreport
 
Data Domain, Inc. Reports Fourth Quarter Financial Results
Data Domain, Inc. Reports Fourth Quarter Financial ResultsData Domain, Inc. Reports Fourth Quarter Financial Results
Data Domain, Inc. Reports Fourth Quarter Financial Resultsearningsreport
 
First Banks Announces 4Q 2008 Results
First Banks Announces 4Q  2008 ResultsFirst Banks Announces 4Q  2008 Results
First Banks Announces 4Q 2008 Resultsearningsreport
 
Questar 3Q-2008 EARNINGS
Questar 3Q-2008 EARNINGSQuestar 3Q-2008 EARNINGS
Questar 3Q-2008 EARNINGSearningsreport
 
Mitsubishi electric 3Q financial results of Fiscal 2009
Mitsubishi electric 3Q financial results of Fiscal 2009Mitsubishi electric 3Q financial results of Fiscal 2009
Mitsubishi electric 3Q financial results of Fiscal 2009earningsreport
 
Maxim 2Q FISCAL 2009 RESULTS
Maxim 2Q FISCAL 2009 RESULTSMaxim 2Q FISCAL 2009 RESULTS
Maxim 2Q FISCAL 2009 RESULTSearningsreport
 
Conexant Q1 2009 financial results
Conexant Q1 2009 financial resultsConexant Q1 2009 financial results
Conexant Q1 2009 financial resultsearningsreport
 
Flagstar Bancorp Q42008 earnings report
Flagstar Bancorp Q42008 earnings reportFlagstar Bancorp Q42008 earnings report
Flagstar Bancorp Q42008 earnings reportearningsreport
 
Capital Product Partners Fourth Quarter 2008 Earnings
Capital Product Partners Fourth Quarter 2008 EarningsCapital Product Partners Fourth Quarter 2008 Earnings
Capital Product Partners Fourth Quarter 2008 Earningsearningsreport
 
Gannett 4Q 2008 earnings release
Gannett 4Q 2008 earnings releaseGannett 4Q 2008 earnings release
Gannett 4Q 2008 earnings releaseearningsreport
 
Exxon mobil 4Q 2008 earnings release
Exxon mobil 4Q 2008 earnings releaseExxon mobil 4Q 2008 earnings release
Exxon mobil 4Q 2008 earnings releaseearningsreport
 
Chevron Q4 2008 earnings release
Chevron Q4 2008 earnings releaseChevron Q4 2008 earnings release
Chevron Q4 2008 earnings releaseearningsreport
 
Horizon Lines Fourth Quarter 2008 Earnings Release
Horizon Lines Fourth Quarter 2008 Earnings ReleaseHorizon Lines Fourth Quarter 2008 Earnings Release
Horizon Lines Fourth Quarter 2008 Earnings Releaseearningsreport
 
Sony Q3 2008 financial results
Sony Q3 2008 financial resultsSony Q3 2008 financial results
Sony Q3 2008 financial resultsearningsreport
 
Peugeot Q3 2008 financial results
Peugeot Q3 2008 financial resultsPeugeot Q3 2008 financial results
Peugeot Q3 2008 financial resultsearningsreport
 
Peugeot Financial Results for the 1st half of 2008
Peugeot  Financial Results for the 1st half of 2008Peugeot  Financial Results for the 1st half of 2008
Peugeot Financial Results for the 1st half of 2008earningsreport
 
Tesco Q3 fianancial results
Tesco Q3 fianancial resultsTesco Q3 fianancial results
Tesco Q3 fianancial resultsearningsreport
 
tesco Annual Report and Financial Statements 2008
tesco Annual Report and Financial Statements 2008tesco Annual Report and Financial Statements 2008
tesco Annual Report and Financial Statements 2008earningsreport
 

More from earningsreport (20)

Eastman 4Q and Full Year 2008 Earnings
Eastman 4Q and Full Year 2008 Earnings Eastman 4Q and Full Year 2008 Earnings
Eastman 4Q and Full Year 2008 Earnings
 
Gentex investor presentation
Gentex investor presentationGentex investor presentation
Gentex investor presentation
 
L.B. Foster Reports Fourth Quarter Operating Results
L.B. Foster Reports Fourth Quarter Operating ResultsL.B. Foster Reports Fourth Quarter Operating Results
L.B. Foster Reports Fourth Quarter Operating Results
 
Data Domain, Inc. Reports Fourth Quarter Financial Results
Data Domain, Inc. Reports Fourth Quarter Financial ResultsData Domain, Inc. Reports Fourth Quarter Financial Results
Data Domain, Inc. Reports Fourth Quarter Financial Results
 
First Banks Announces 4Q 2008 Results
First Banks Announces 4Q  2008 ResultsFirst Banks Announces 4Q  2008 Results
First Banks Announces 4Q 2008 Results
 
Questar 3Q-2008 EARNINGS
Questar 3Q-2008 EARNINGSQuestar 3Q-2008 EARNINGS
Questar 3Q-2008 EARNINGS
 
Mitsubishi electric 3Q financial results of Fiscal 2009
Mitsubishi electric 3Q financial results of Fiscal 2009Mitsubishi electric 3Q financial results of Fiscal 2009
Mitsubishi electric 3Q financial results of Fiscal 2009
 
Maxim 2Q FISCAL 2009 RESULTS
Maxim 2Q FISCAL 2009 RESULTSMaxim 2Q FISCAL 2009 RESULTS
Maxim 2Q FISCAL 2009 RESULTS
 
Conexant Q1 2009 financial results
Conexant Q1 2009 financial resultsConexant Q1 2009 financial results
Conexant Q1 2009 financial results
 
Flagstar Bancorp Q42008 earnings report
Flagstar Bancorp Q42008 earnings reportFlagstar Bancorp Q42008 earnings report
Flagstar Bancorp Q42008 earnings report
 
Capital Product Partners Fourth Quarter 2008 Earnings
Capital Product Partners Fourth Quarter 2008 EarningsCapital Product Partners Fourth Quarter 2008 Earnings
Capital Product Partners Fourth Quarter 2008 Earnings
 
Gannett 4Q 2008 earnings release
Gannett 4Q 2008 earnings releaseGannett 4Q 2008 earnings release
Gannett 4Q 2008 earnings release
 
Exxon mobil 4Q 2008 earnings release
Exxon mobil 4Q 2008 earnings releaseExxon mobil 4Q 2008 earnings release
Exxon mobil 4Q 2008 earnings release
 
Chevron Q4 2008 earnings release
Chevron Q4 2008 earnings releaseChevron Q4 2008 earnings release
Chevron Q4 2008 earnings release
 
Horizon Lines Fourth Quarter 2008 Earnings Release
Horizon Lines Fourth Quarter 2008 Earnings ReleaseHorizon Lines Fourth Quarter 2008 Earnings Release
Horizon Lines Fourth Quarter 2008 Earnings Release
 
Sony Q3 2008 financial results
Sony Q3 2008 financial resultsSony Q3 2008 financial results
Sony Q3 2008 financial results
 
Peugeot Q3 2008 financial results
Peugeot Q3 2008 financial resultsPeugeot Q3 2008 financial results
Peugeot Q3 2008 financial results
 
Peugeot Financial Results for the 1st half of 2008
Peugeot  Financial Results for the 1st half of 2008Peugeot  Financial Results for the 1st half of 2008
Peugeot Financial Results for the 1st half of 2008
 
Tesco Q3 fianancial results
Tesco Q3 fianancial resultsTesco Q3 fianancial results
Tesco Q3 fianancial results
 
tesco Annual Report and Financial Statements 2008
tesco Annual Report and Financial Statements 2008tesco Annual Report and Financial Statements 2008
tesco Annual Report and Financial Statements 2008
 

Recently uploaded

Lundin Gold April 2024 Corporate Presentation v4.pdf
Lundin Gold April 2024 Corporate Presentation v4.pdfLundin Gold April 2024 Corporate Presentation v4.pdf
Lundin Gold April 2024 Corporate Presentation v4.pdfAdnet Communications
 
call girls in Nand Nagri (DELHI) 🔝 >༒9953330565🔝 genuine Escort Service 🔝✔️✔️
call girls in  Nand Nagri (DELHI) 🔝 >༒9953330565🔝 genuine Escort Service 🔝✔️✔️call girls in  Nand Nagri (DELHI) 🔝 >༒9953330565🔝 genuine Escort Service 🔝✔️✔️
call girls in Nand Nagri (DELHI) 🔝 >༒9953330565🔝 genuine Escort Service 🔝✔️✔️9953056974 Low Rate Call Girls In Saket, Delhi NCR
 
OAT_RI_Ep19 WeighingTheRisks_Apr24_TheYellowMetal.pptx
OAT_RI_Ep19 WeighingTheRisks_Apr24_TheYellowMetal.pptxOAT_RI_Ep19 WeighingTheRisks_Apr24_TheYellowMetal.pptx
OAT_RI_Ep19 WeighingTheRisks_Apr24_TheYellowMetal.pptxhiddenlevers
 
Dharavi Russian callg Girls, { 09892124323 } || Call Girl In Mumbai ...
Dharavi Russian callg Girls, { 09892124323 } || Call Girl In Mumbai ...Dharavi Russian callg Girls, { 09892124323 } || Call Girl In Mumbai ...
Dharavi Russian callg Girls, { 09892124323 } || Call Girl In Mumbai ...Pooja Nehwal
 
(ANIKA) Budhwar Peth Call Girls Just Call 7001035870 [ Cash on Delivery ] Pun...
(ANIKA) Budhwar Peth Call Girls Just Call 7001035870 [ Cash on Delivery ] Pun...(ANIKA) Budhwar Peth Call Girls Just Call 7001035870 [ Cash on Delivery ] Pun...
(ANIKA) Budhwar Peth Call Girls Just Call 7001035870 [ Cash on Delivery ] Pun...ranjana rawat
 
VIP Kolkata Call Girl Jodhpur Park 👉 8250192130 Available With Room
VIP Kolkata Call Girl Jodhpur Park 👉 8250192130  Available With RoomVIP Kolkata Call Girl Jodhpur Park 👉 8250192130  Available With Room
VIP Kolkata Call Girl Jodhpur Park 👉 8250192130 Available With Roomdivyansh0kumar0
 
VIP Call Girls LB Nagar ( Hyderabad ) Phone 8250192130 | ₹5k To 25k With Room...
VIP Call Girls LB Nagar ( Hyderabad ) Phone 8250192130 | ₹5k To 25k With Room...VIP Call Girls LB Nagar ( Hyderabad ) Phone 8250192130 | ₹5k To 25k With Room...
VIP Call Girls LB Nagar ( Hyderabad ) Phone 8250192130 | ₹5k To 25k With Room...Suhani Kapoor
 
High Class Call Girls Nashik Maya 7001305949 Independent Escort Service Nashik
High Class Call Girls Nashik Maya 7001305949 Independent Escort Service NashikHigh Class Call Girls Nashik Maya 7001305949 Independent Escort Service Nashik
High Class Call Girls Nashik Maya 7001305949 Independent Escort Service NashikCall Girls in Nagpur High Profile
 
Instant Issue Debit Cards - High School Spirit
Instant Issue Debit Cards - High School SpiritInstant Issue Debit Cards - High School Spirit
Instant Issue Debit Cards - High School Spiritegoetzinger
 
Bladex Earnings Call Presentation 1Q2024
Bladex Earnings Call Presentation 1Q2024Bladex Earnings Call Presentation 1Q2024
Bladex Earnings Call Presentation 1Q2024Bladex
 
High Class Call Girls Nagpur Grishma Call 7001035870 Meet With Nagpur Escorts
High Class Call Girls Nagpur Grishma Call 7001035870 Meet With Nagpur EscortsHigh Class Call Girls Nagpur Grishma Call 7001035870 Meet With Nagpur Escorts
High Class Call Girls Nagpur Grishma Call 7001035870 Meet With Nagpur Escortsranjana rawat
 
Best VIP Call Girls Noida Sector 18 Call Me: 8448380779
Best VIP Call Girls Noida Sector 18 Call Me: 8448380779Best VIP Call Girls Noida Sector 18 Call Me: 8448380779
Best VIP Call Girls Noida Sector 18 Call Me: 8448380779Delhi Call girls
 
(TANVI) Call Girls Nanded City ( 7001035870 ) HI-Fi Pune Escorts Service
(TANVI) Call Girls Nanded City ( 7001035870 ) HI-Fi Pune Escorts Service(TANVI) Call Girls Nanded City ( 7001035870 ) HI-Fi Pune Escorts Service
(TANVI) Call Girls Nanded City ( 7001035870 ) HI-Fi Pune Escorts Serviceranjana rawat
 
Chapter 2.ppt of macroeconomics by mankiw 9th edition
Chapter 2.ppt of macroeconomics by mankiw 9th editionChapter 2.ppt of macroeconomics by mankiw 9th edition
Chapter 2.ppt of macroeconomics by mankiw 9th editionMuhammadHusnain82237
 
20240417-Calibre-April-2024-Investor-Presentation.pdf
20240417-Calibre-April-2024-Investor-Presentation.pdf20240417-Calibre-April-2024-Investor-Presentation.pdf
20240417-Calibre-April-2024-Investor-Presentation.pdfAdnet Communications
 
Quantitative Analysis of Retail Sector Companies
Quantitative Analysis of Retail Sector CompaniesQuantitative Analysis of Retail Sector Companies
Quantitative Analysis of Retail Sector Companiesprashantbhati354
 
Quarter 4- Module 3 Principles of Marketing
Quarter 4- Module 3 Principles of MarketingQuarter 4- Module 3 Principles of Marketing
Quarter 4- Module 3 Principles of MarketingMaristelaRamos12
 
Dividend Policy and Dividend Decision Theories.pptx
Dividend Policy and Dividend Decision Theories.pptxDividend Policy and Dividend Decision Theories.pptx
Dividend Policy and Dividend Decision Theories.pptxanshikagoel52
 
Russian Call Girls In Gtb Nagar (Delhi) 9711199012 💋✔💕😘 Naughty Call Girls Se...
Russian Call Girls In Gtb Nagar (Delhi) 9711199012 💋✔💕😘 Naughty Call Girls Se...Russian Call Girls In Gtb Nagar (Delhi) 9711199012 💋✔💕😘 Naughty Call Girls Se...
Russian Call Girls In Gtb Nagar (Delhi) 9711199012 💋✔💕😘 Naughty Call Girls Se...shivangimorya083
 

Recently uploaded (20)

Lundin Gold April 2024 Corporate Presentation v4.pdf
Lundin Gold April 2024 Corporate Presentation v4.pdfLundin Gold April 2024 Corporate Presentation v4.pdf
Lundin Gold April 2024 Corporate Presentation v4.pdf
 
call girls in Nand Nagri (DELHI) 🔝 >༒9953330565🔝 genuine Escort Service 🔝✔️✔️
call girls in  Nand Nagri (DELHI) 🔝 >༒9953330565🔝 genuine Escort Service 🔝✔️✔️call girls in  Nand Nagri (DELHI) 🔝 >༒9953330565🔝 genuine Escort Service 🔝✔️✔️
call girls in Nand Nagri (DELHI) 🔝 >༒9953330565🔝 genuine Escort Service 🔝✔️✔️
 
OAT_RI_Ep19 WeighingTheRisks_Apr24_TheYellowMetal.pptx
OAT_RI_Ep19 WeighingTheRisks_Apr24_TheYellowMetal.pptxOAT_RI_Ep19 WeighingTheRisks_Apr24_TheYellowMetal.pptx
OAT_RI_Ep19 WeighingTheRisks_Apr24_TheYellowMetal.pptx
 
Dharavi Russian callg Girls, { 09892124323 } || Call Girl In Mumbai ...
Dharavi Russian callg Girls, { 09892124323 } || Call Girl In Mumbai ...Dharavi Russian callg Girls, { 09892124323 } || Call Girl In Mumbai ...
Dharavi Russian callg Girls, { 09892124323 } || Call Girl In Mumbai ...
 
(ANIKA) Budhwar Peth Call Girls Just Call 7001035870 [ Cash on Delivery ] Pun...
(ANIKA) Budhwar Peth Call Girls Just Call 7001035870 [ Cash on Delivery ] Pun...(ANIKA) Budhwar Peth Call Girls Just Call 7001035870 [ Cash on Delivery ] Pun...
(ANIKA) Budhwar Peth Call Girls Just Call 7001035870 [ Cash on Delivery ] Pun...
 
VIP Kolkata Call Girl Jodhpur Park 👉 8250192130 Available With Room
VIP Kolkata Call Girl Jodhpur Park 👉 8250192130  Available With RoomVIP Kolkata Call Girl Jodhpur Park 👉 8250192130  Available With Room
VIP Kolkata Call Girl Jodhpur Park 👉 8250192130 Available With Room
 
VIP Call Girls LB Nagar ( Hyderabad ) Phone 8250192130 | ₹5k To 25k With Room...
VIP Call Girls LB Nagar ( Hyderabad ) Phone 8250192130 | ₹5k To 25k With Room...VIP Call Girls LB Nagar ( Hyderabad ) Phone 8250192130 | ₹5k To 25k With Room...
VIP Call Girls LB Nagar ( Hyderabad ) Phone 8250192130 | ₹5k To 25k With Room...
 
High Class Call Girls Nashik Maya 7001305949 Independent Escort Service Nashik
High Class Call Girls Nashik Maya 7001305949 Independent Escort Service NashikHigh Class Call Girls Nashik Maya 7001305949 Independent Escort Service Nashik
High Class Call Girls Nashik Maya 7001305949 Independent Escort Service Nashik
 
Instant Issue Debit Cards - High School Spirit
Instant Issue Debit Cards - High School SpiritInstant Issue Debit Cards - High School Spirit
Instant Issue Debit Cards - High School Spirit
 
Bladex Earnings Call Presentation 1Q2024
Bladex Earnings Call Presentation 1Q2024Bladex Earnings Call Presentation 1Q2024
Bladex Earnings Call Presentation 1Q2024
 
High Class Call Girls Nagpur Grishma Call 7001035870 Meet With Nagpur Escorts
High Class Call Girls Nagpur Grishma Call 7001035870 Meet With Nagpur EscortsHigh Class Call Girls Nagpur Grishma Call 7001035870 Meet With Nagpur Escorts
High Class Call Girls Nagpur Grishma Call 7001035870 Meet With Nagpur Escorts
 
Best VIP Call Girls Noida Sector 18 Call Me: 8448380779
Best VIP Call Girls Noida Sector 18 Call Me: 8448380779Best VIP Call Girls Noida Sector 18 Call Me: 8448380779
Best VIP Call Girls Noida Sector 18 Call Me: 8448380779
 
(TANVI) Call Girls Nanded City ( 7001035870 ) HI-Fi Pune Escorts Service
(TANVI) Call Girls Nanded City ( 7001035870 ) HI-Fi Pune Escorts Service(TANVI) Call Girls Nanded City ( 7001035870 ) HI-Fi Pune Escorts Service
(TANVI) Call Girls Nanded City ( 7001035870 ) HI-Fi Pune Escorts Service
 
Chapter 2.ppt of macroeconomics by mankiw 9th edition
Chapter 2.ppt of macroeconomics by mankiw 9th editionChapter 2.ppt of macroeconomics by mankiw 9th edition
Chapter 2.ppt of macroeconomics by mankiw 9th edition
 
20240417-Calibre-April-2024-Investor-Presentation.pdf
20240417-Calibre-April-2024-Investor-Presentation.pdf20240417-Calibre-April-2024-Investor-Presentation.pdf
20240417-Calibre-April-2024-Investor-Presentation.pdf
 
Quantitative Analysis of Retail Sector Companies
Quantitative Analysis of Retail Sector CompaniesQuantitative Analysis of Retail Sector Companies
Quantitative Analysis of Retail Sector Companies
 
Quarter 4- Module 3 Principles of Marketing
Quarter 4- Module 3 Principles of MarketingQuarter 4- Module 3 Principles of Marketing
Quarter 4- Module 3 Principles of Marketing
 
Dividend Policy and Dividend Decision Theories.pptx
Dividend Policy and Dividend Decision Theories.pptxDividend Policy and Dividend Decision Theories.pptx
Dividend Policy and Dividend Decision Theories.pptx
 
Russian Call Girls In Gtb Nagar (Delhi) 9711199012 💋✔💕😘 Naughty Call Girls Se...
Russian Call Girls In Gtb Nagar (Delhi) 9711199012 💋✔💕😘 Naughty Call Girls Se...Russian Call Girls In Gtb Nagar (Delhi) 9711199012 💋✔💕😘 Naughty Call Girls Se...
Russian Call Girls In Gtb Nagar (Delhi) 9711199012 💋✔💕😘 Naughty Call Girls Se...
 
🔝+919953056974 🔝young Delhi Escort service Pusa Road
🔝+919953056974 🔝young Delhi Escort service Pusa Road🔝+919953056974 🔝young Delhi Escort service Pusa Road
🔝+919953056974 🔝young Delhi Escort service Pusa Road
 

AMD Reports Q4 and FY 2007 Financial Results

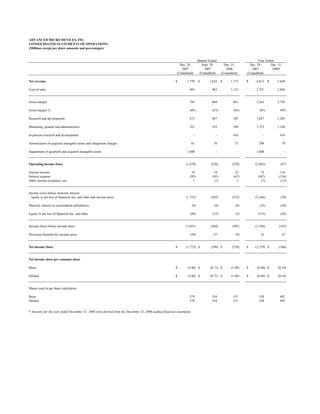
  • 1. ADVANCED MICRO DEVICES, INC. CONSOLIDATED STATEMENTS OF OPERATIONS (Millions except per share amounts and percentages) Quarter Ended Year Ended Dec. 29, Sept. 29, Dec. 31, Dec. 29, Dec. 31, 2007 2007 2006 2007 2006* (Unaudited) (Unaudited) (Unaudited) (Unaudited) Net revenue $ 1,770 $ 1,632 $ 1,773 $ 6,013 $ 5,649 Cost of sales 985 963 1,132 3,751 2,856 Gross margin 785 669 641 2,262 2,793 Gross margin % 44% 41% 36% 38% 49% Research and development 473 467 385 1,847 1,205 Marketing, general and administrative 321 352 296 1,373 1,140 In-process research and development - - 416 - 416 Amortization of acquired intangible assets and integration charges 61 76 73 299 79 Impairment of goodwill and acquired intangible assets 1,608 - - 1,608 - Operating income (loss) (1,678) (226) (529) (2,865) (47) Interest income 19 19 22 73 116 Interest expense (95) (95) (67) (367) (126) Other income (expense), net 1 (1) 2 (7) (13) Income (loss) before minority interest, equity in net loss of Spansion Inc. and other and income taxes (1,753) (303) (572) (3,166) (70) Minority interest in consolidated subsidiaries (9) (9) (8) (35) (28) Equity in net loss of Spansion Inc. and other (69) (57) (5) (155) (45) Income (loss) before income taxes (1,831) (369) (585) (3,356) (143) Provision (benefit) for income taxes (59) 27 (9) 23 23 Net income (loss) $ (1,772) $ (396) $ (576) $ (3,379) $ (166) Net income (loss) per common share Basic $ (3.06) $ (0.71) $ (1.08) $ (6.06) $ (0.34) Diluted $ (3.06) $ (0.71) $ (1.08) $ (6.06) $ (0.34) Shares used in per share calculation Basic 579 554 531 558 492 Diluted 579 554 531 558 492 * Amounts for the year ended December 31, 2006 were derived from the December 31, 2006 audited financial statements.
  • 2. ADVANCED MICRO DEVICES, INC. CONSOLIDATED BALANCE SHEETS (Millions) Dec. 29, Sept. 29, Dec. 31, 2007 2007 2006* (Unaudited) (Unaudited) Assets Current assets: Cash, cash equivalents and marketable securities $ 1,889 $ 1,528 $ 1,541 Accounts receivable, net 640 682 1,140 Inventories 821 839 814 Prepaid expenses and other current assets 402 432 443 Deferred income taxes 64 62 25 Total current assets 3,816 3,543 3,963 Property, plant and equipment, net 4,720 4,725 3,987 Goodwill 1,907 3,165 3,217 Investment in Spansion Inc. - - 371 Acquisition related intangible assets, net 587 994 1,207 Other assets 520 507 402 Total Assets $ 11,550 $ 12,934 $ 13,147 Liabilities and Stockholders' Equity Current liabilities: Accounts payable $ 1,009 $ 1,064 $ 1,338 Accrued compensation and benefits 186 198 177 Accrued liabilities 821 858 769 Deferred income on shipments to distributors 101 106 169 Current portion of long-term debt and capital lease obligations 238 218 125 Other current liabilities 270 283 327 Total current liabilities 2,625 2,727 2,905 Deferred income taxes 6 32 31 Long-term debt and capital lease obligations, less current portion 5,031 5,117 3,672 Other long-term liabilities 633 650 517 Minority interest in consolidated subsidiaries 265 283 237 Stockholders' equity: Capital stock: Common stock, par value 6 6 5 Capital in excess of par value 5,921 5,280 5,316 Retained earnings (deficit) (3,100) (1,328) 308 Accumulated other comprehensive income 163 167 156 Total stockholders' equity 2,990 4,125 5,785 Total Liabilities and Stockholders' Equity $ 11,550 $ 12,934 $ 13,147 * Amounts for the year ended December 31, 2006 were derived from the December 31, 2006 audited financial statements.
  • 3. ADVANCED MICRO DEVICES, INC. SELECTED CORPORATE DATA (Unaudited) (Millions except headcount and percentages) Quarter Ended Year Ended Dec. 29, Sept. 29, Dec. 31, Dec. 29, Dec. 31, Segment Information 2007 2007 2006 2007 2006 Computing Solutions (1) Net revenue $ 1,402 $ 1,283 $ 1,486 $ 4,702 $ 5,367 Operating income (loss) $ 21 $ (112) $ 65 $ (670) $ 680 Graphics (2) Net revenue 259 252 166 903 166 Operating income (loss) (12) (3) (27) (100) (27) Consumer Electronics (3) Net revenue 109 97 120 408 120 Operating income (loss) 12 (3) 20 (17) 20 All Other (4) Net revenue - - 1 - (4) Operating income (loss) (1,699) (108) (587) (2,078) (720) Total AMD Net revenue $ 1,770 $ 1,632 $ 1,773 $ 6,013 $ 5,649 Operating income (loss) $ (1,678) $ (226) $ (529) $ (2,865) $ (47) Other Data Depreciation & amortization (excluding amortization of acquired intangible assets) $ 273 $ 263 $ 224 $ 1,034 $ 791 Capital additions $ 267 $ 419 $ 666 $ 1,686 $ 1,856 Headcount 16,420 16,498 16,464 16,420 16,464 Adjusted EBITDA (5) $ 203 $ 60 $ 169 $ (76) $ 1,237 (1) Computing Solutions segment includes what was formerly the Computation Products segment and the Embedded Products segment as well as revenue from sales of ATI chipsets. (2) Graphics segment includes graphics, video and multimedia products developed for use in desktop and notebook computers, including home media PCs, professional workstations and servers. (3) Consumer Electronics segment includes products for and revenue related to mobile phones and PDAs, digital televisions and other consumer electronics and royalties received in connection with the sale of game console systems that incorporate the Company’s technology. (4) All Other category includes employee stock-based compensation expense, profit sharing expense, certain operating expenses and credits that are not allocated to the operating segments, and Personal Internet Communicator (PIC) related activities in 2006. Also included in this category are the ATI acquisition-related and severance charges. Details of the ATI acquisition-related and severance charges and employee stock-based compensation expense are shown below. ATI acquisition-related and severance charges: Employee stock-based compensation expense: Quarter Ended Year Ended Quarter Ended Year Ended Q407 Q307 Q406 FY07 FY06 Q407 Q307 Q406 FY07 FY06 Amortization of acquired intangible assets $ 58 $ 71 $ 47 $ 271 $ 47 $ 3$ 2$2 $ 9$ 8 Cost of sales 3 5 26 28 32 Research and development 12 14 13 54 30 Integration charges $ 61 $ 76 $ 73 $ 299 $ 79 Marketing, general and administrative 11 11 12 49 39 Subtotal 1,608 - - 1,608 - Impairment of goodwill and acquired intangible assets $ 26 $ 27 $ 27 $ 112 $ 77 In-process research and development - - 416 - 416 - - 62 29 62 Cost of fair value adjustment of acquired inventory $ 1,669 $ 76 $ 551 $ 1,936 $ 557 ATI acquisition-related charges - 2 - 18 - Severance $ 1,669 $ 78 $ 551 $ 1,954 $ 557 Total ATI acquisition-related and severance charges (5) Reconciliation of Net income (loss) to Adjusted EBITDA* Quarter Ended Year Ended Q407 Q307 Q406 FY07 FY06 Net income (loss) $ (1,772) $ (396) $ (576) $ (3,379) $ (166) Depreciation and amortization 273 263 224 1,034 791 In-process research and development - - 416 - 416 Amortization of acquired intangible assets 58 71 47 271 47 Impairment of goodwill and acquired intangible assets 1,608 - - 1,608 - Interest expense 95 95 67 367 126 Provision (benefit) for income taxes (59) 27 (9) 23 23 Adjusted EBITDA $ 203 $ 60 $ 169 $ (76) $ 1,237 * The Company defines Adjusted EBITDA as net income (loss) adjusted for depreciation and amortization, in-process research and development, amortization of acquired intangible assets, impairment of goodwill and acquired intangib assets, interest expense and taxes. The Company calculated and communicated Adjusted EBITDA because management believes it is of interest to investors and lenders in relation to its overall capital structure and its ability to borrow additional funds. The Company’s calculation of Adjusted EBITDA may or may not be consistent with the calculation of this measure by other companies in the same industry. Investors should not view Adjusted EBITDA as an alternative to the U.S. GAAP operating measure of net income or U.S. GAAP liquidity measures of cash flows from operating, investing and financing activities. In addition, Adjusted EBITDA does not take into account changes in certain assets and liabilities as well as interest and income taxes that can affect cash flows.