Download as PDF, PPTX


![USEFUL TOOLS
Sets $_COOKIE['_profile'] to 1
XHProf Helper for Chrome
XHProf Helper for Firefox](https://image.slidesharecdn.com/slides-150312043143-conversion-gate01/75/Profiling-PHP-WordPress-Meetup-Nijmegen-2015-03-11-41-2048.jpg)
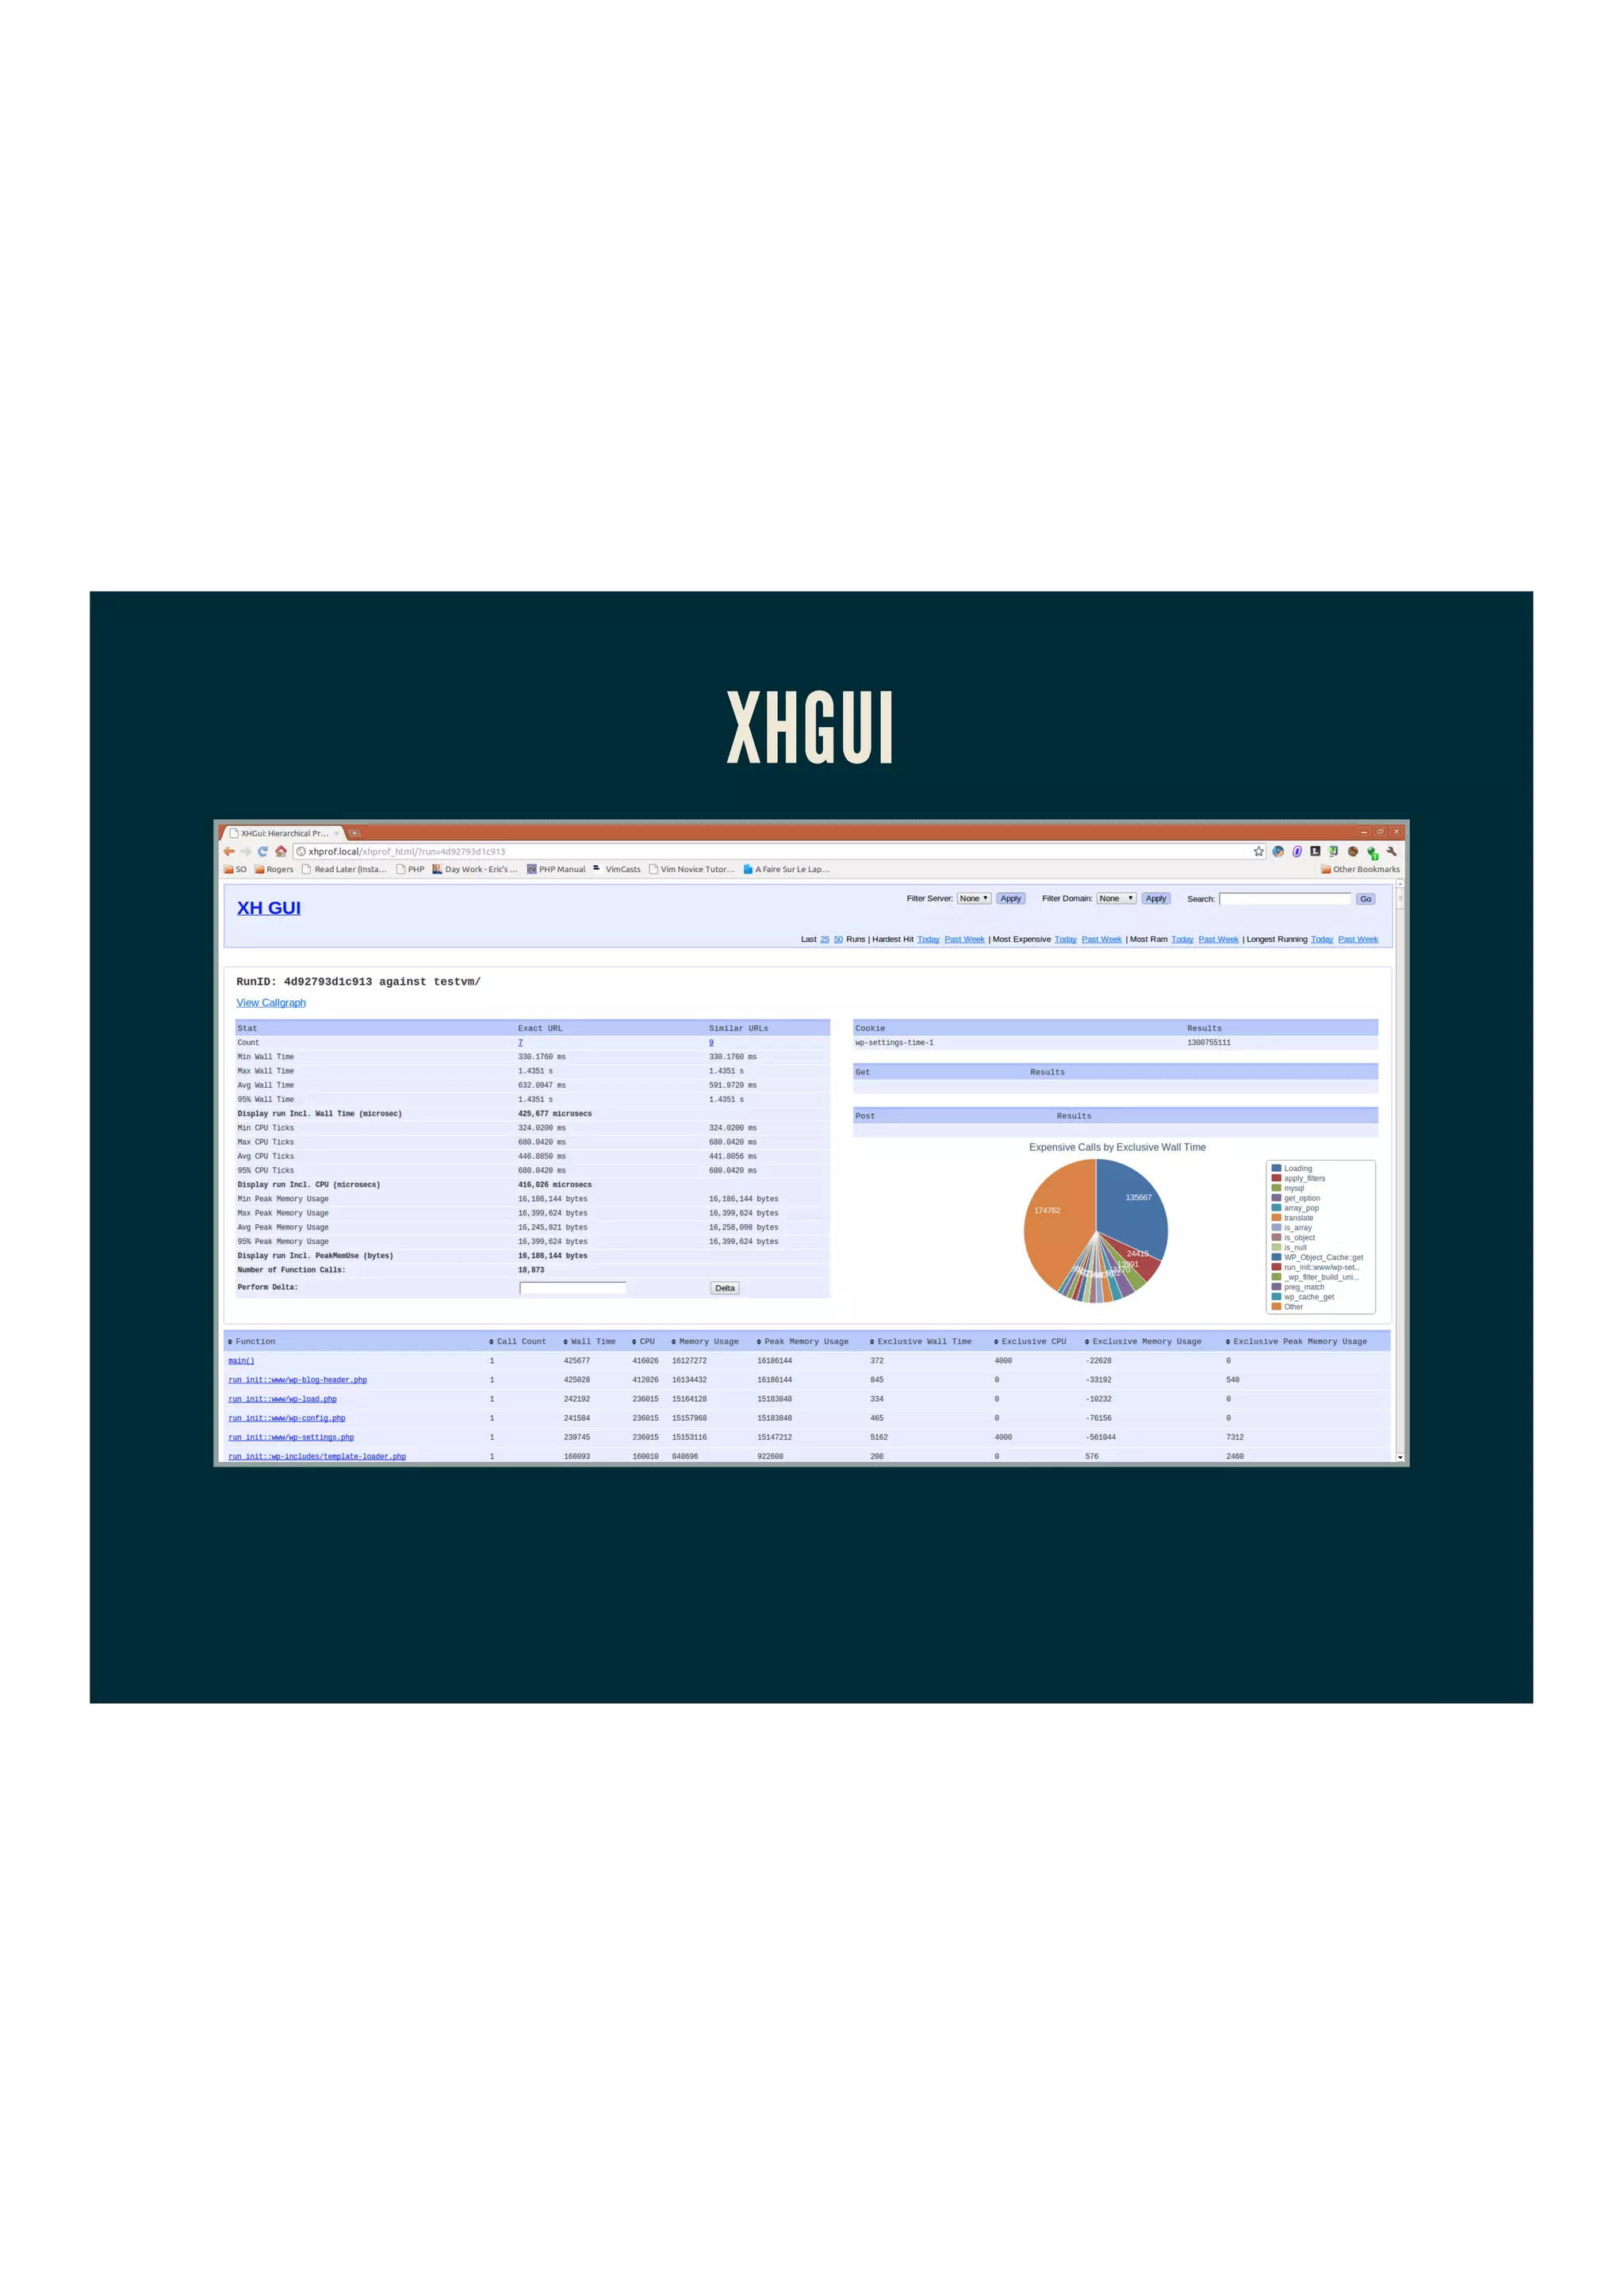
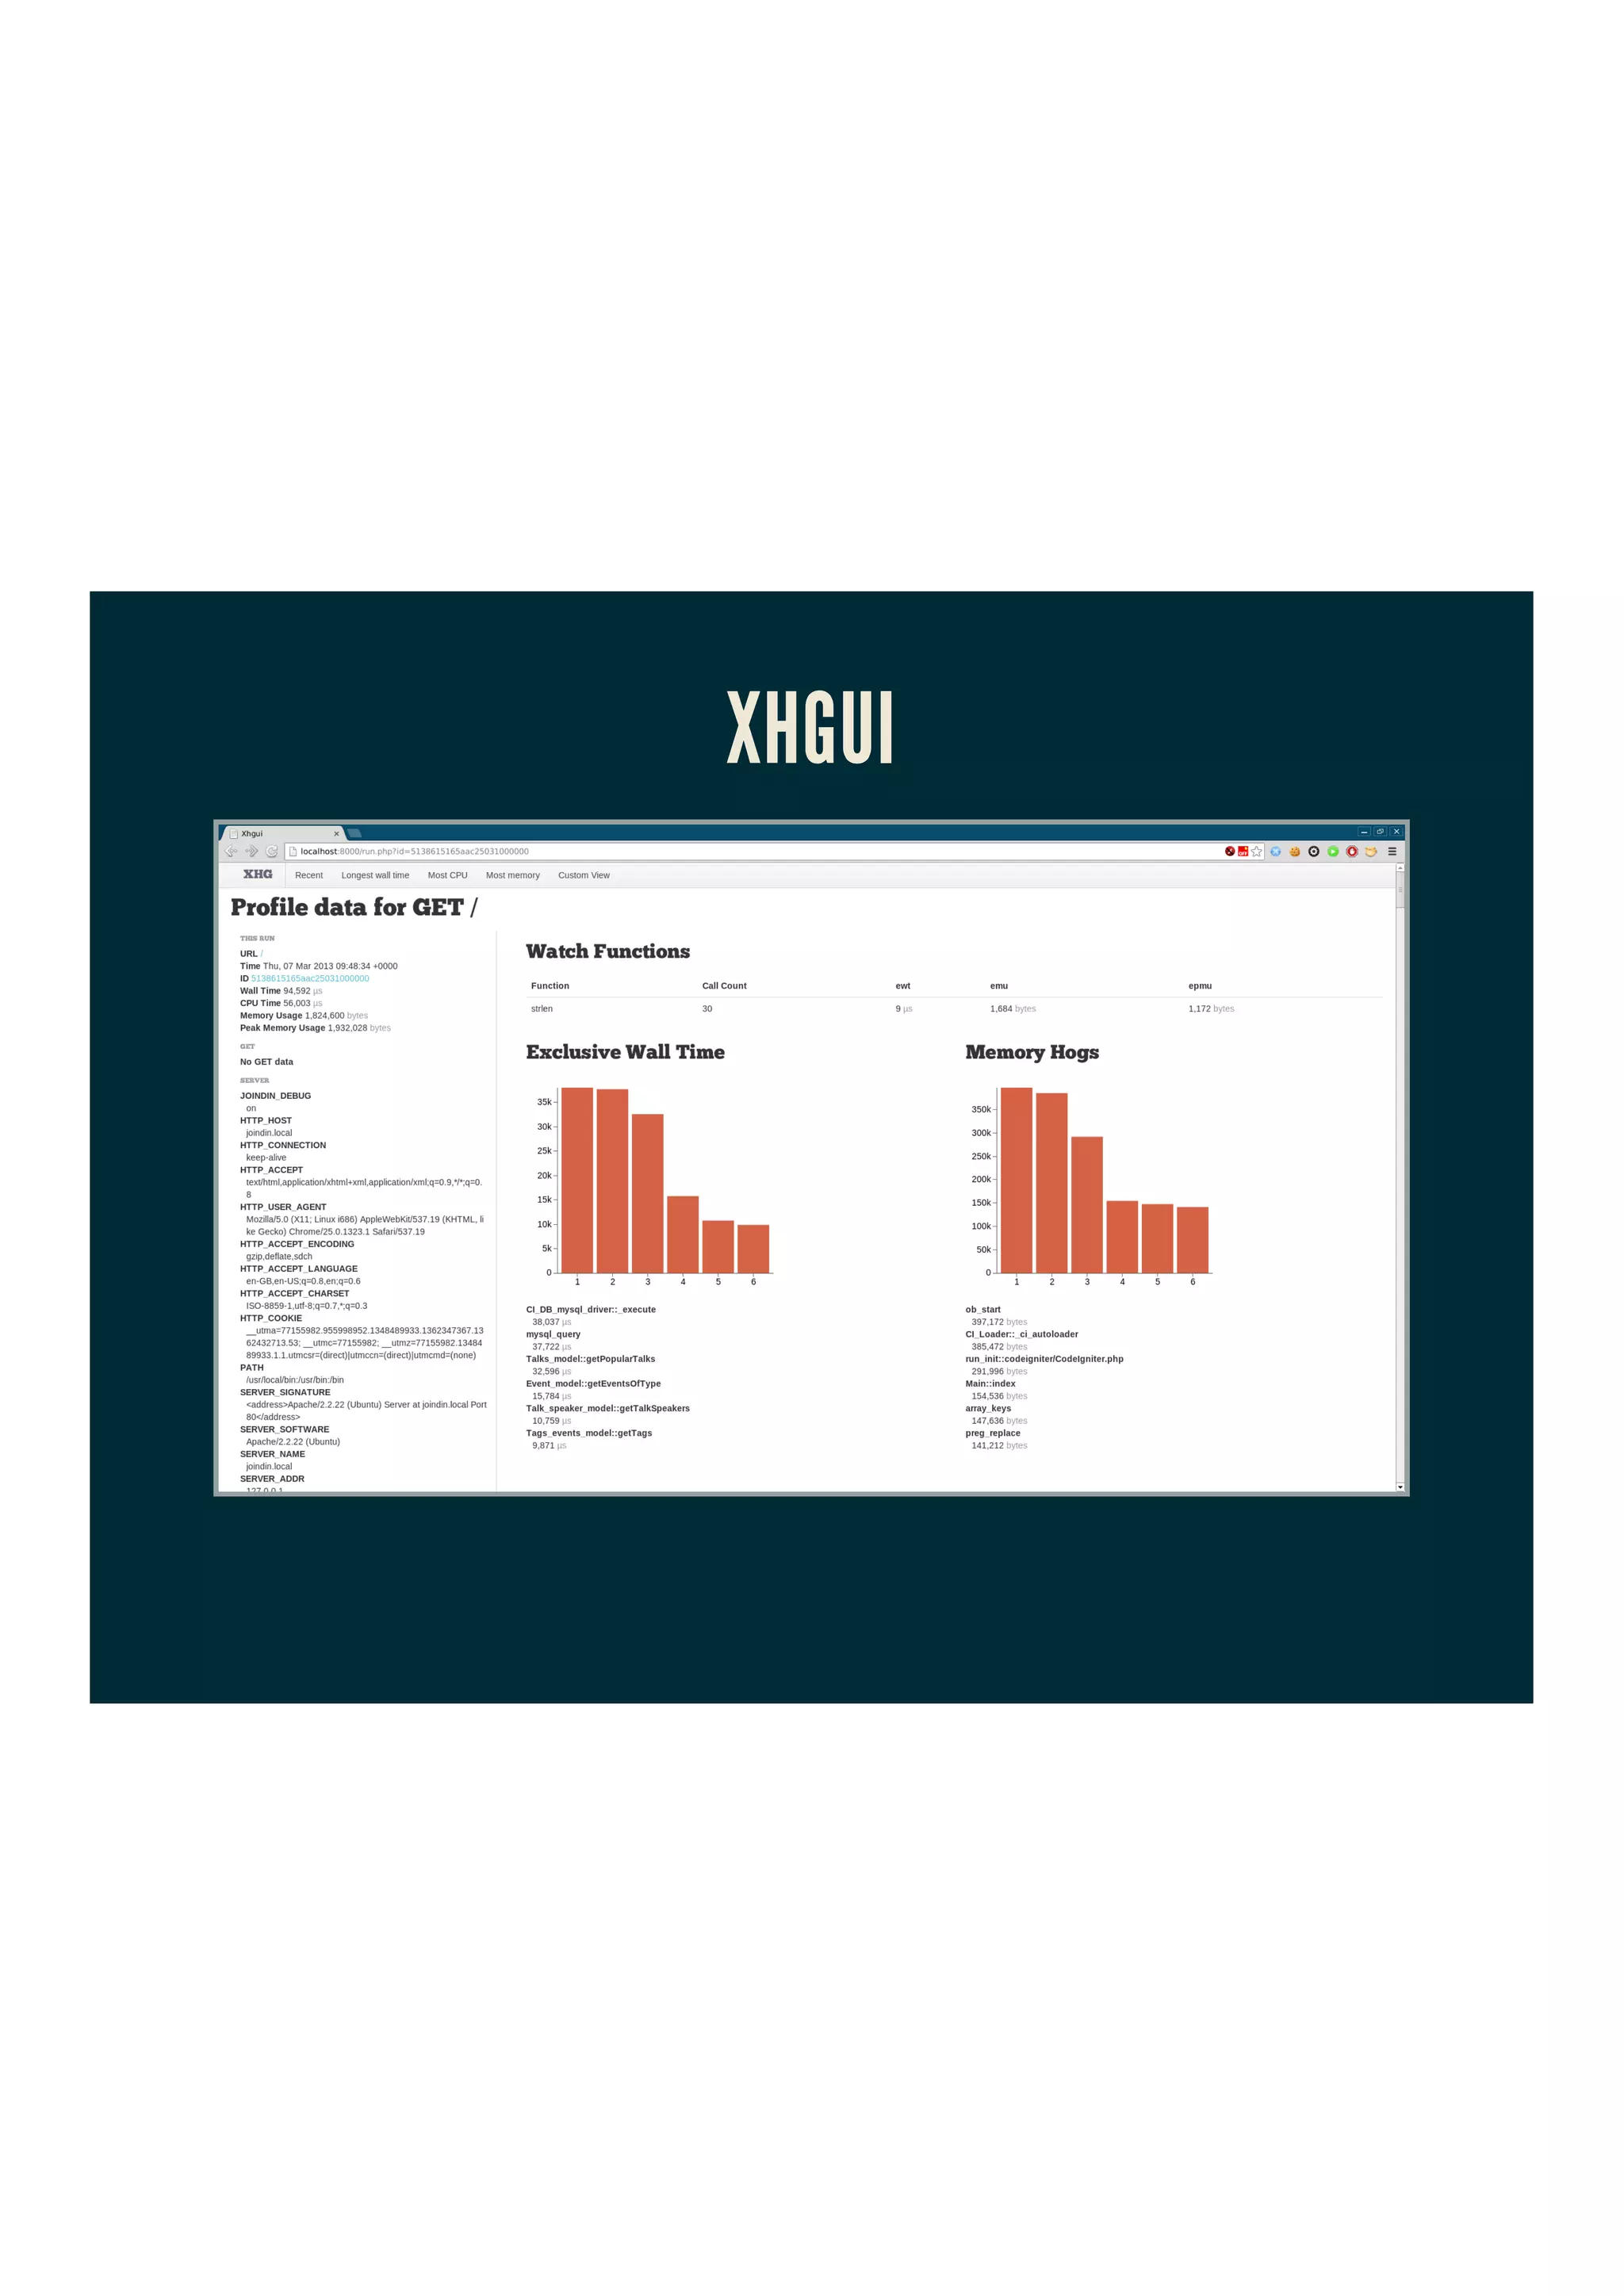
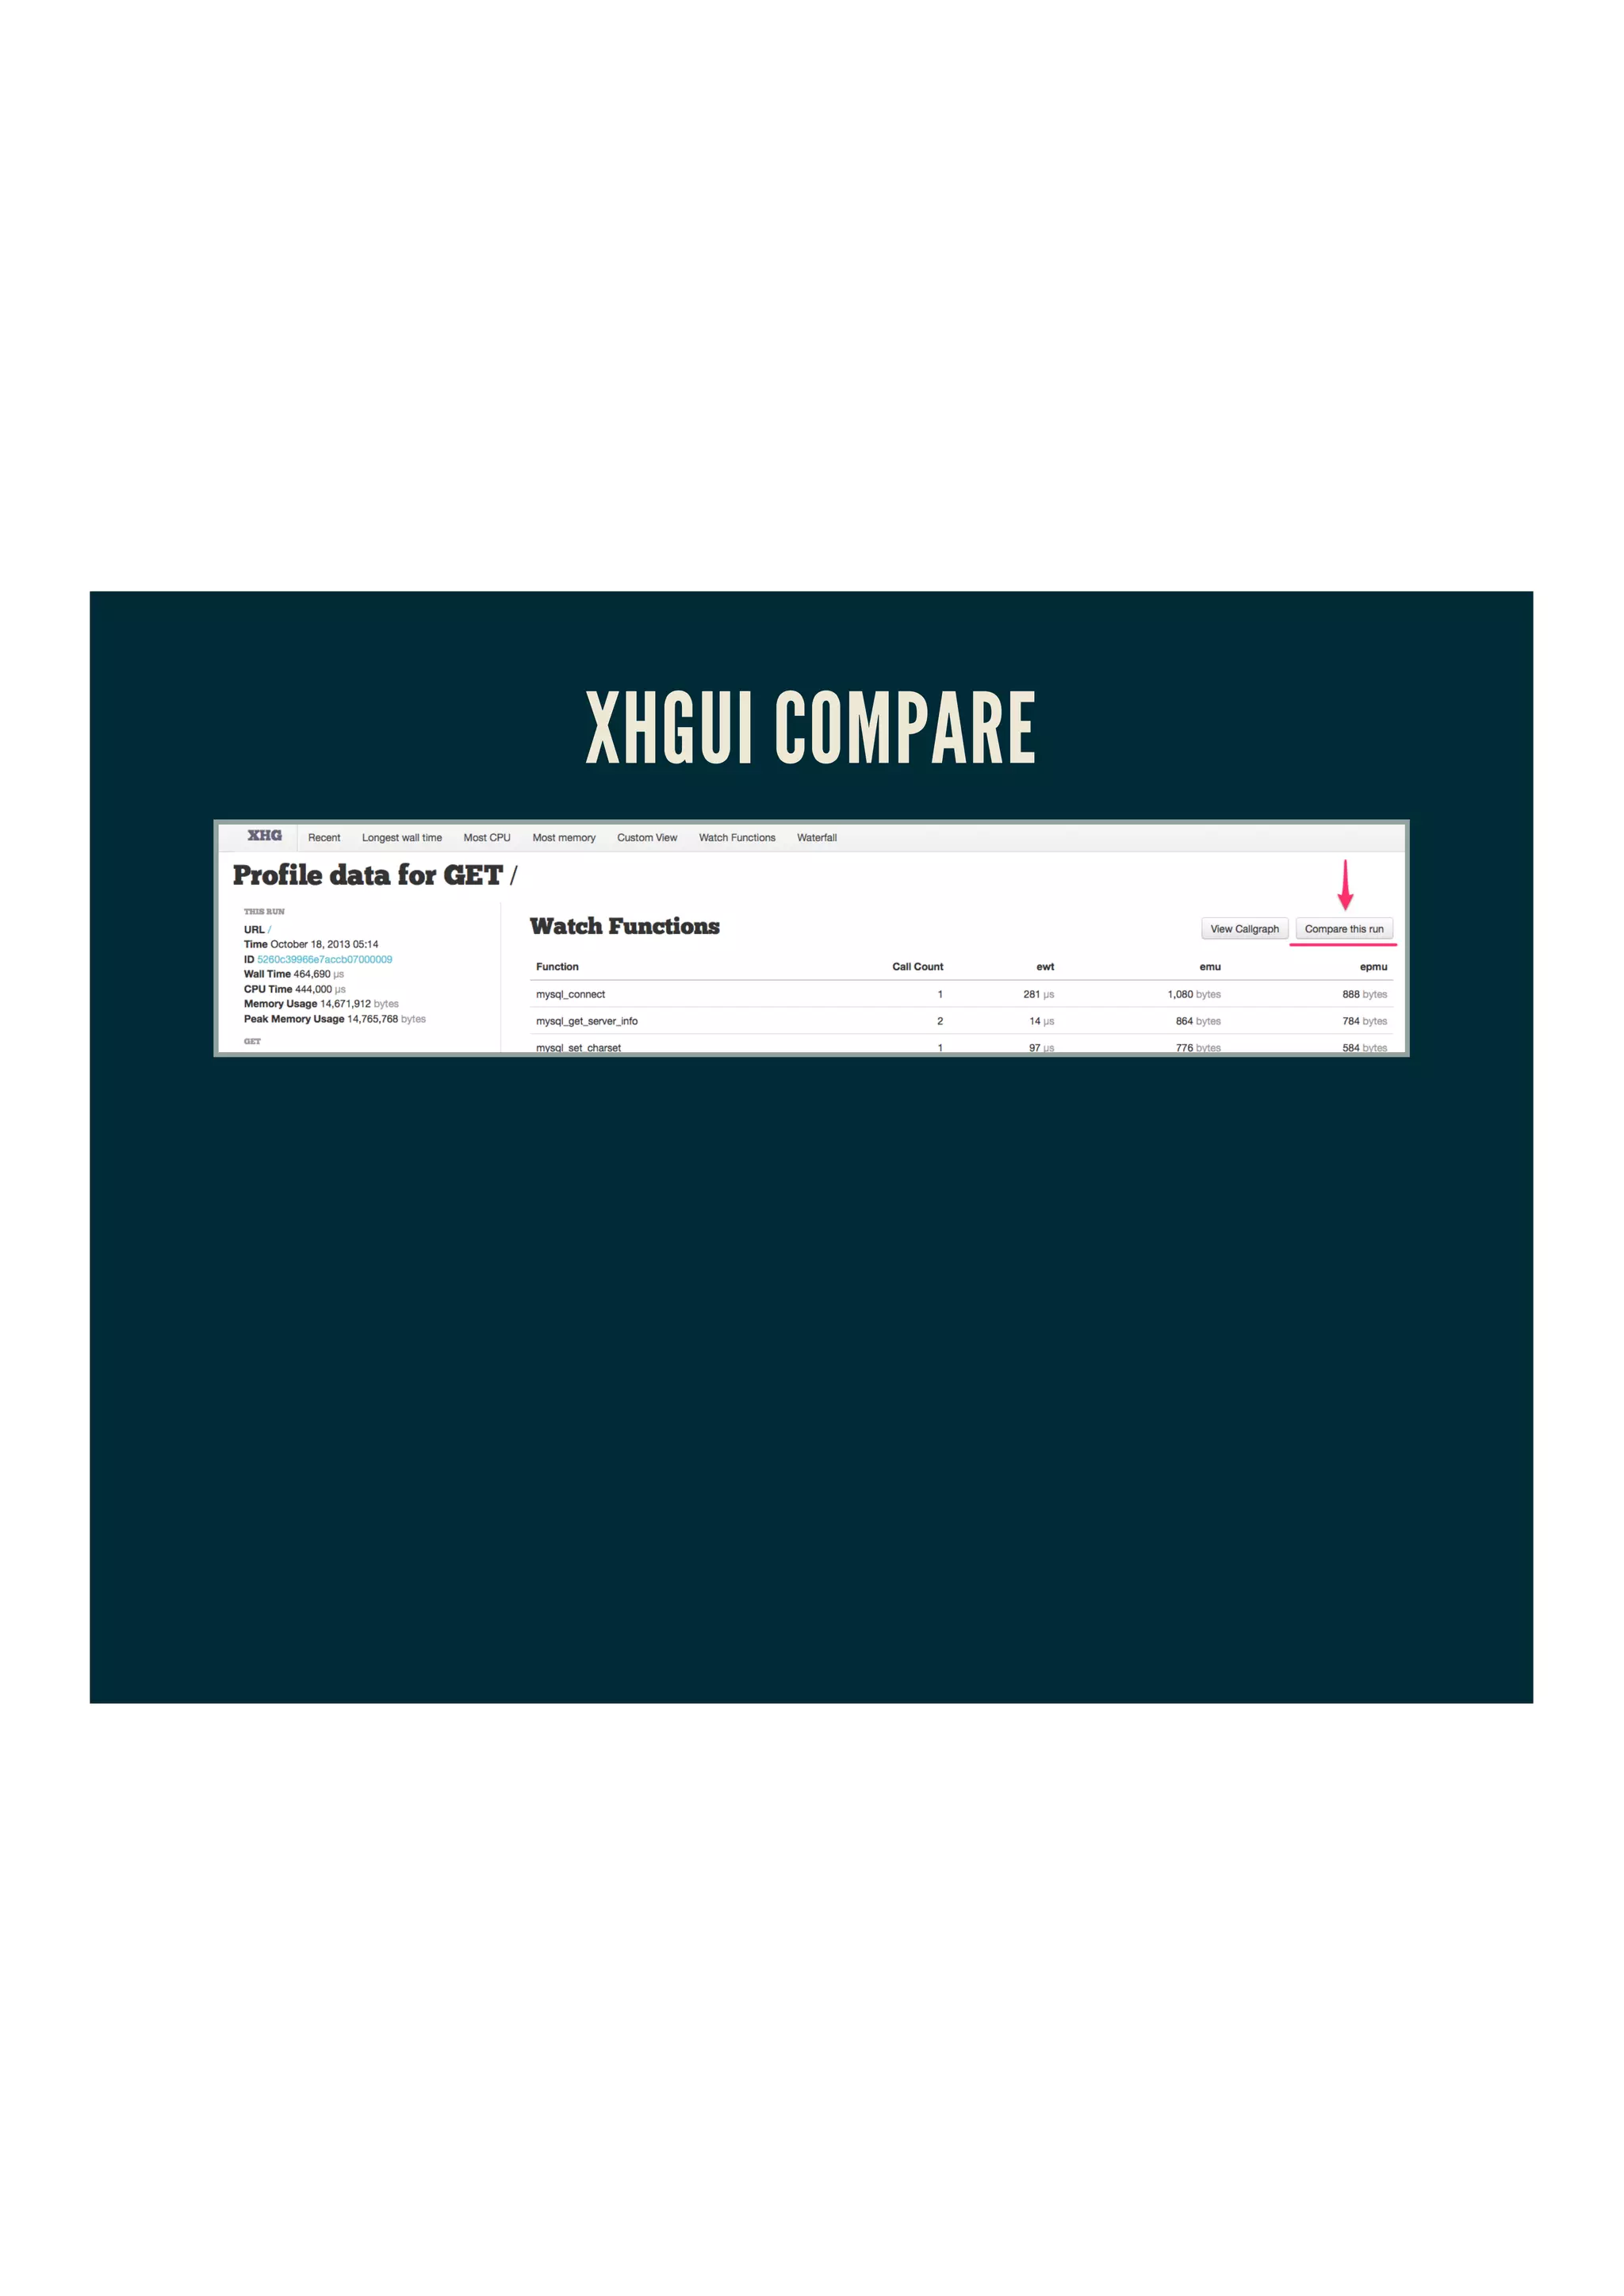
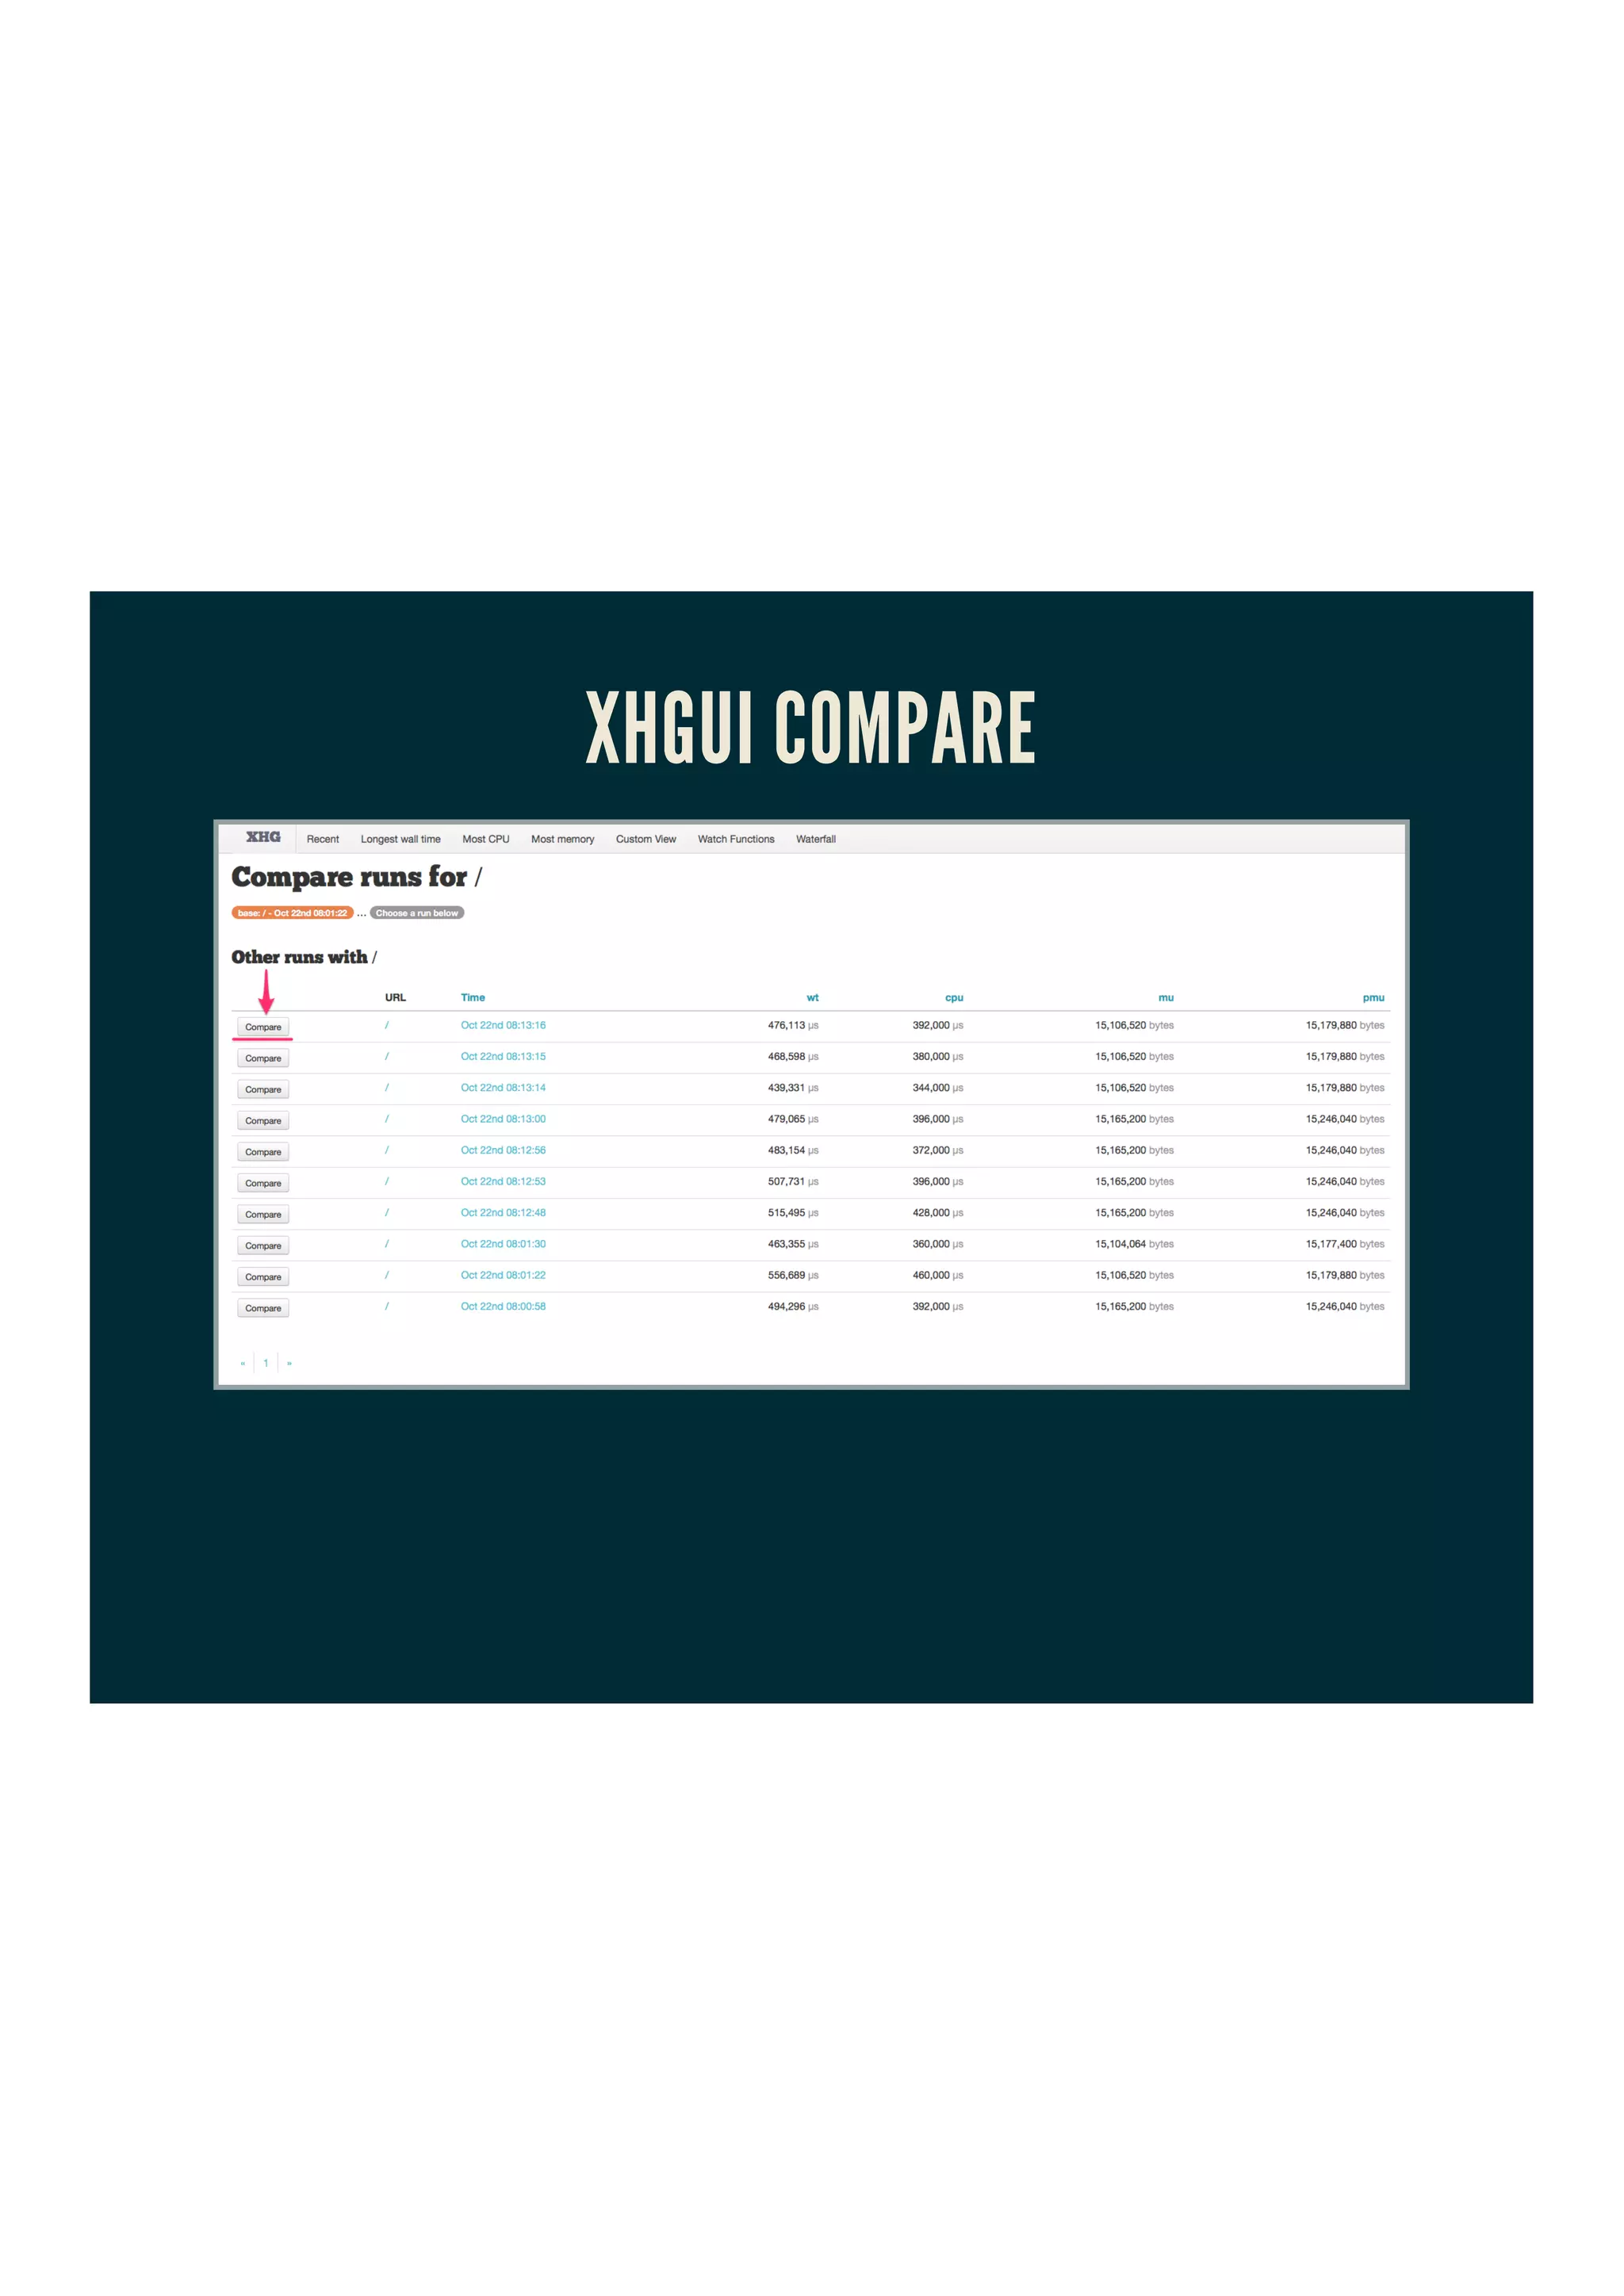
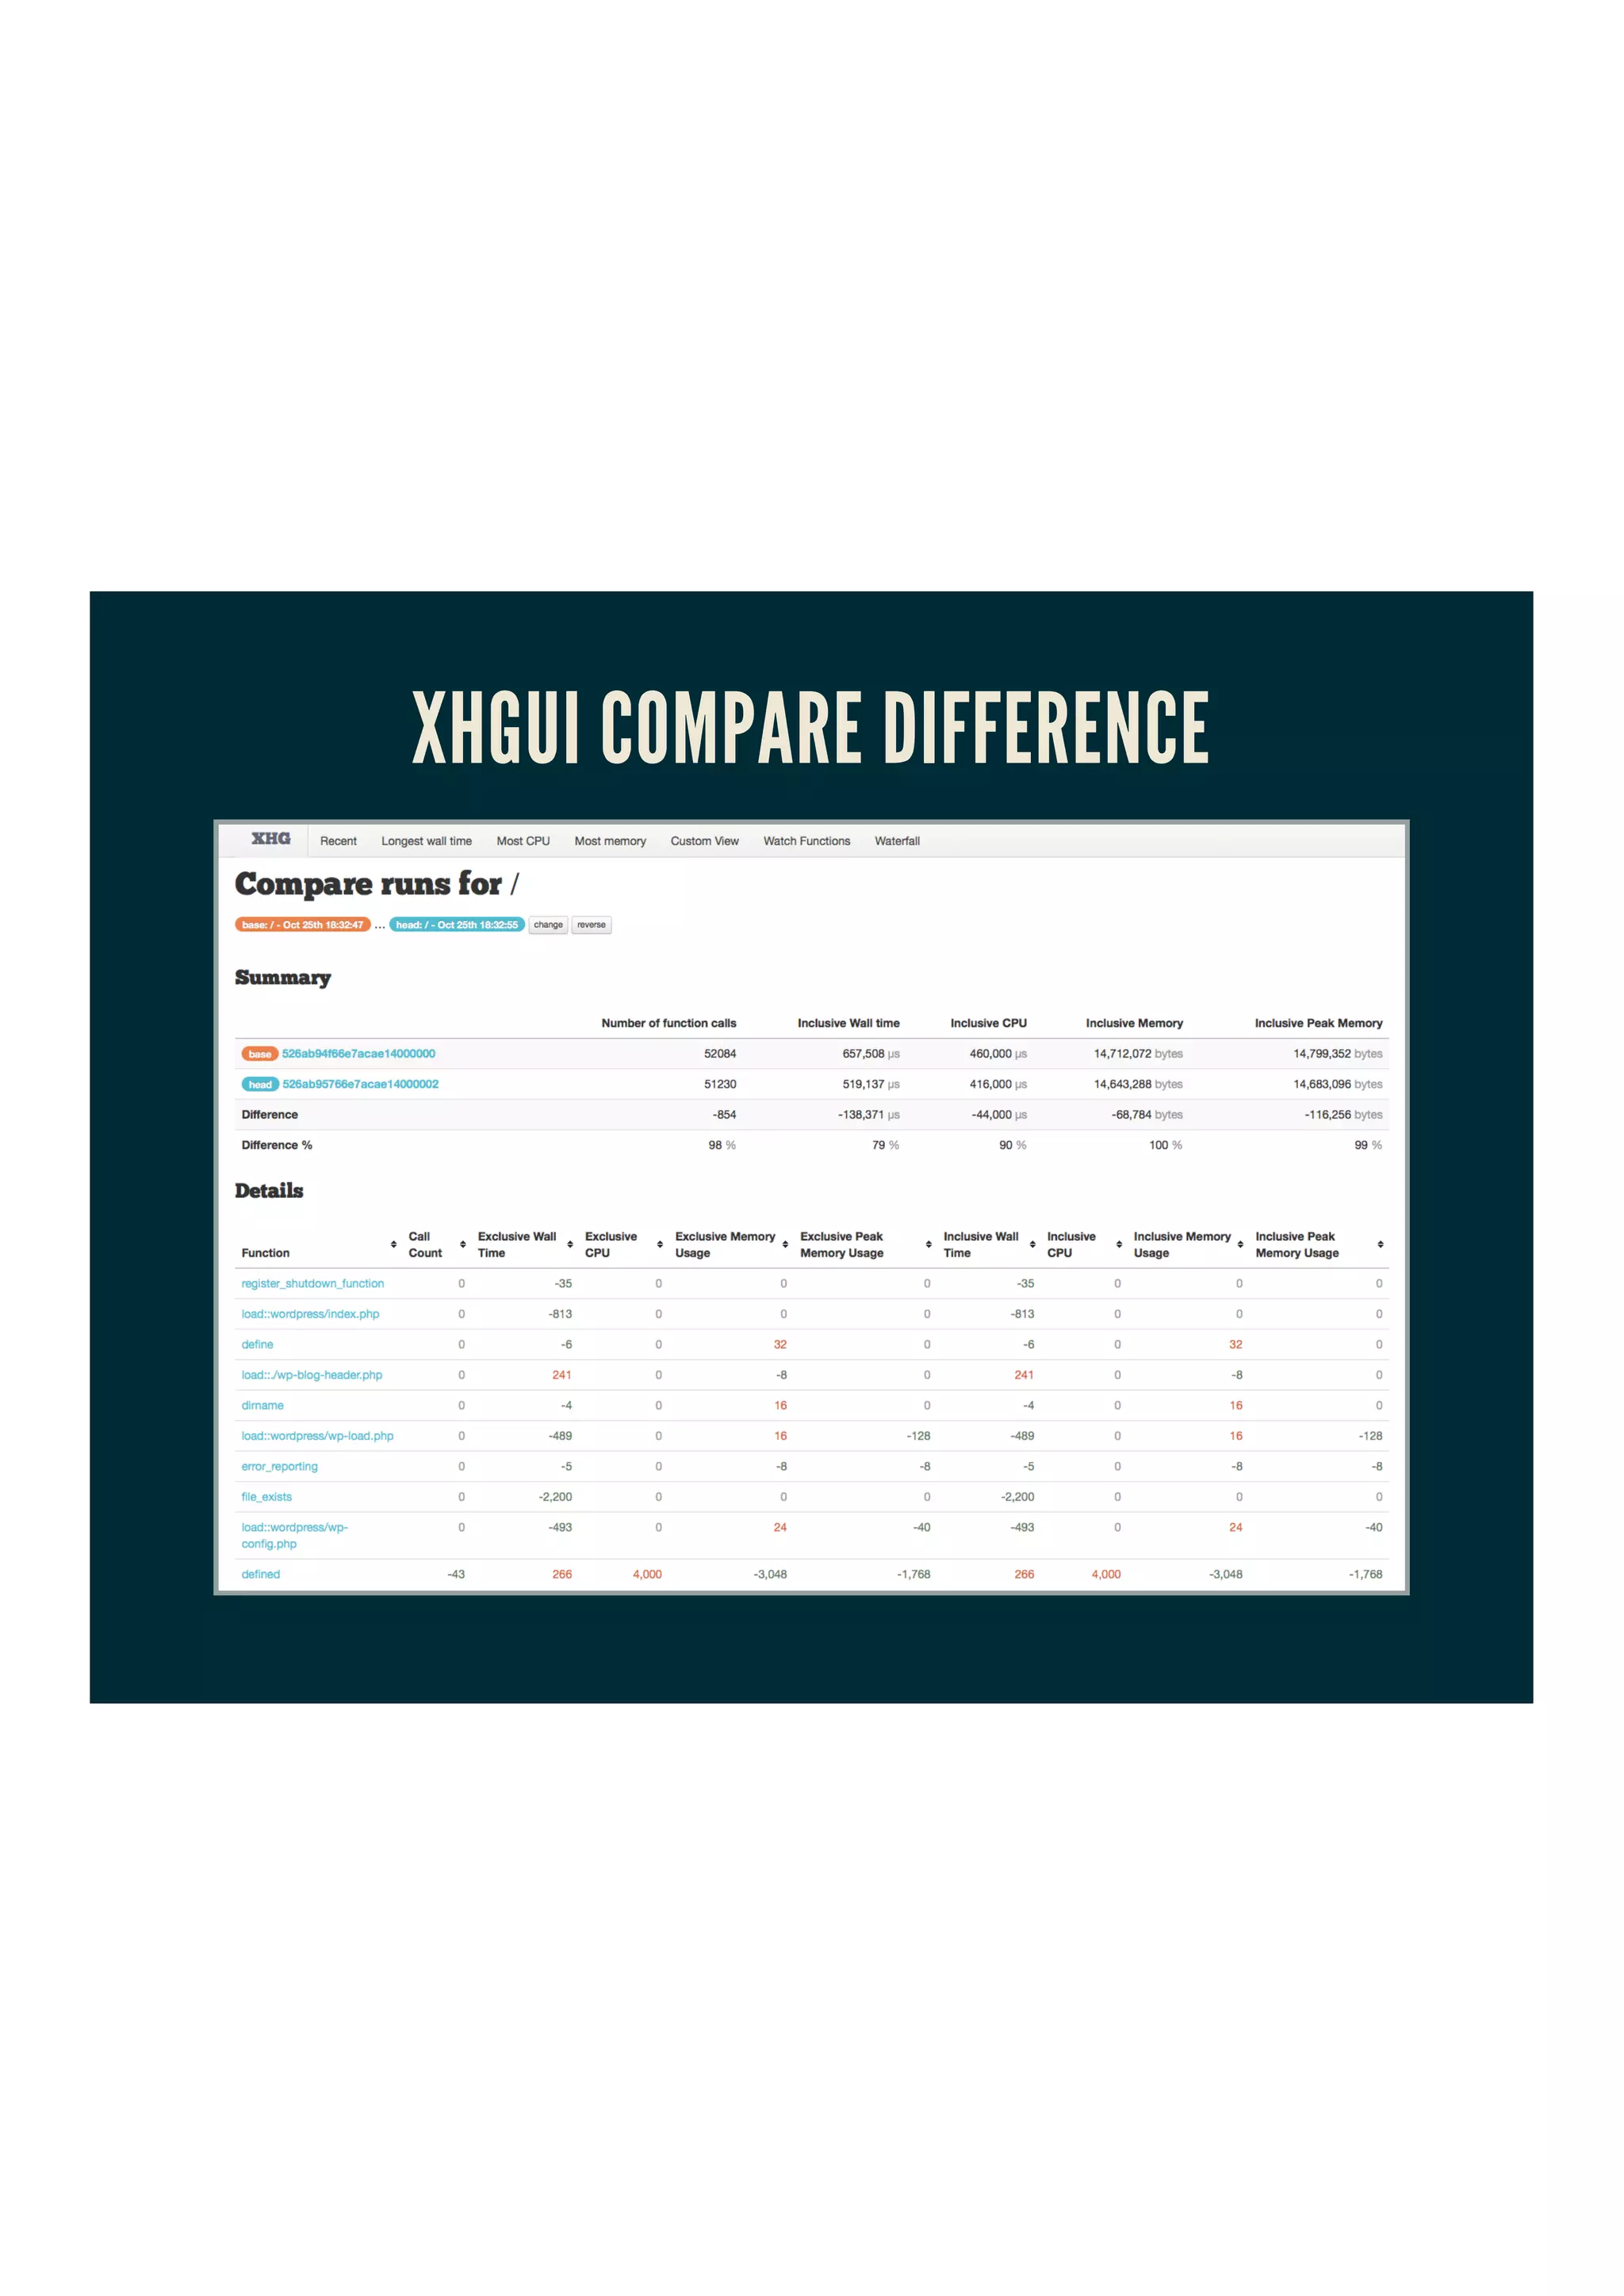
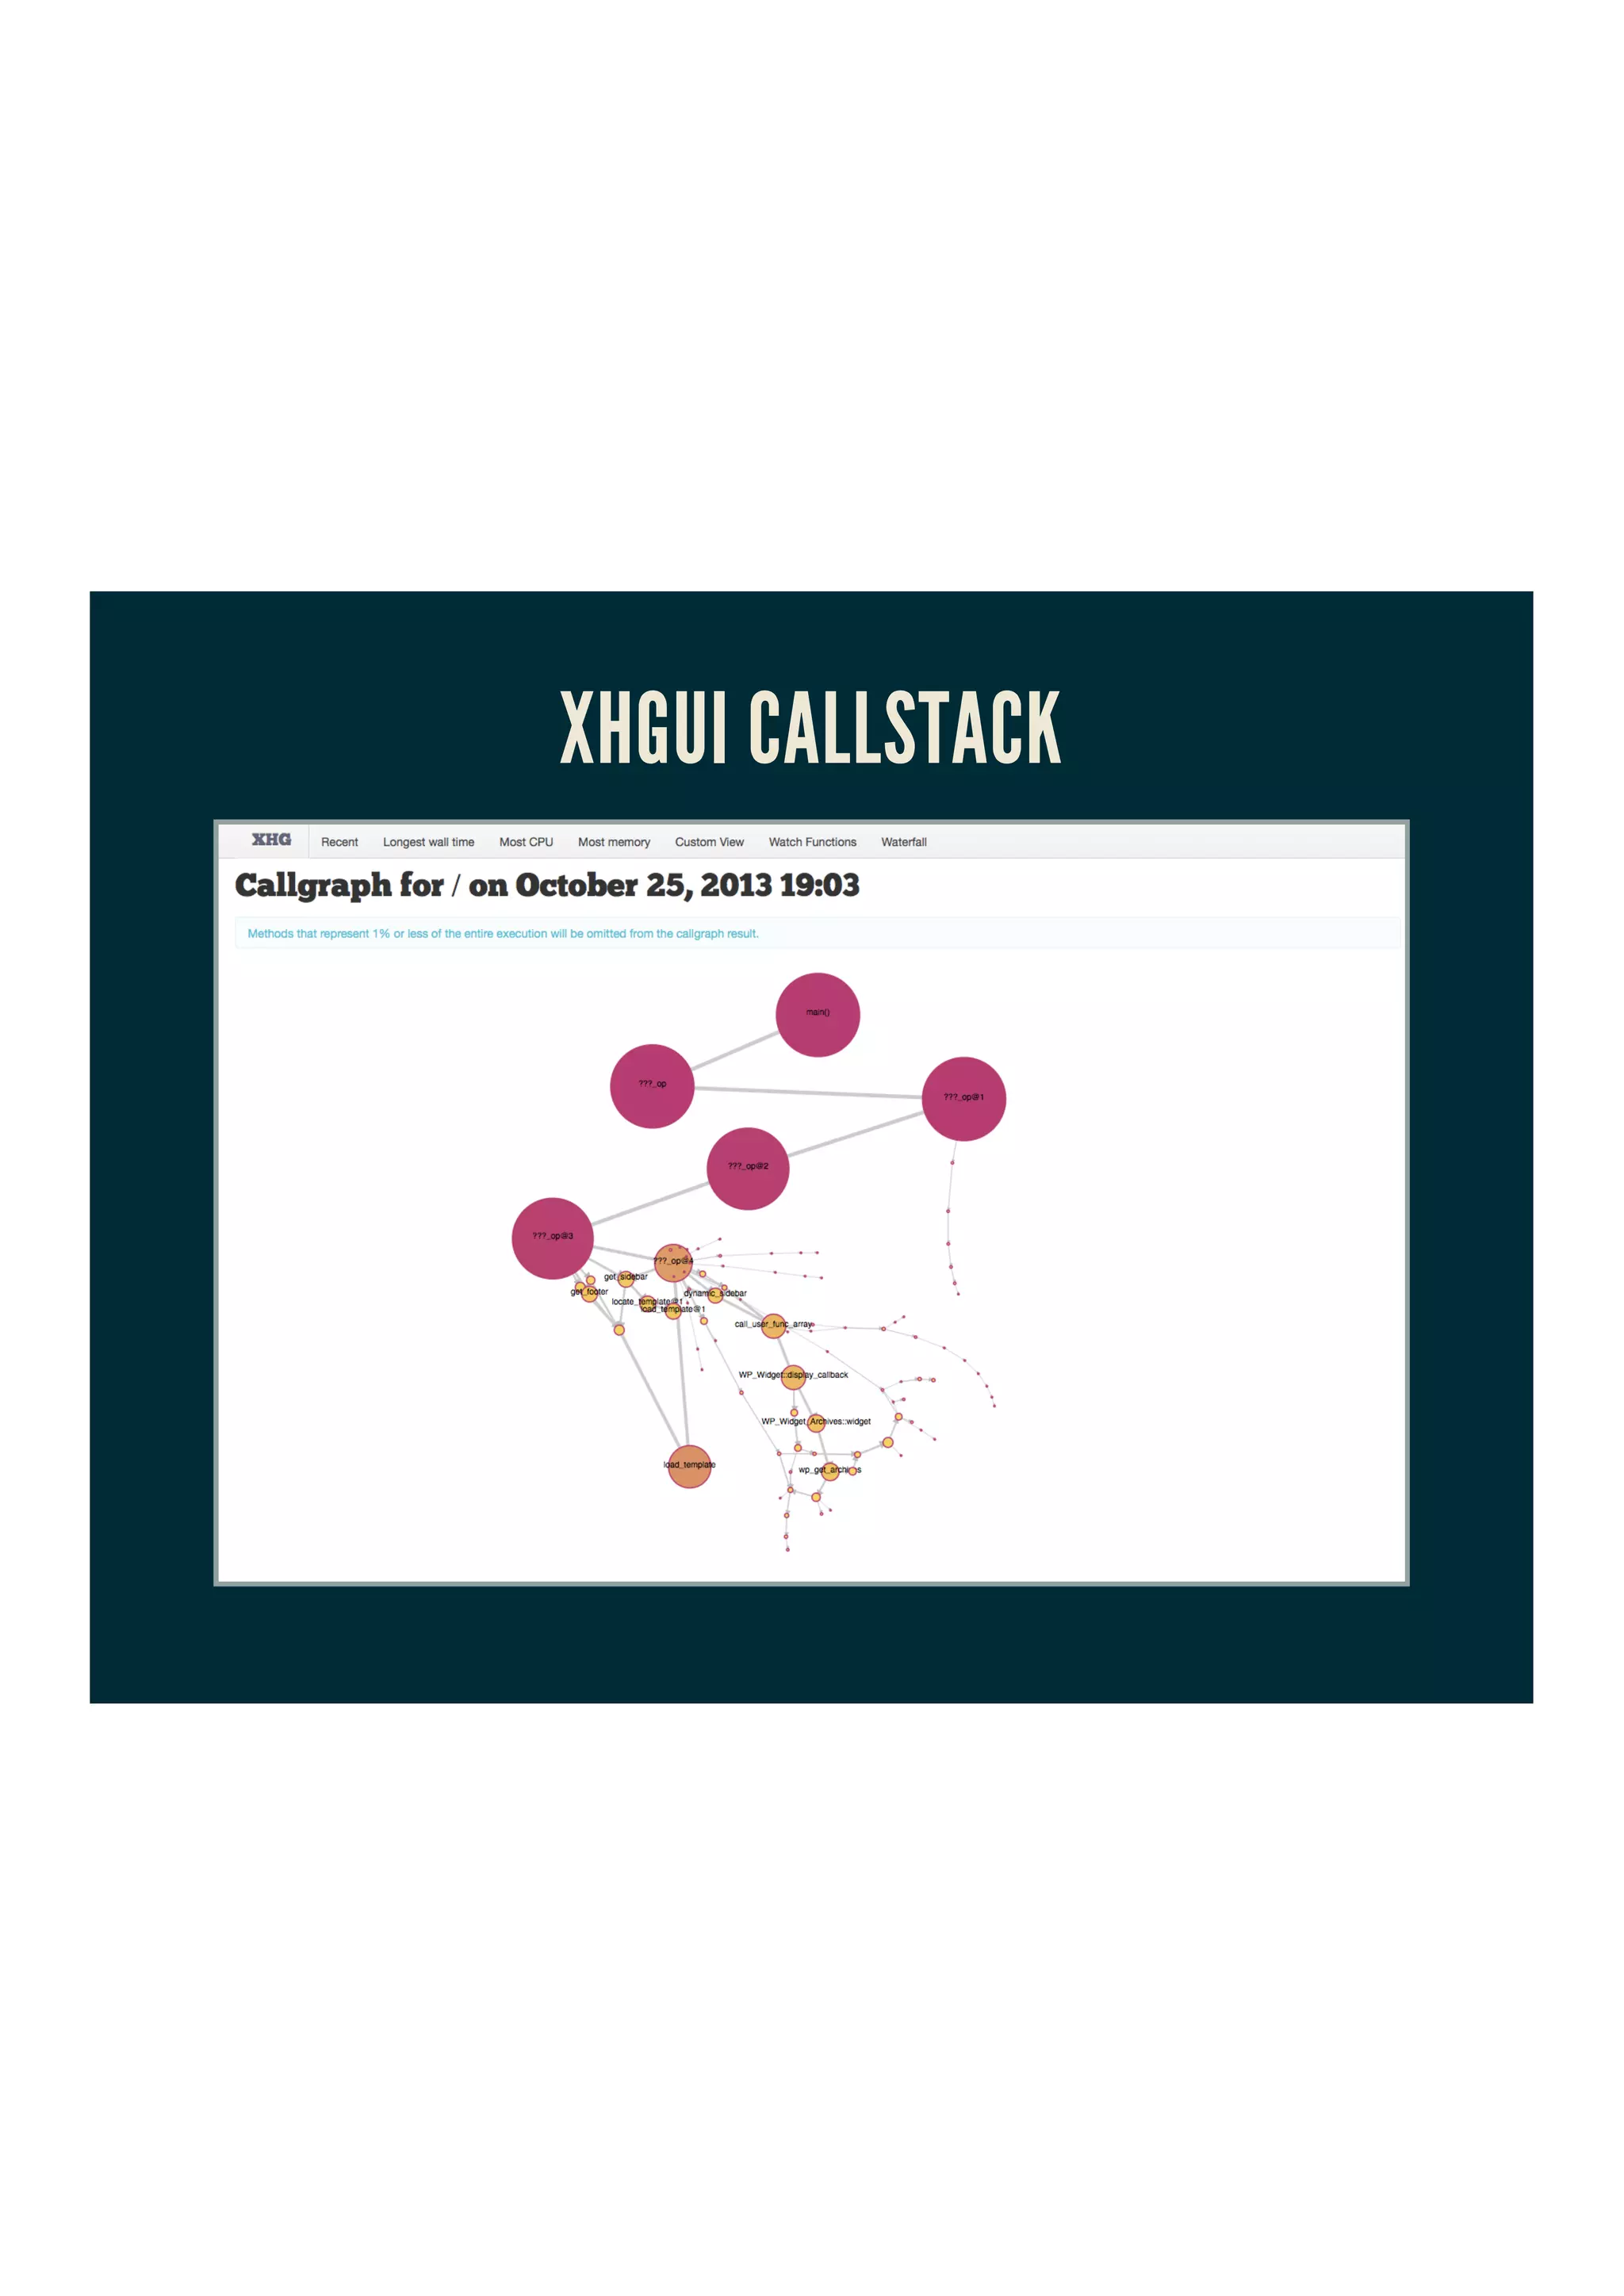

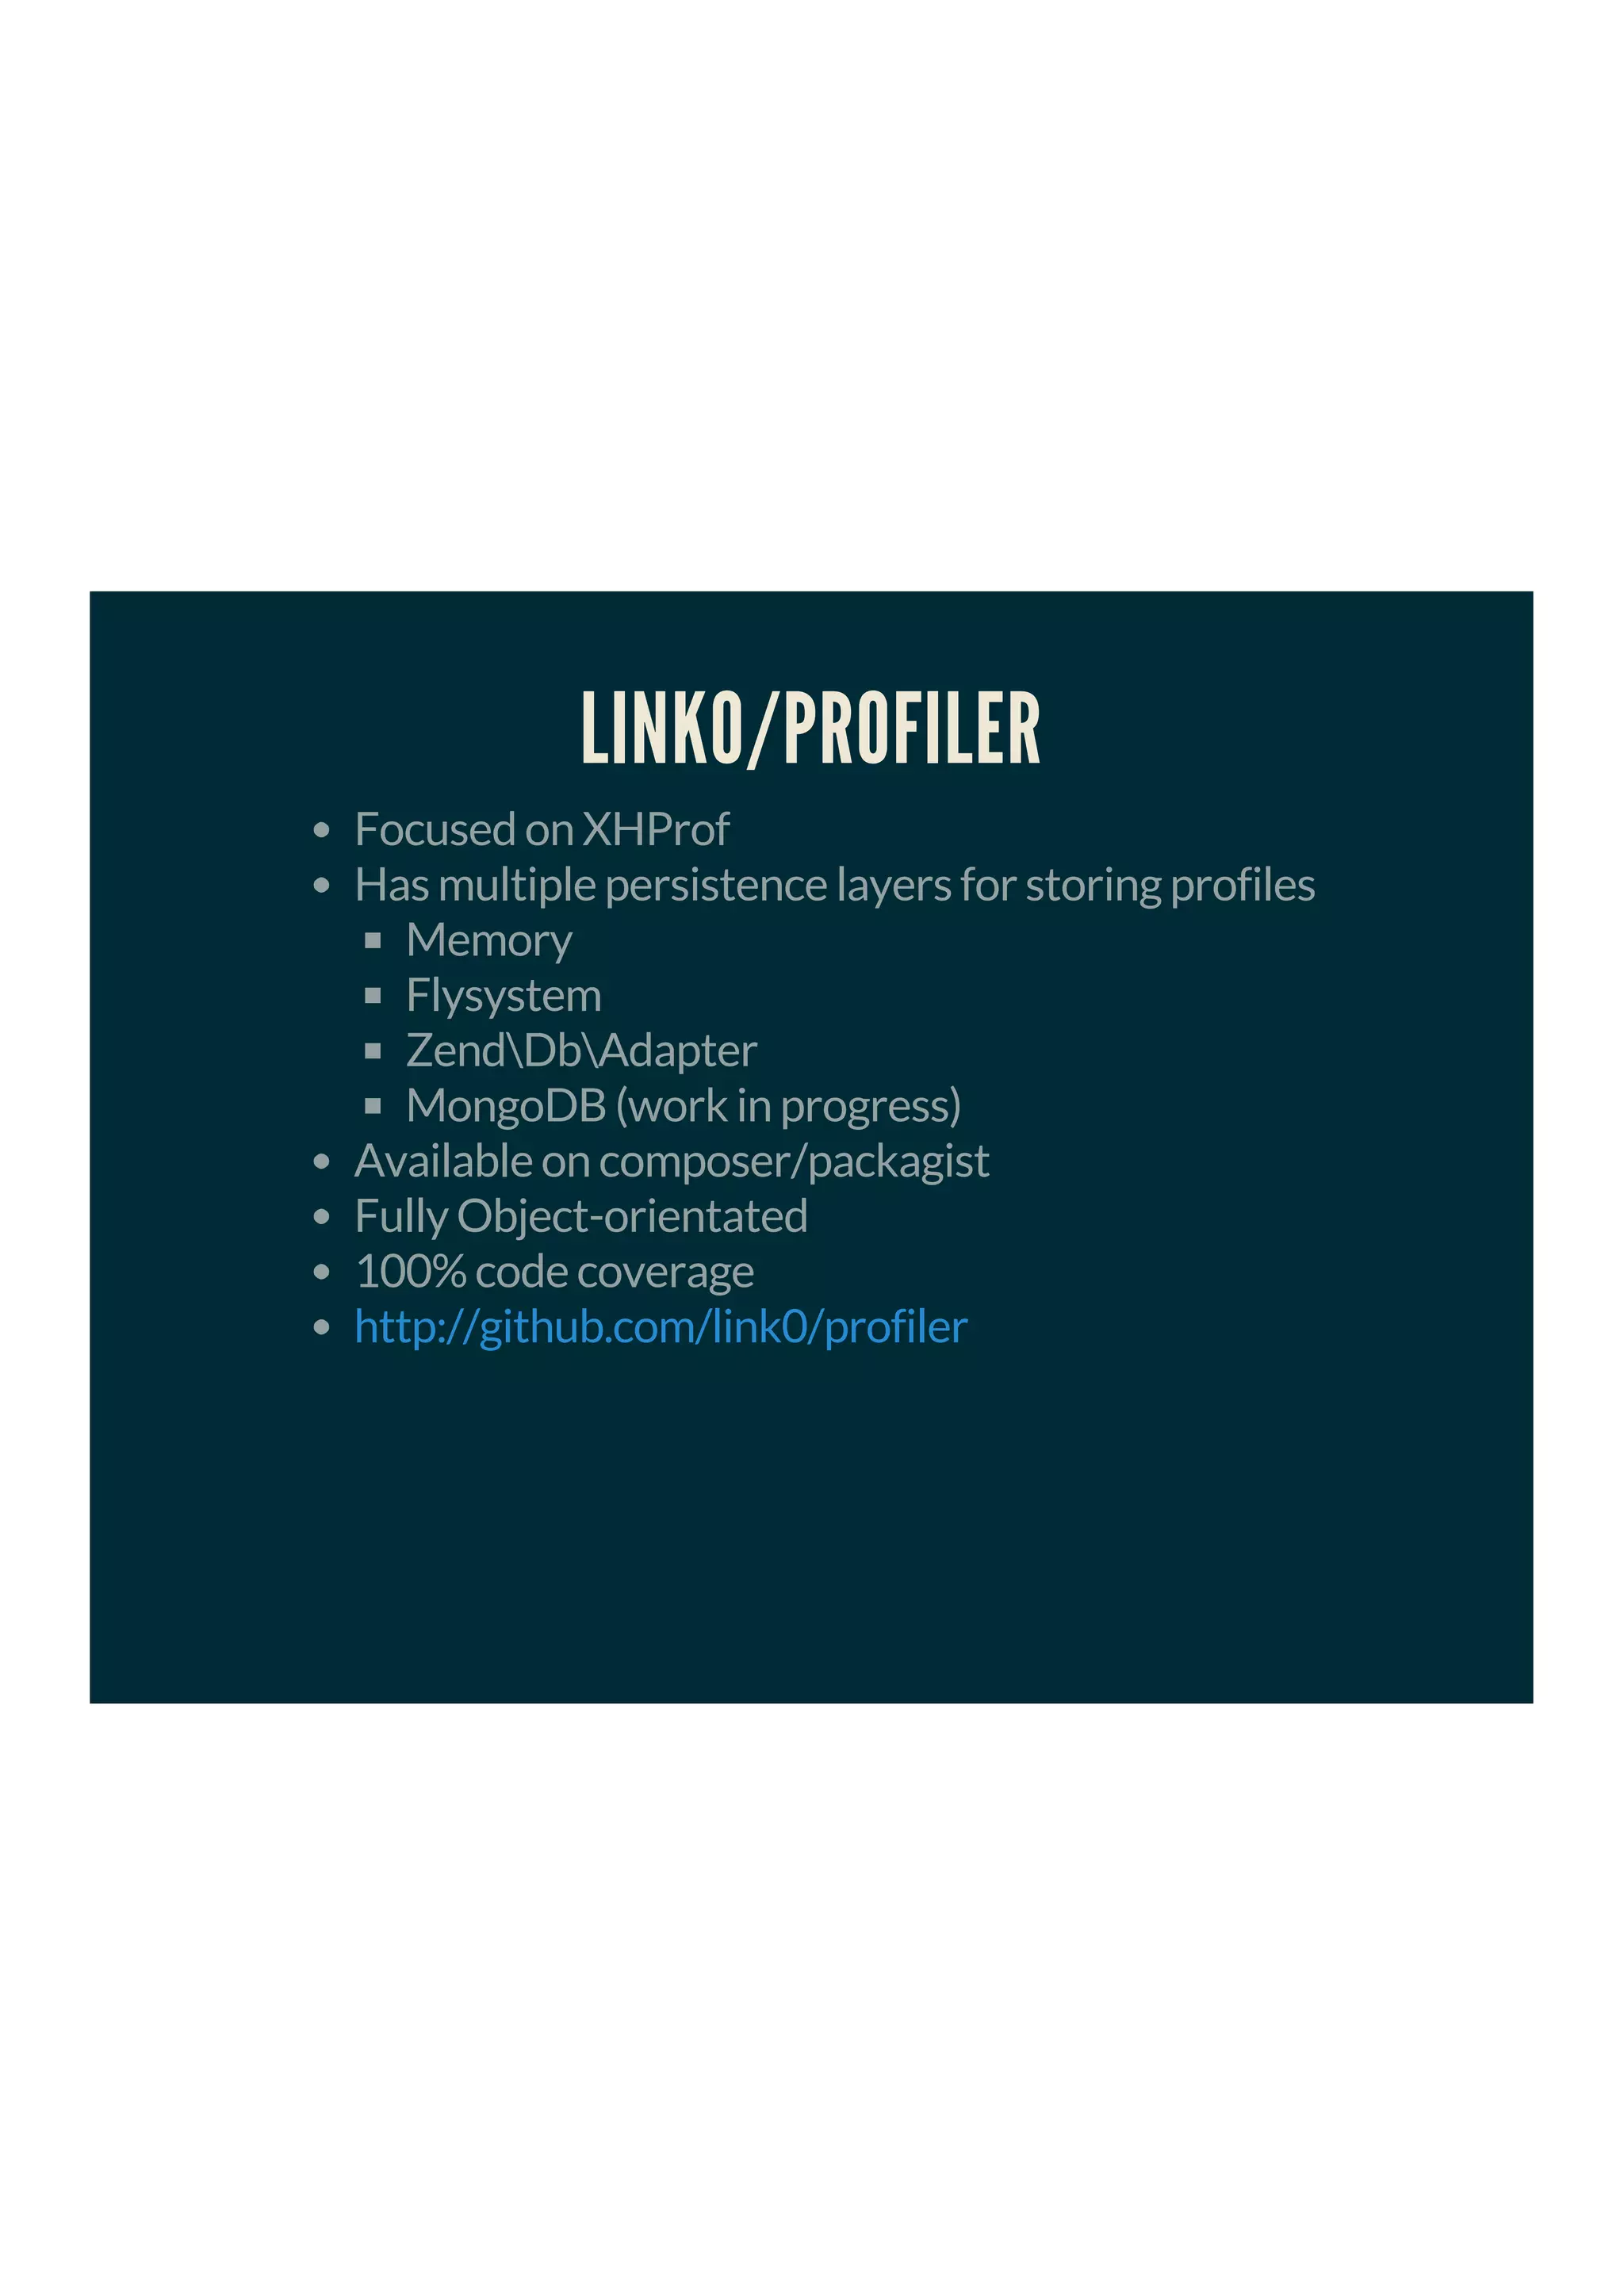
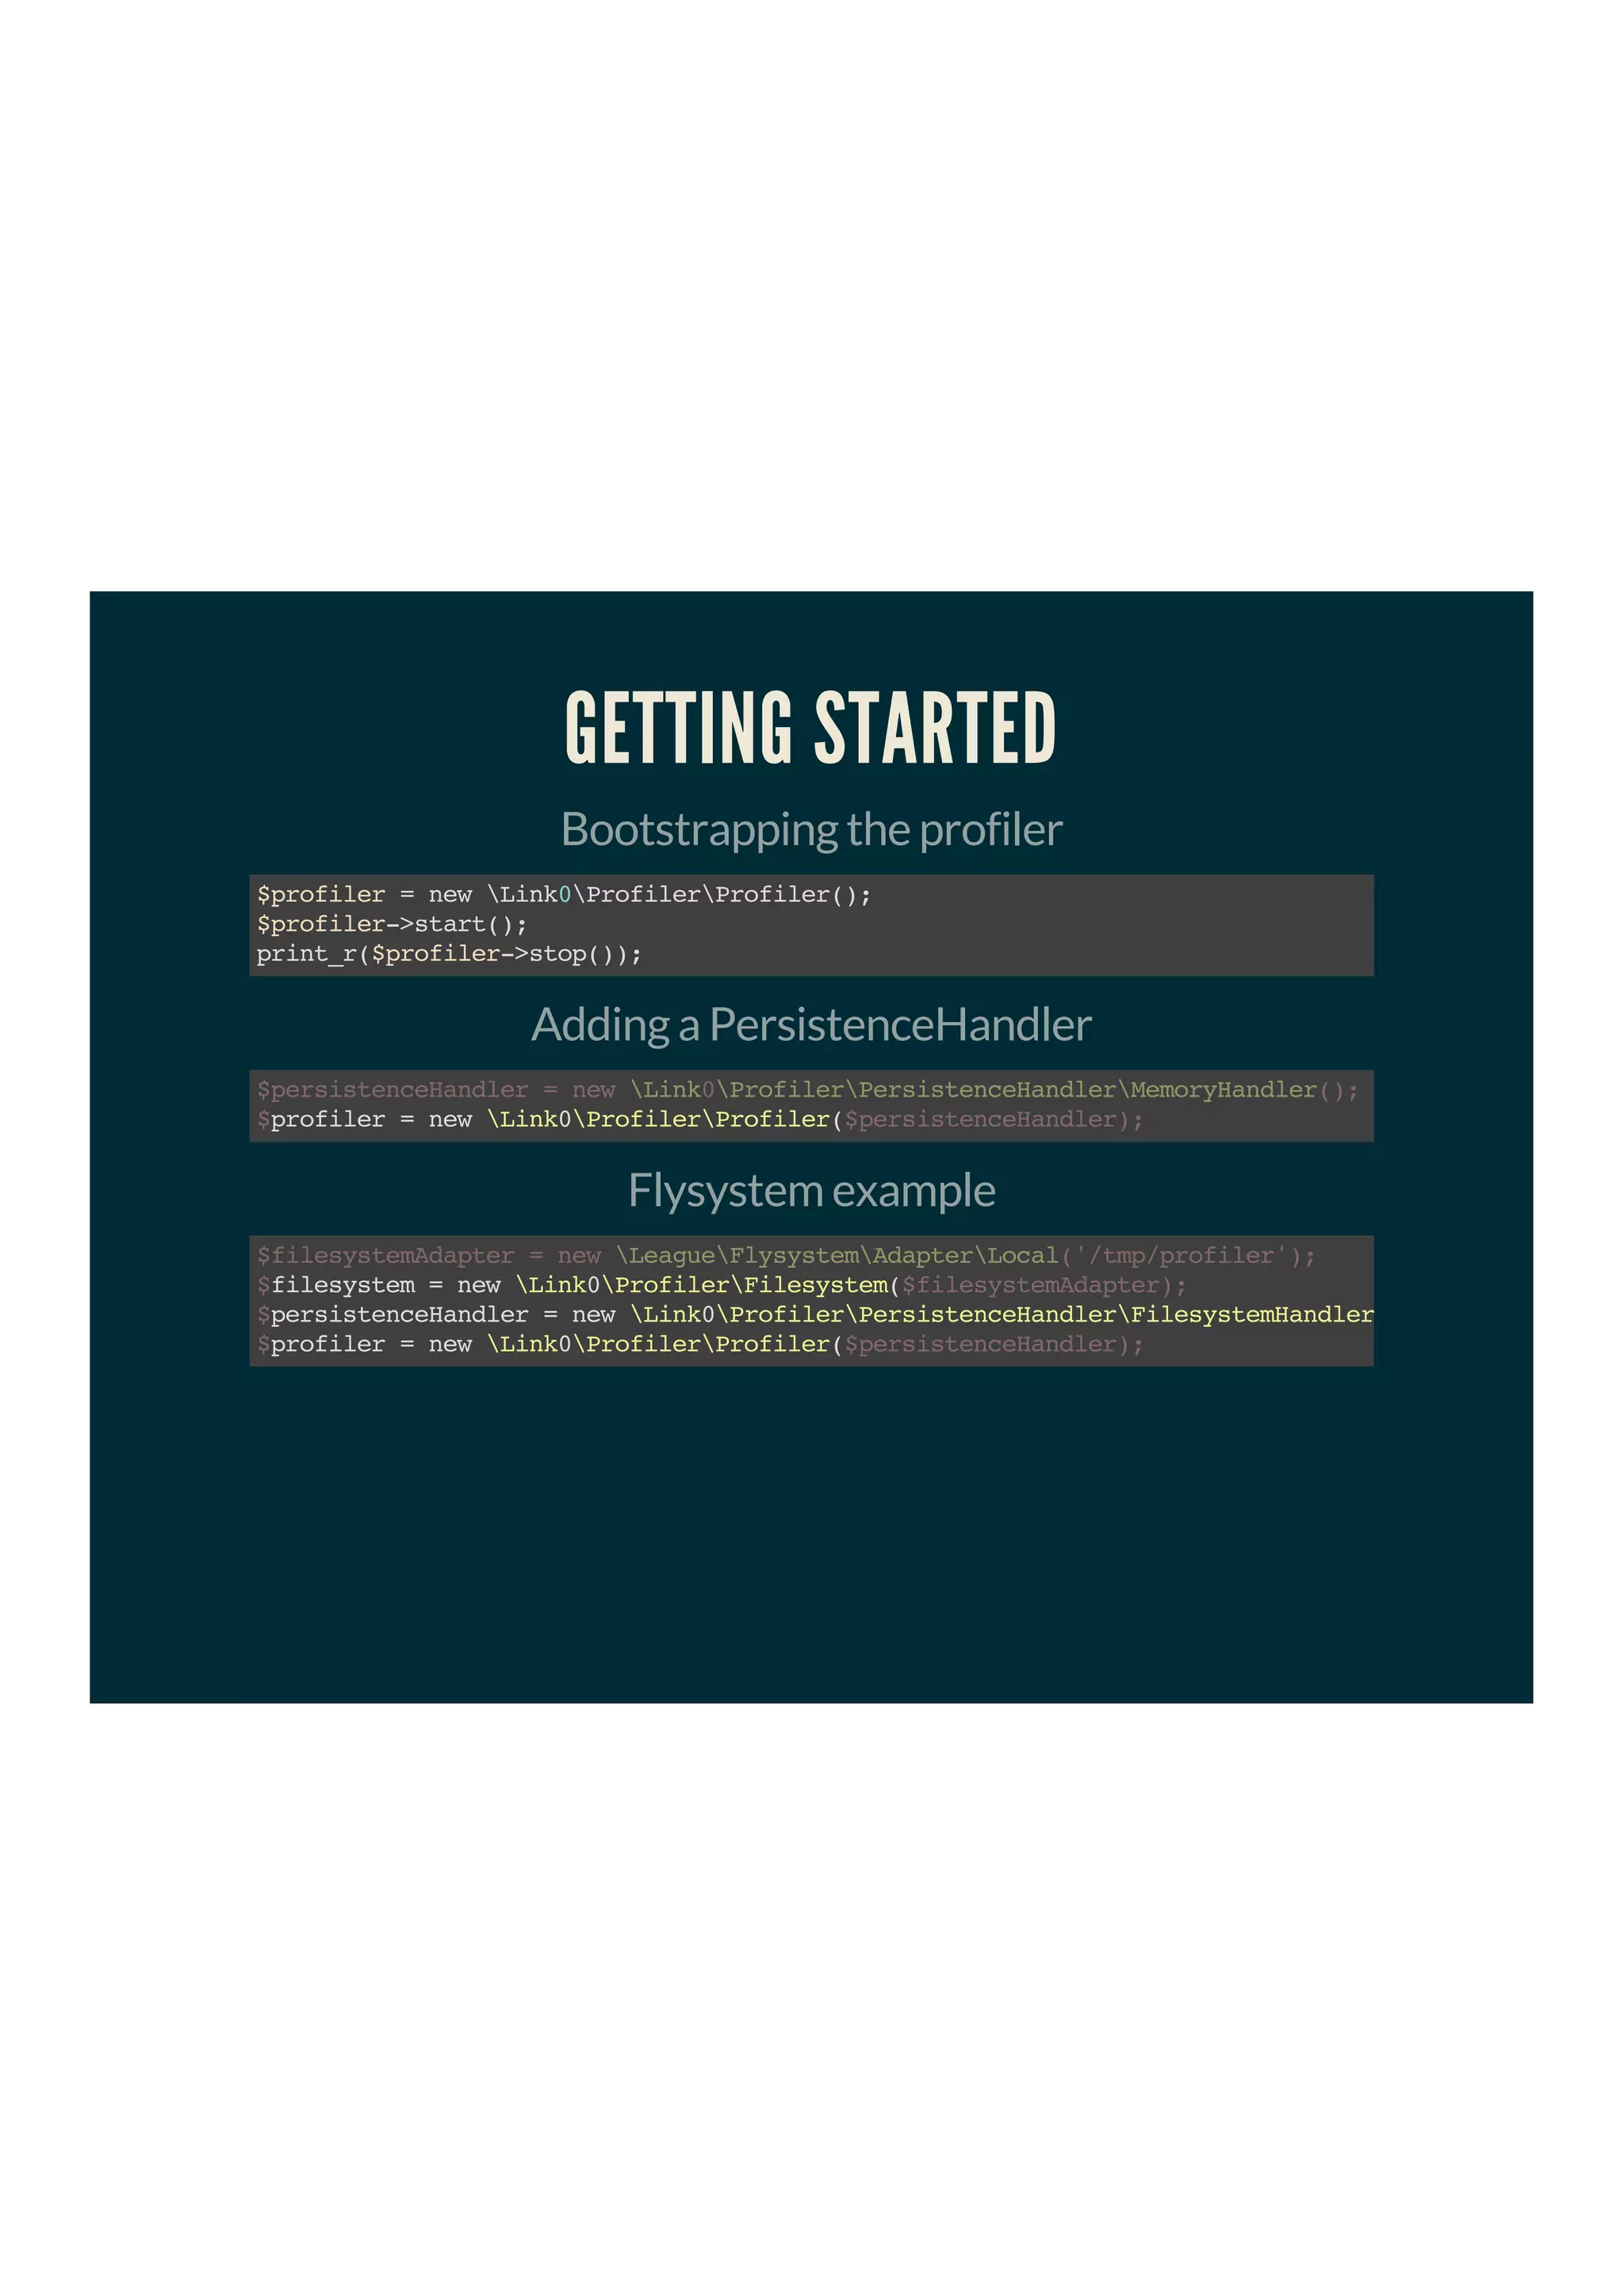


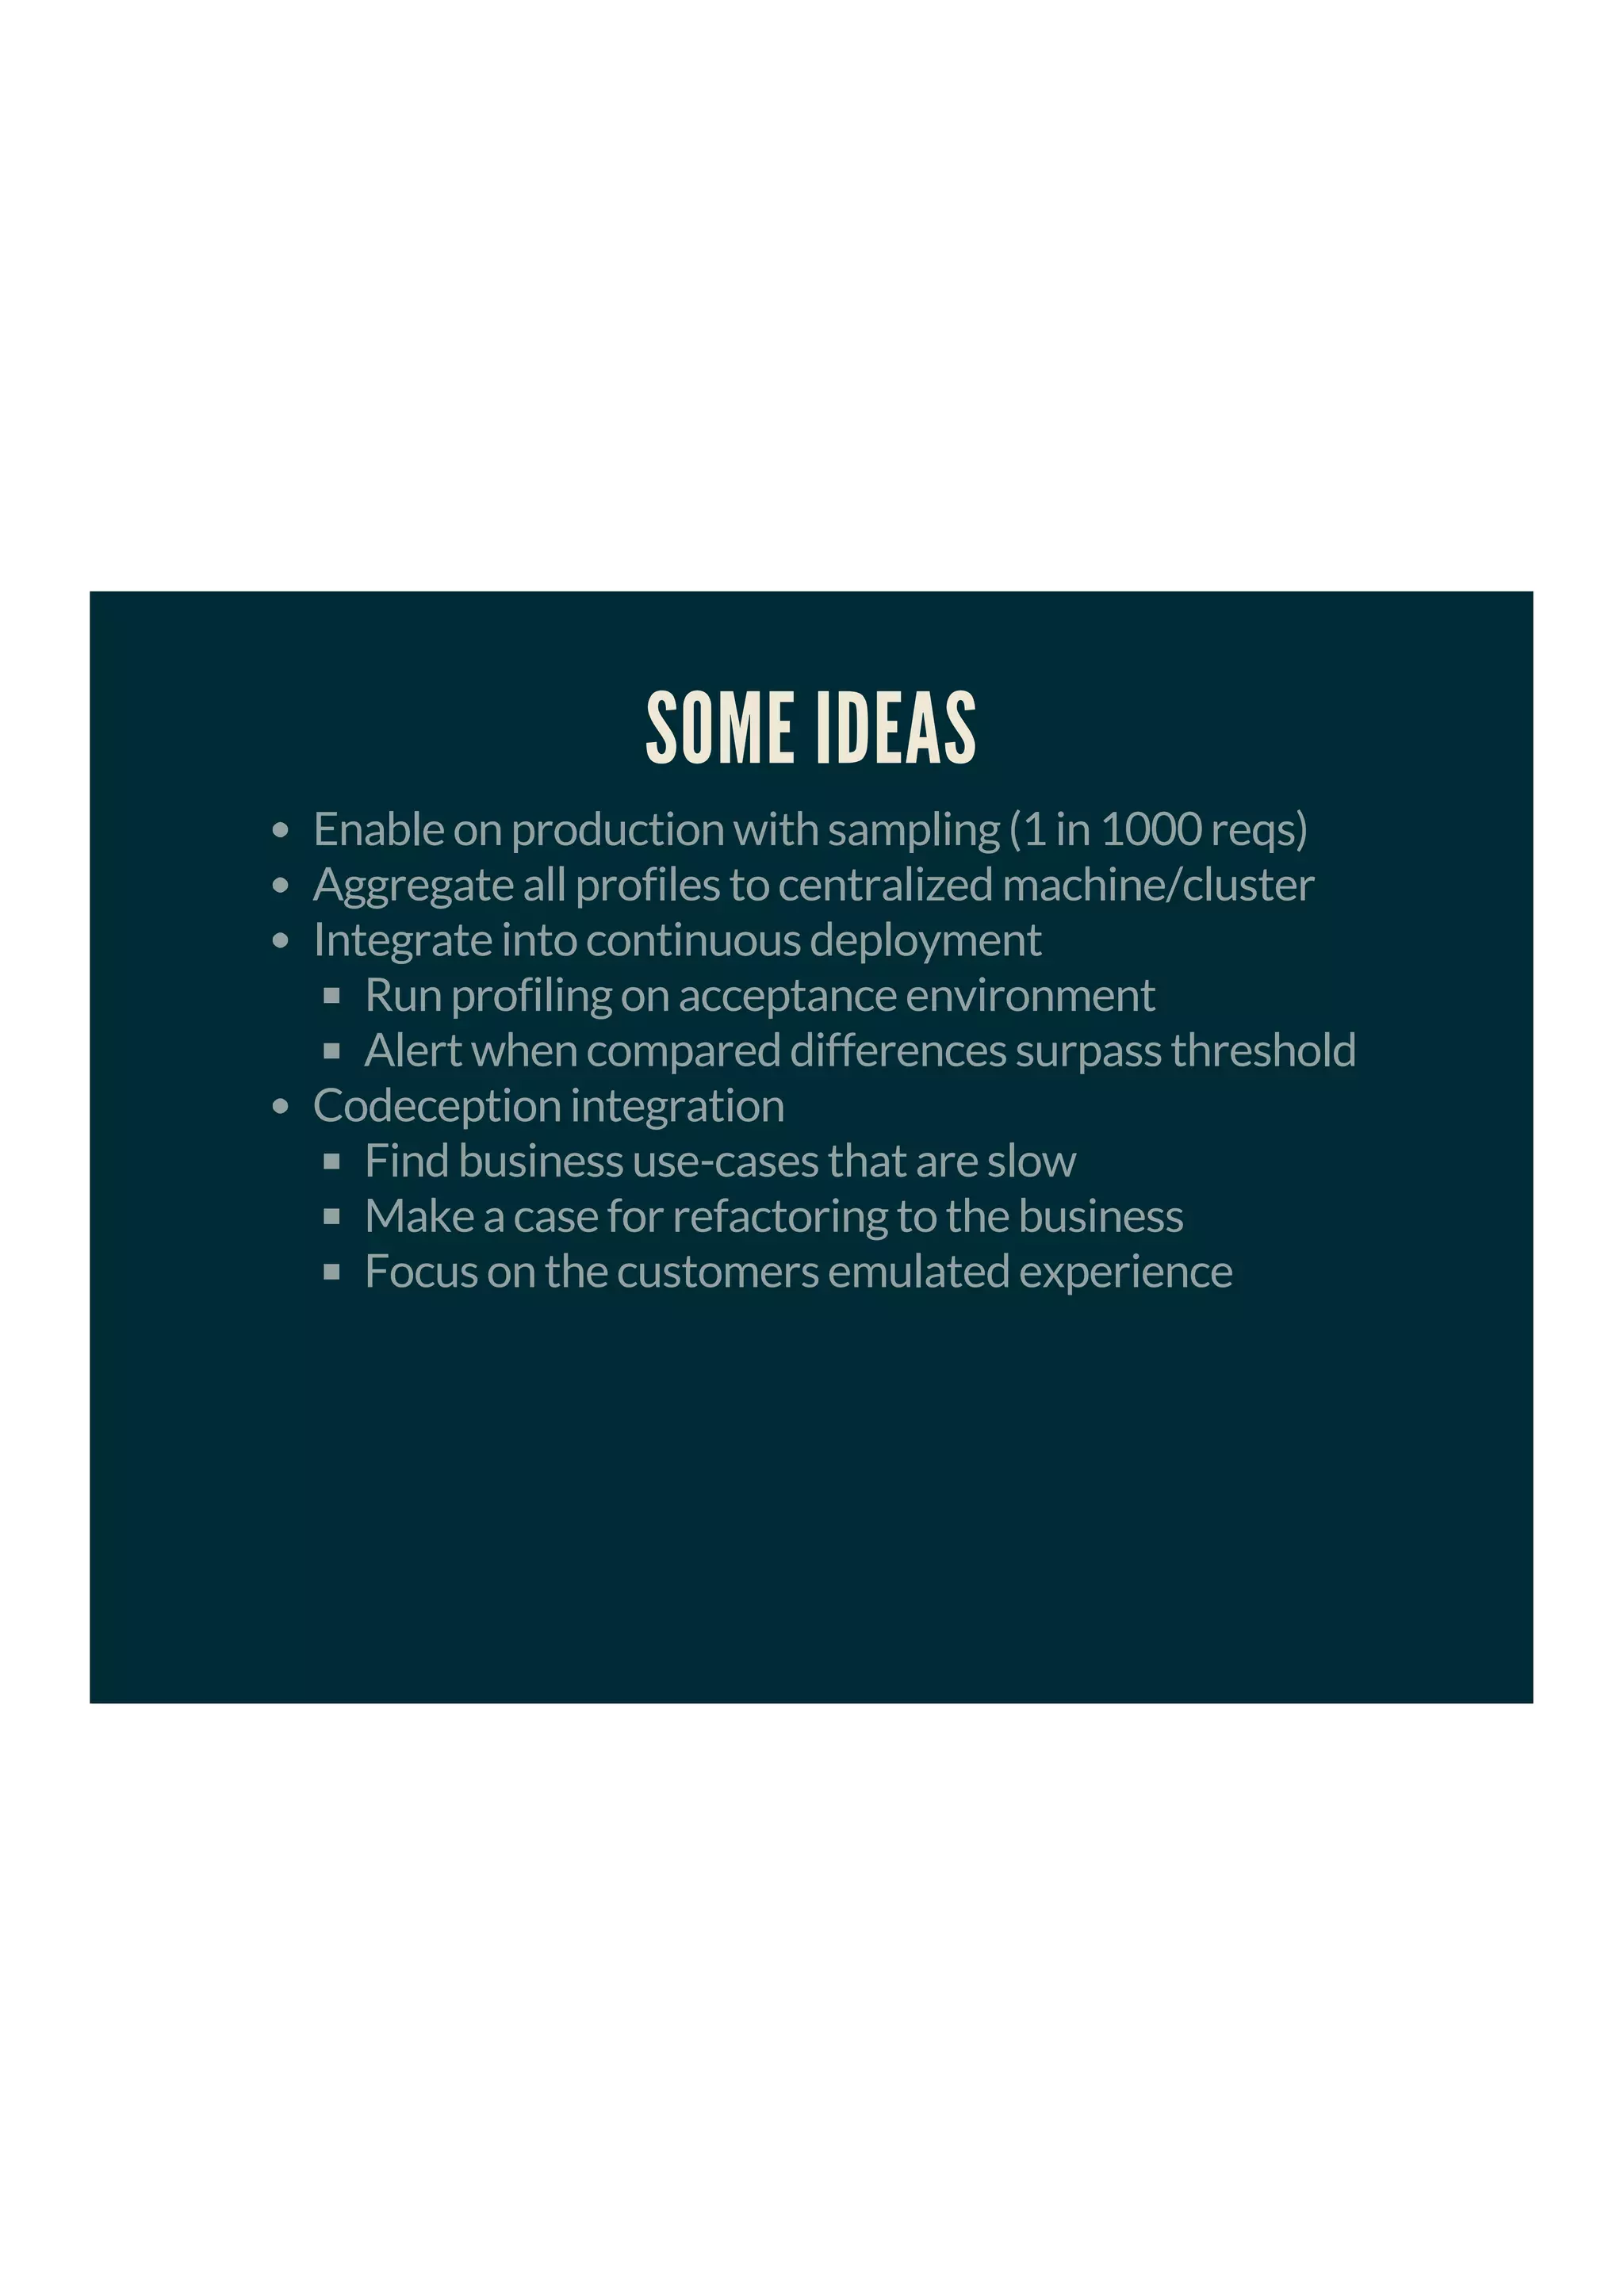


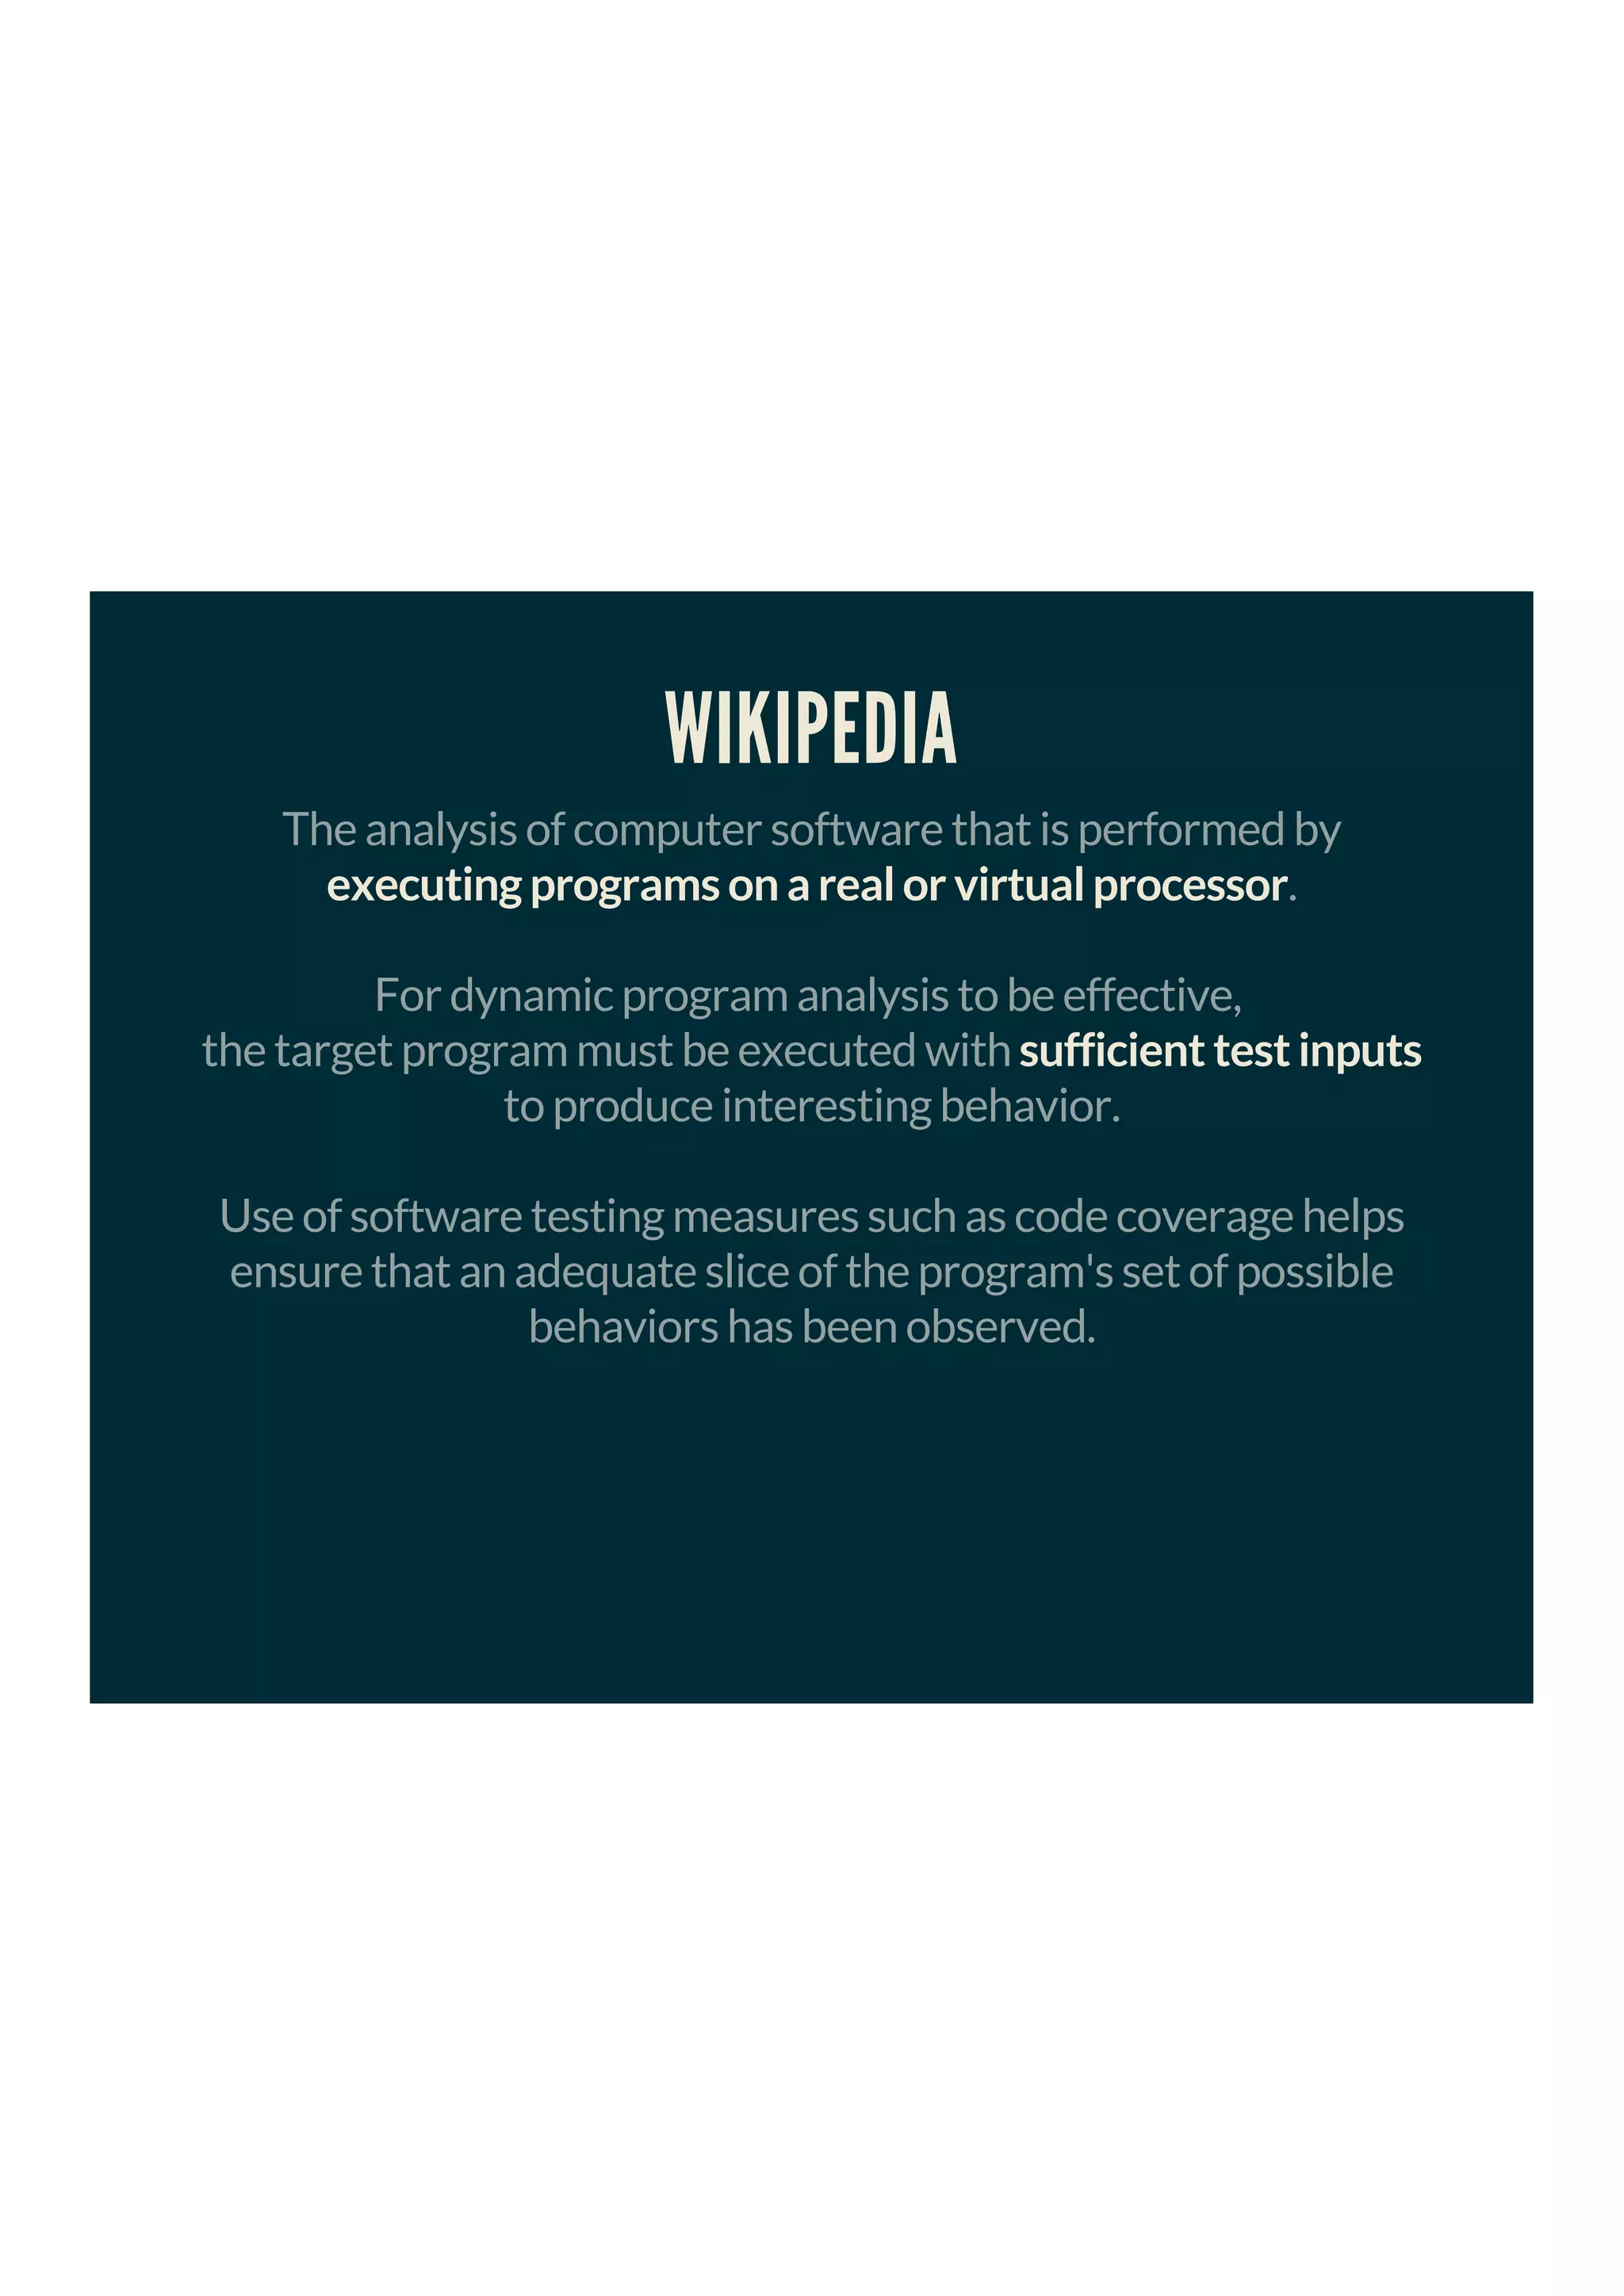
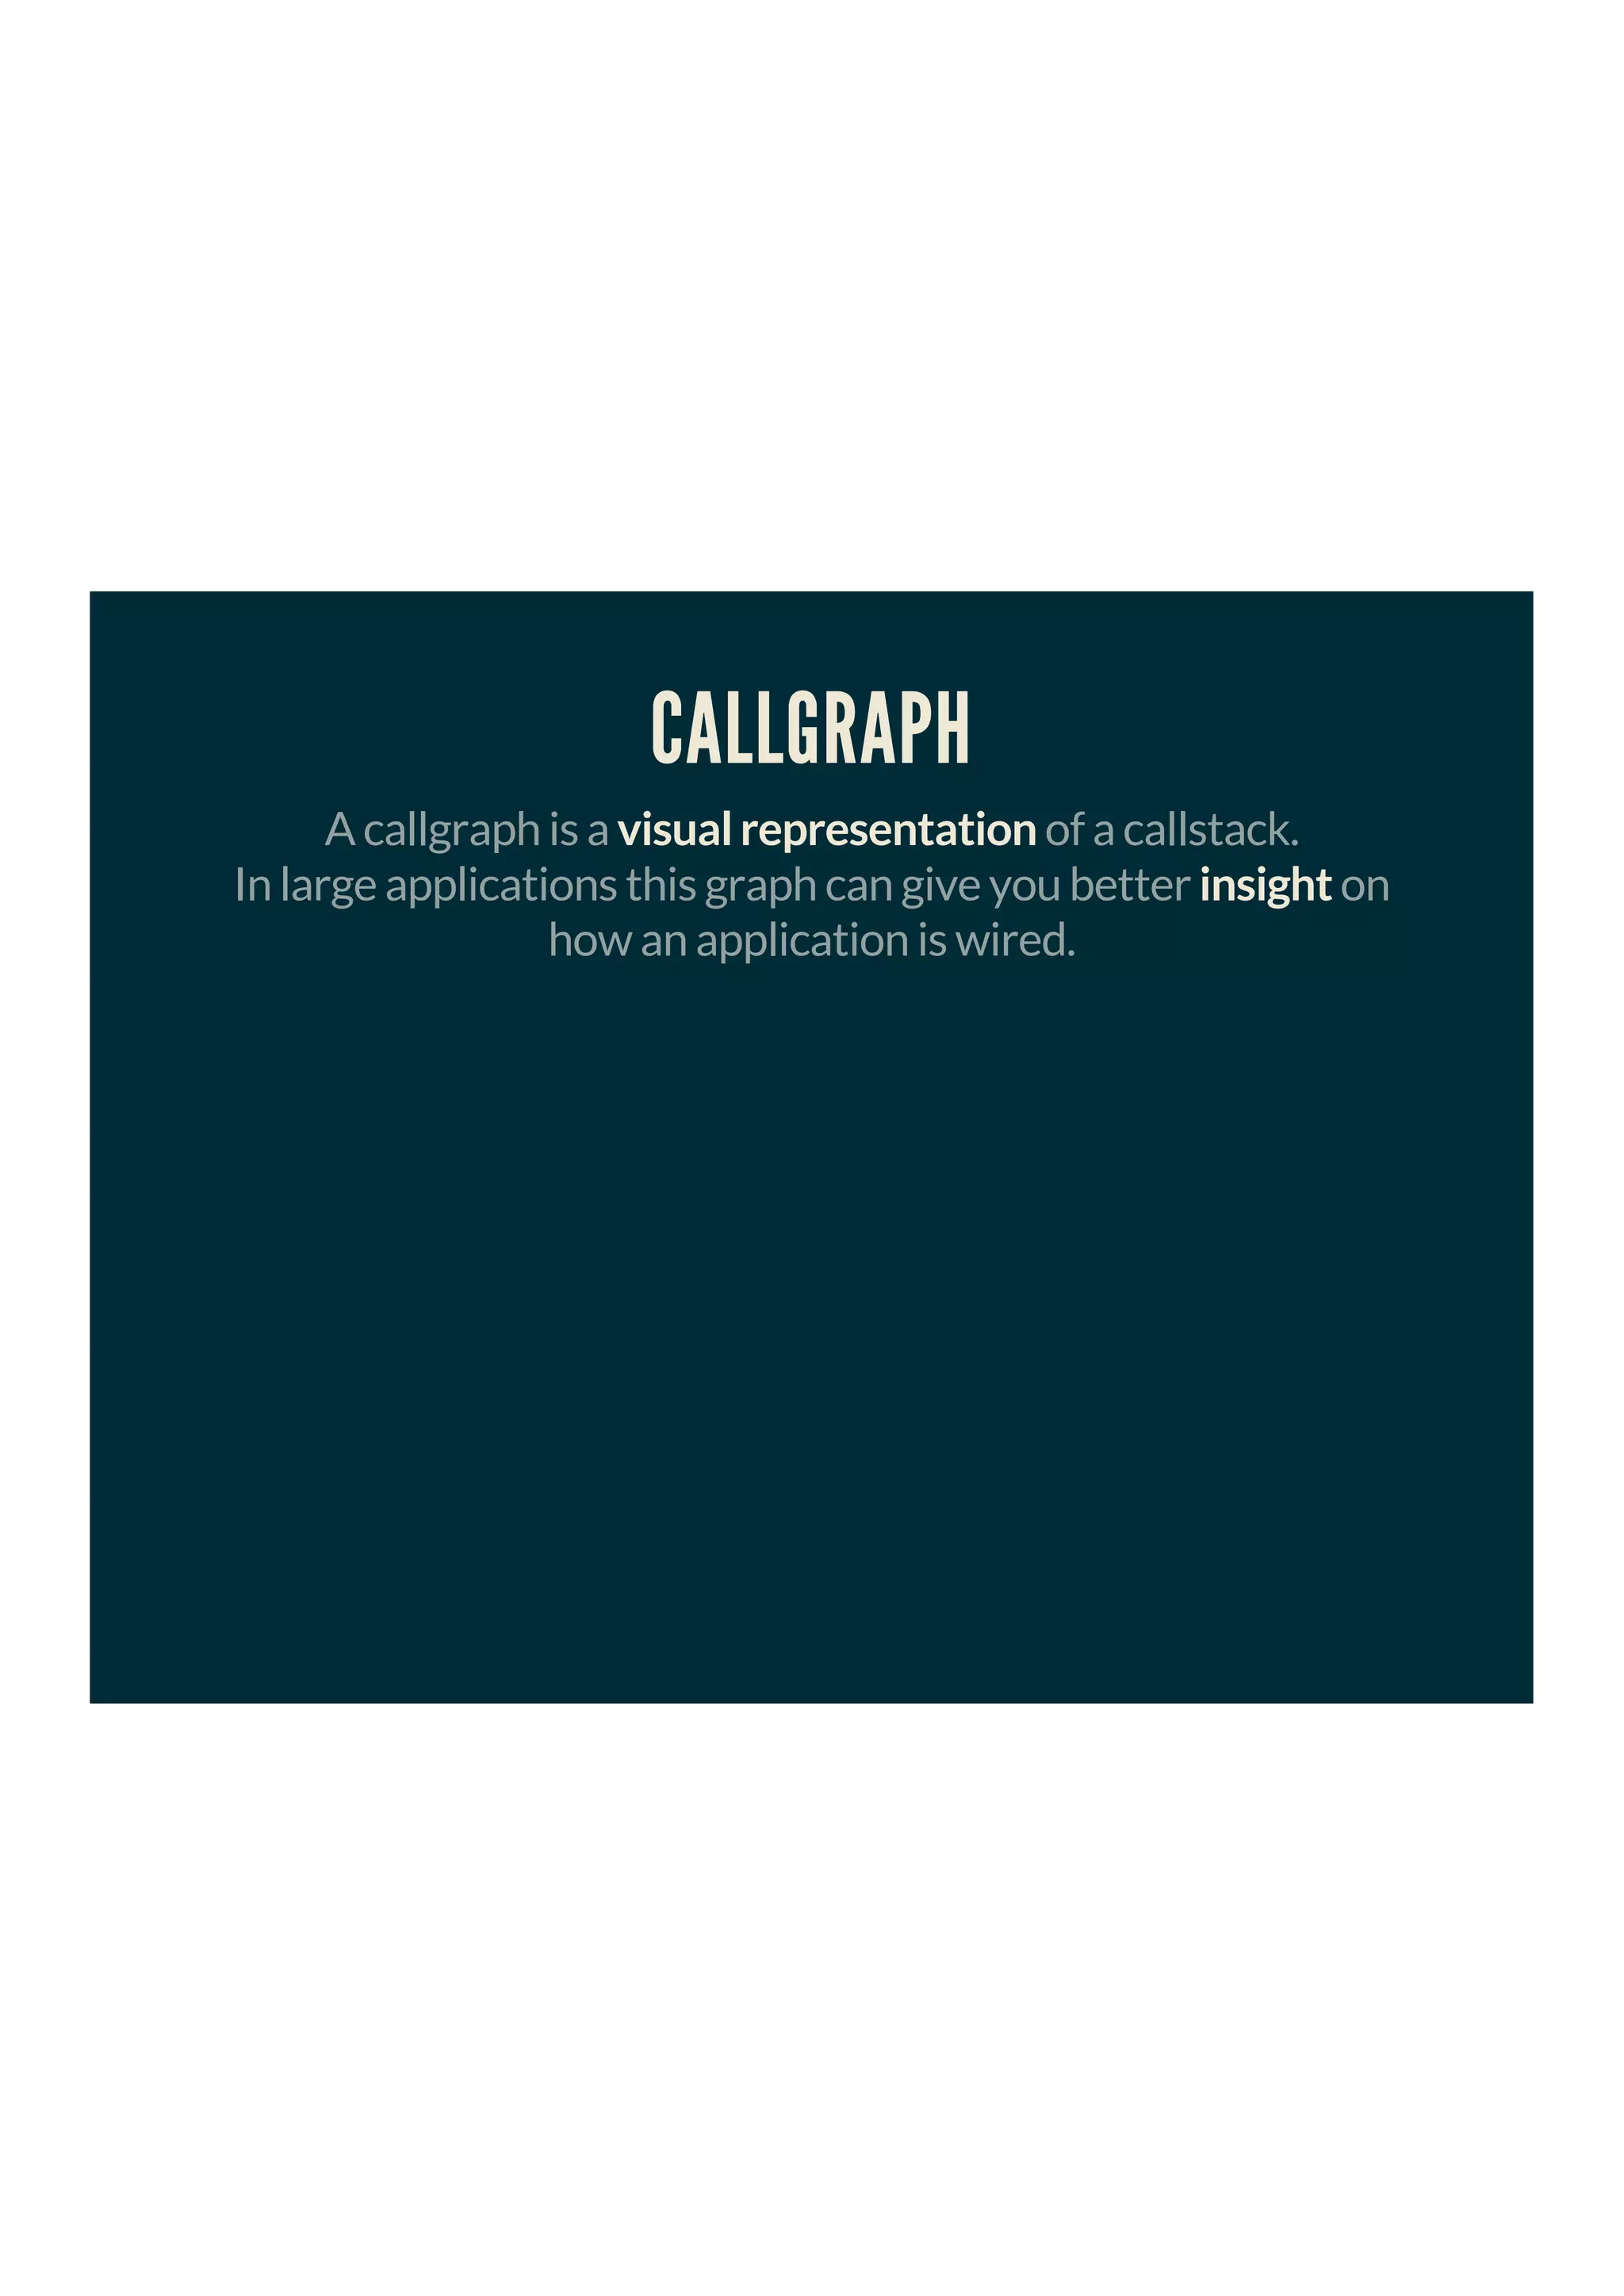
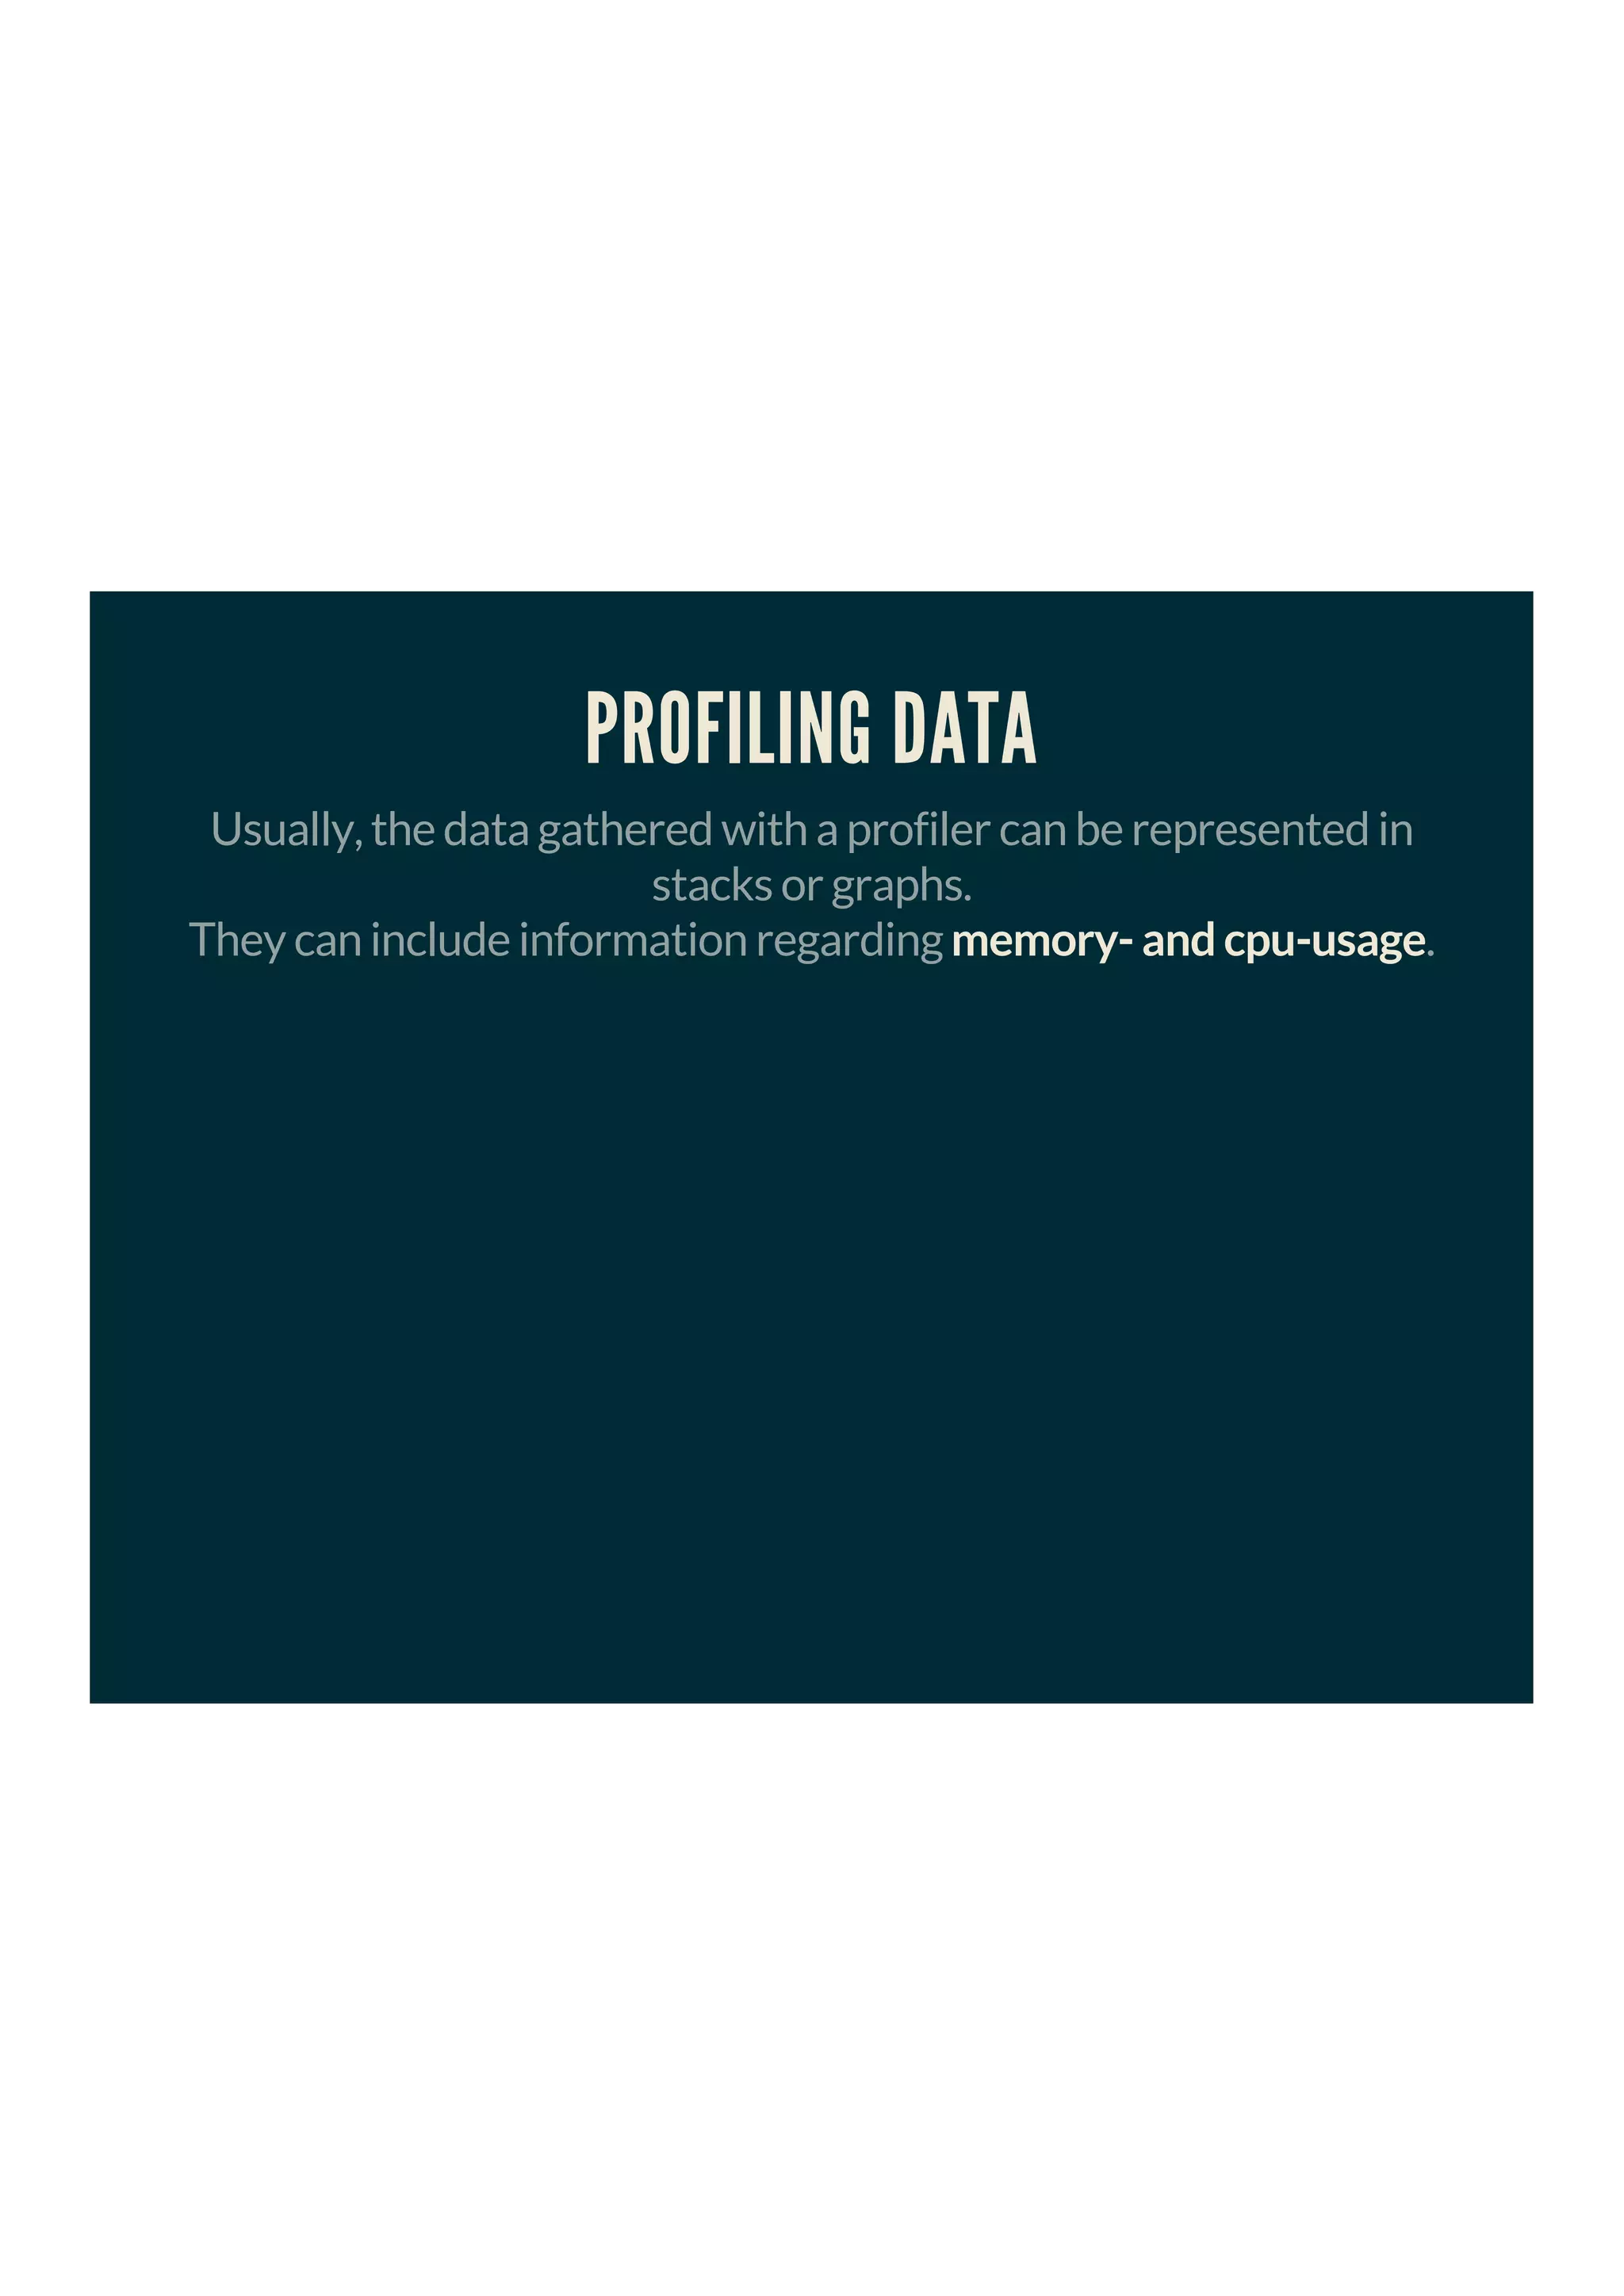
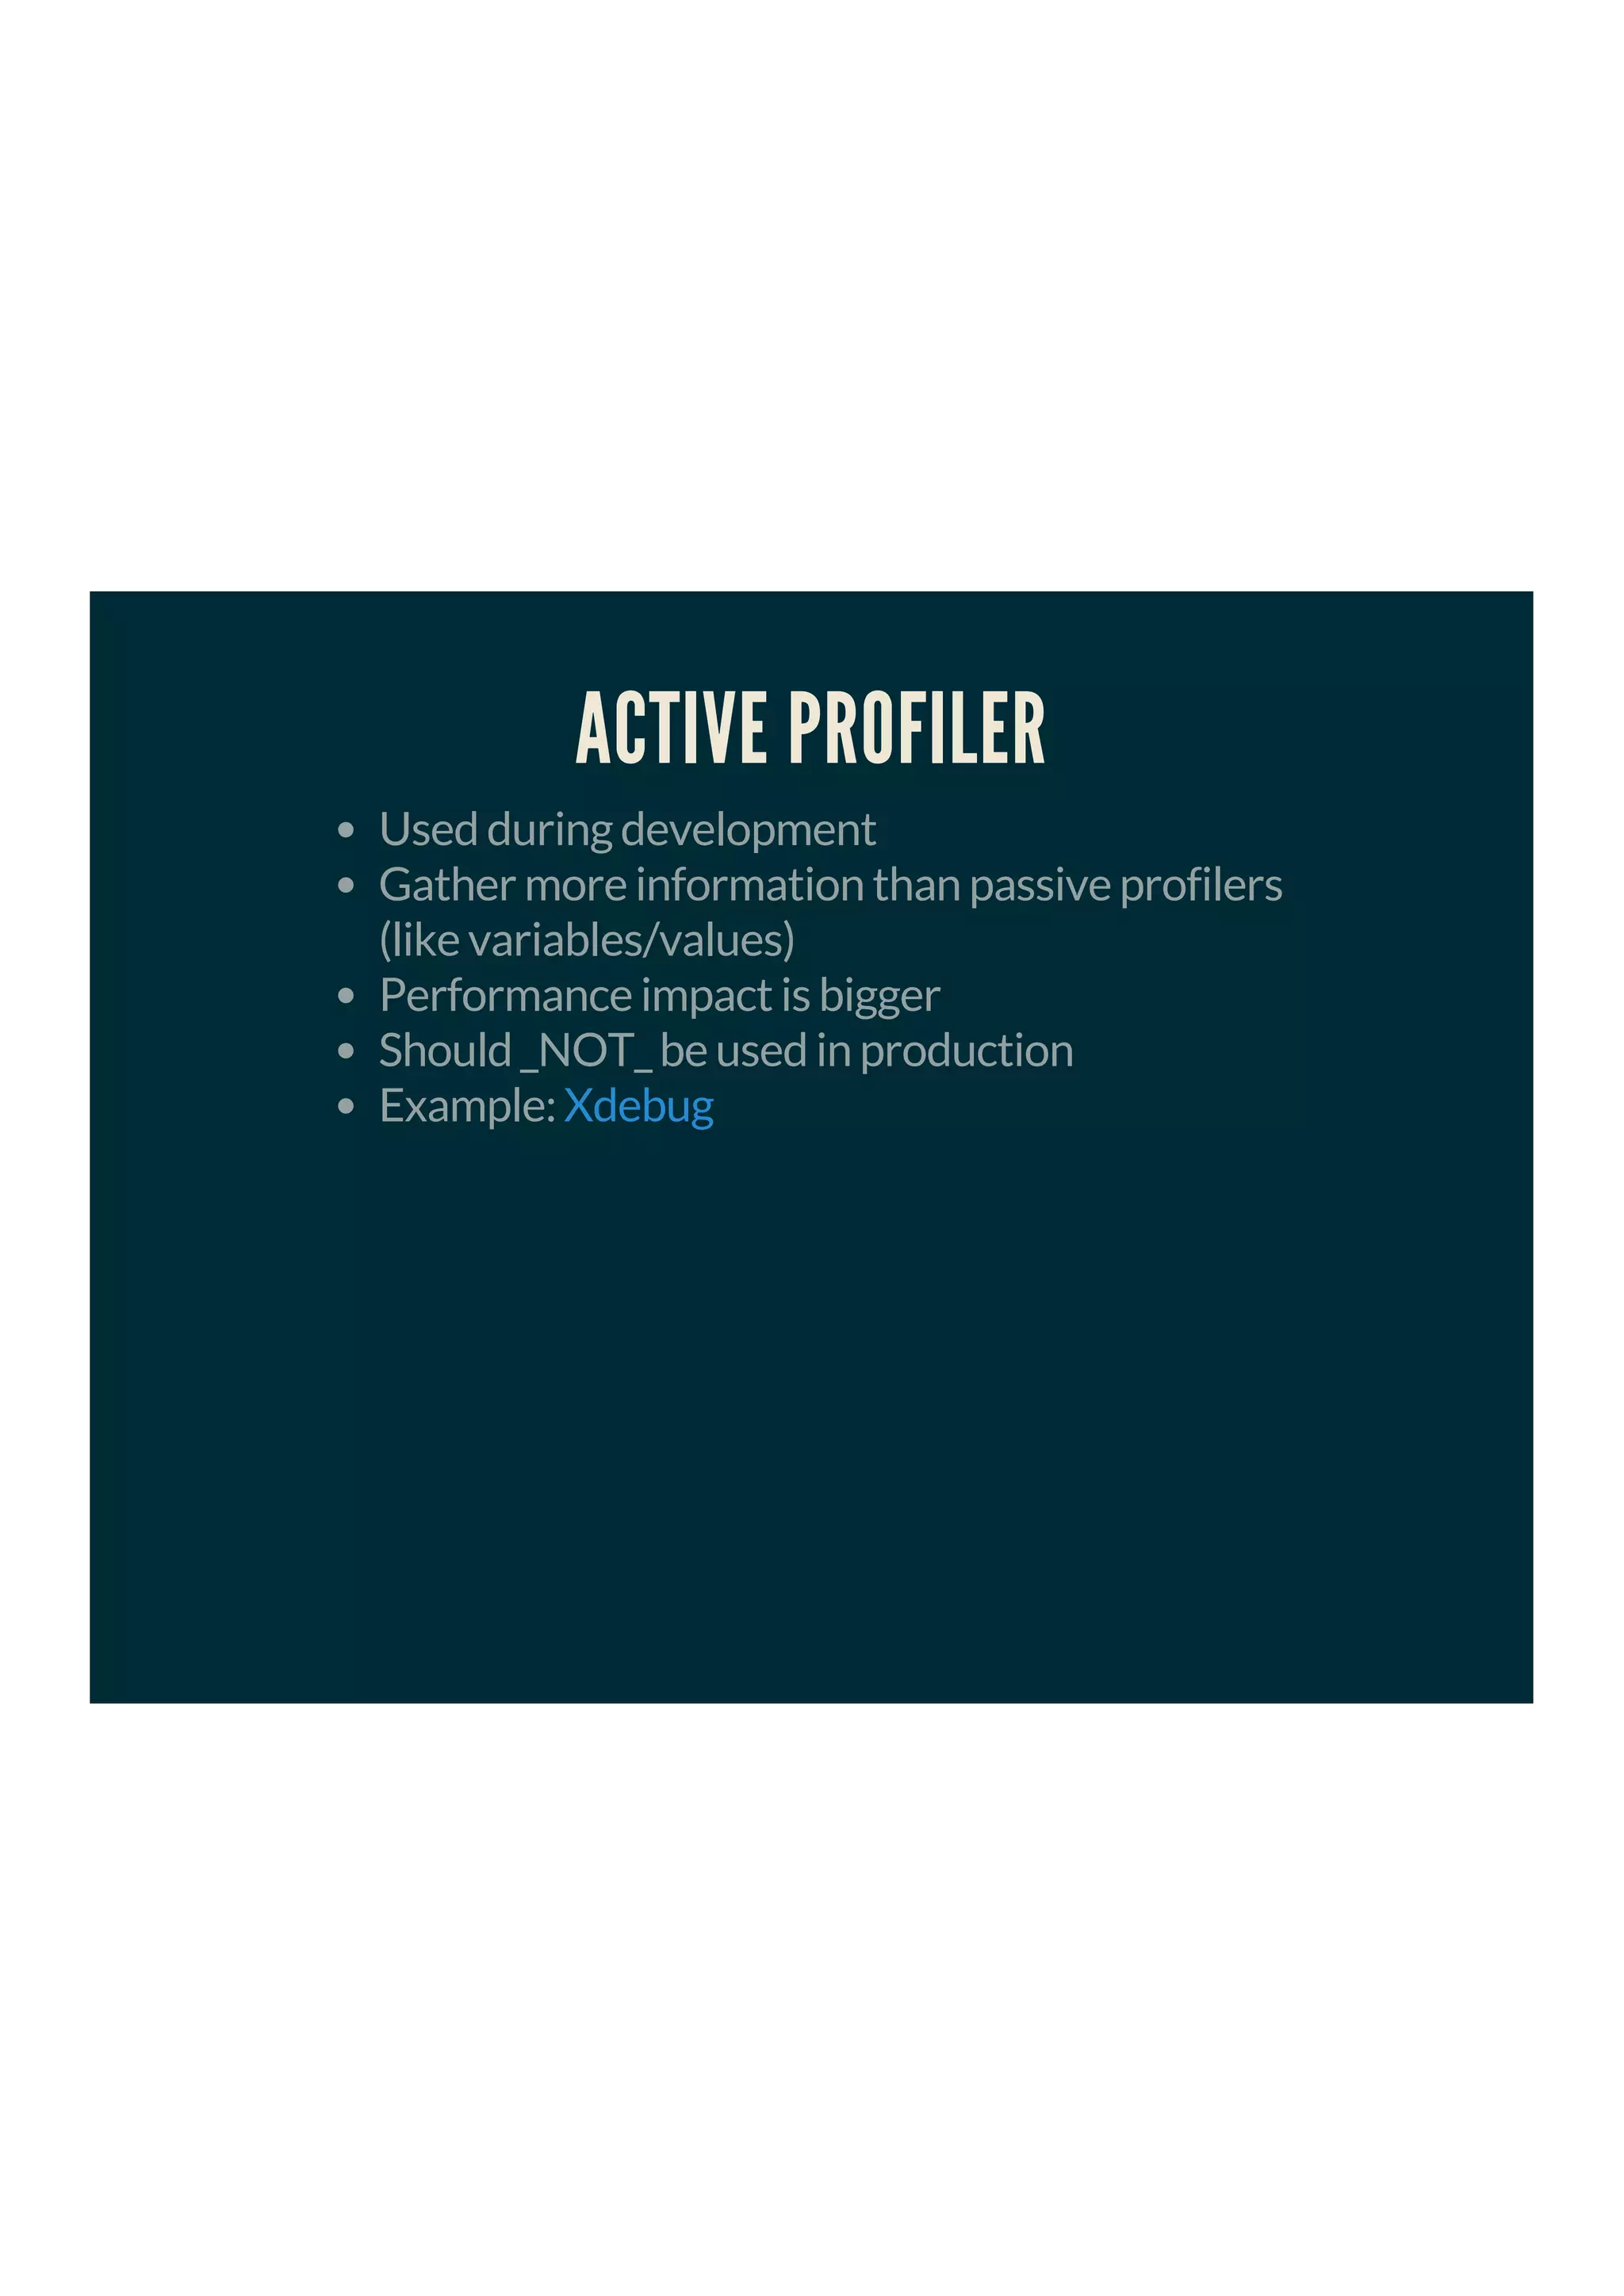
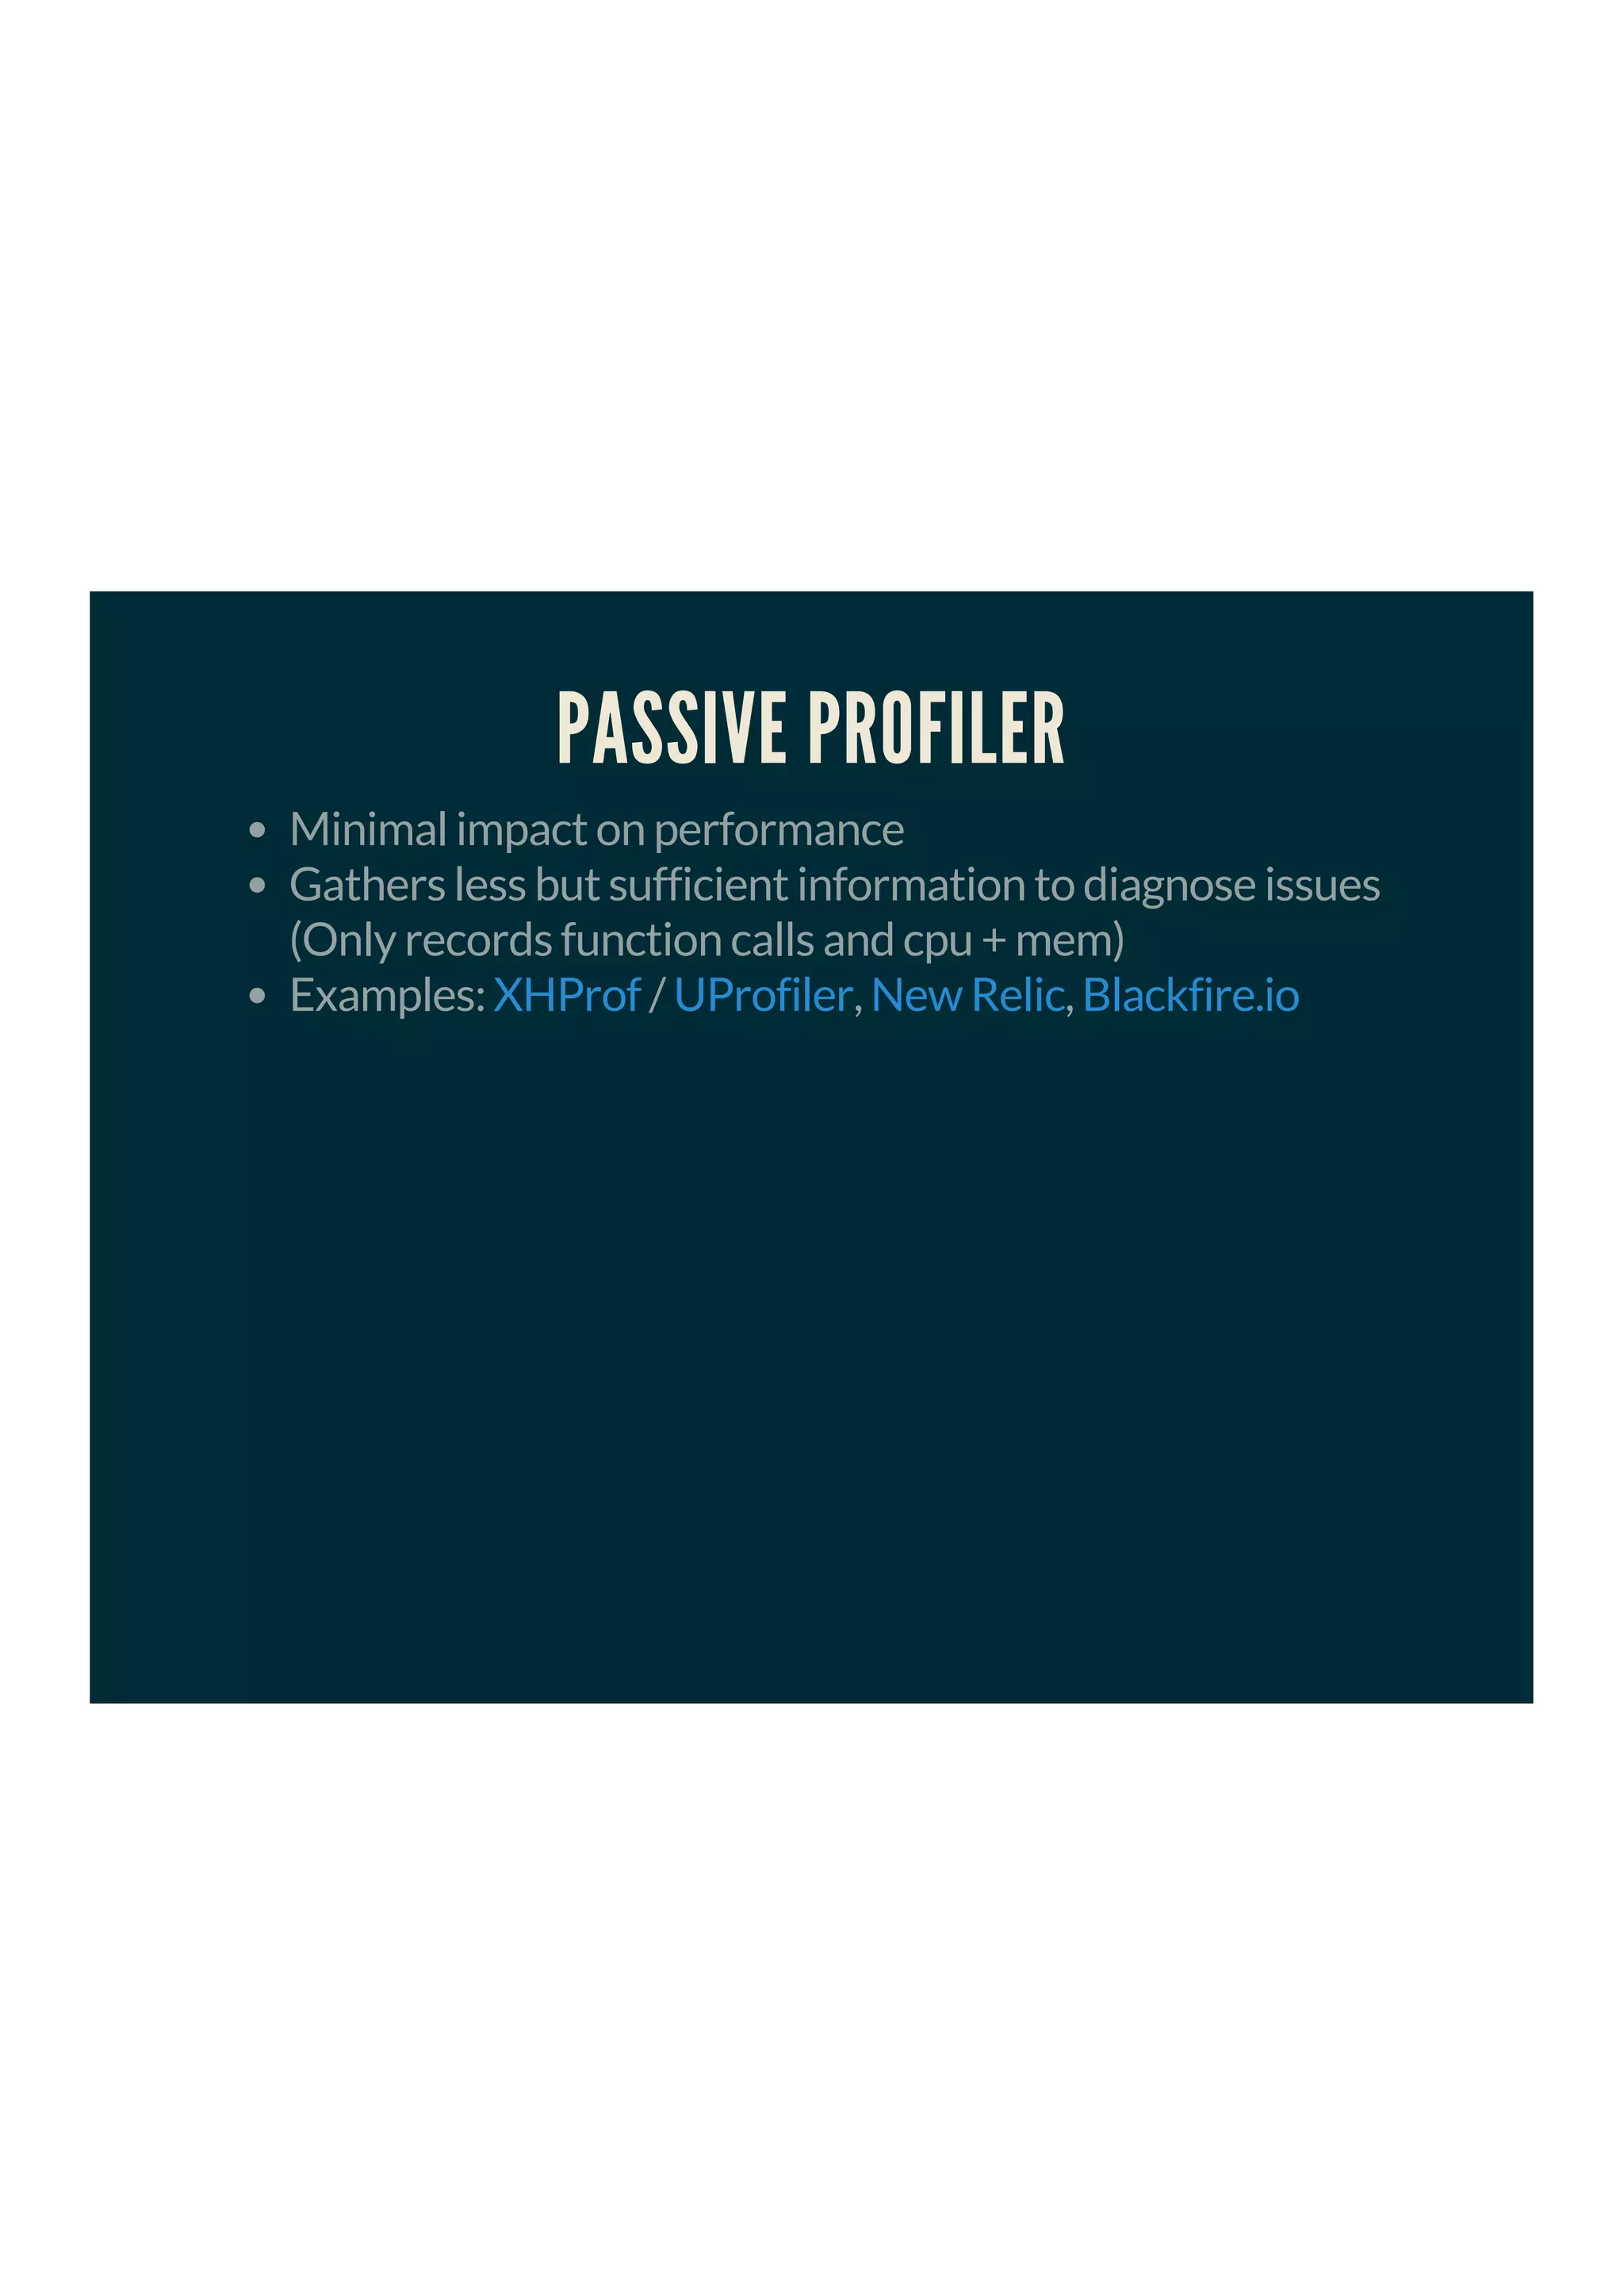
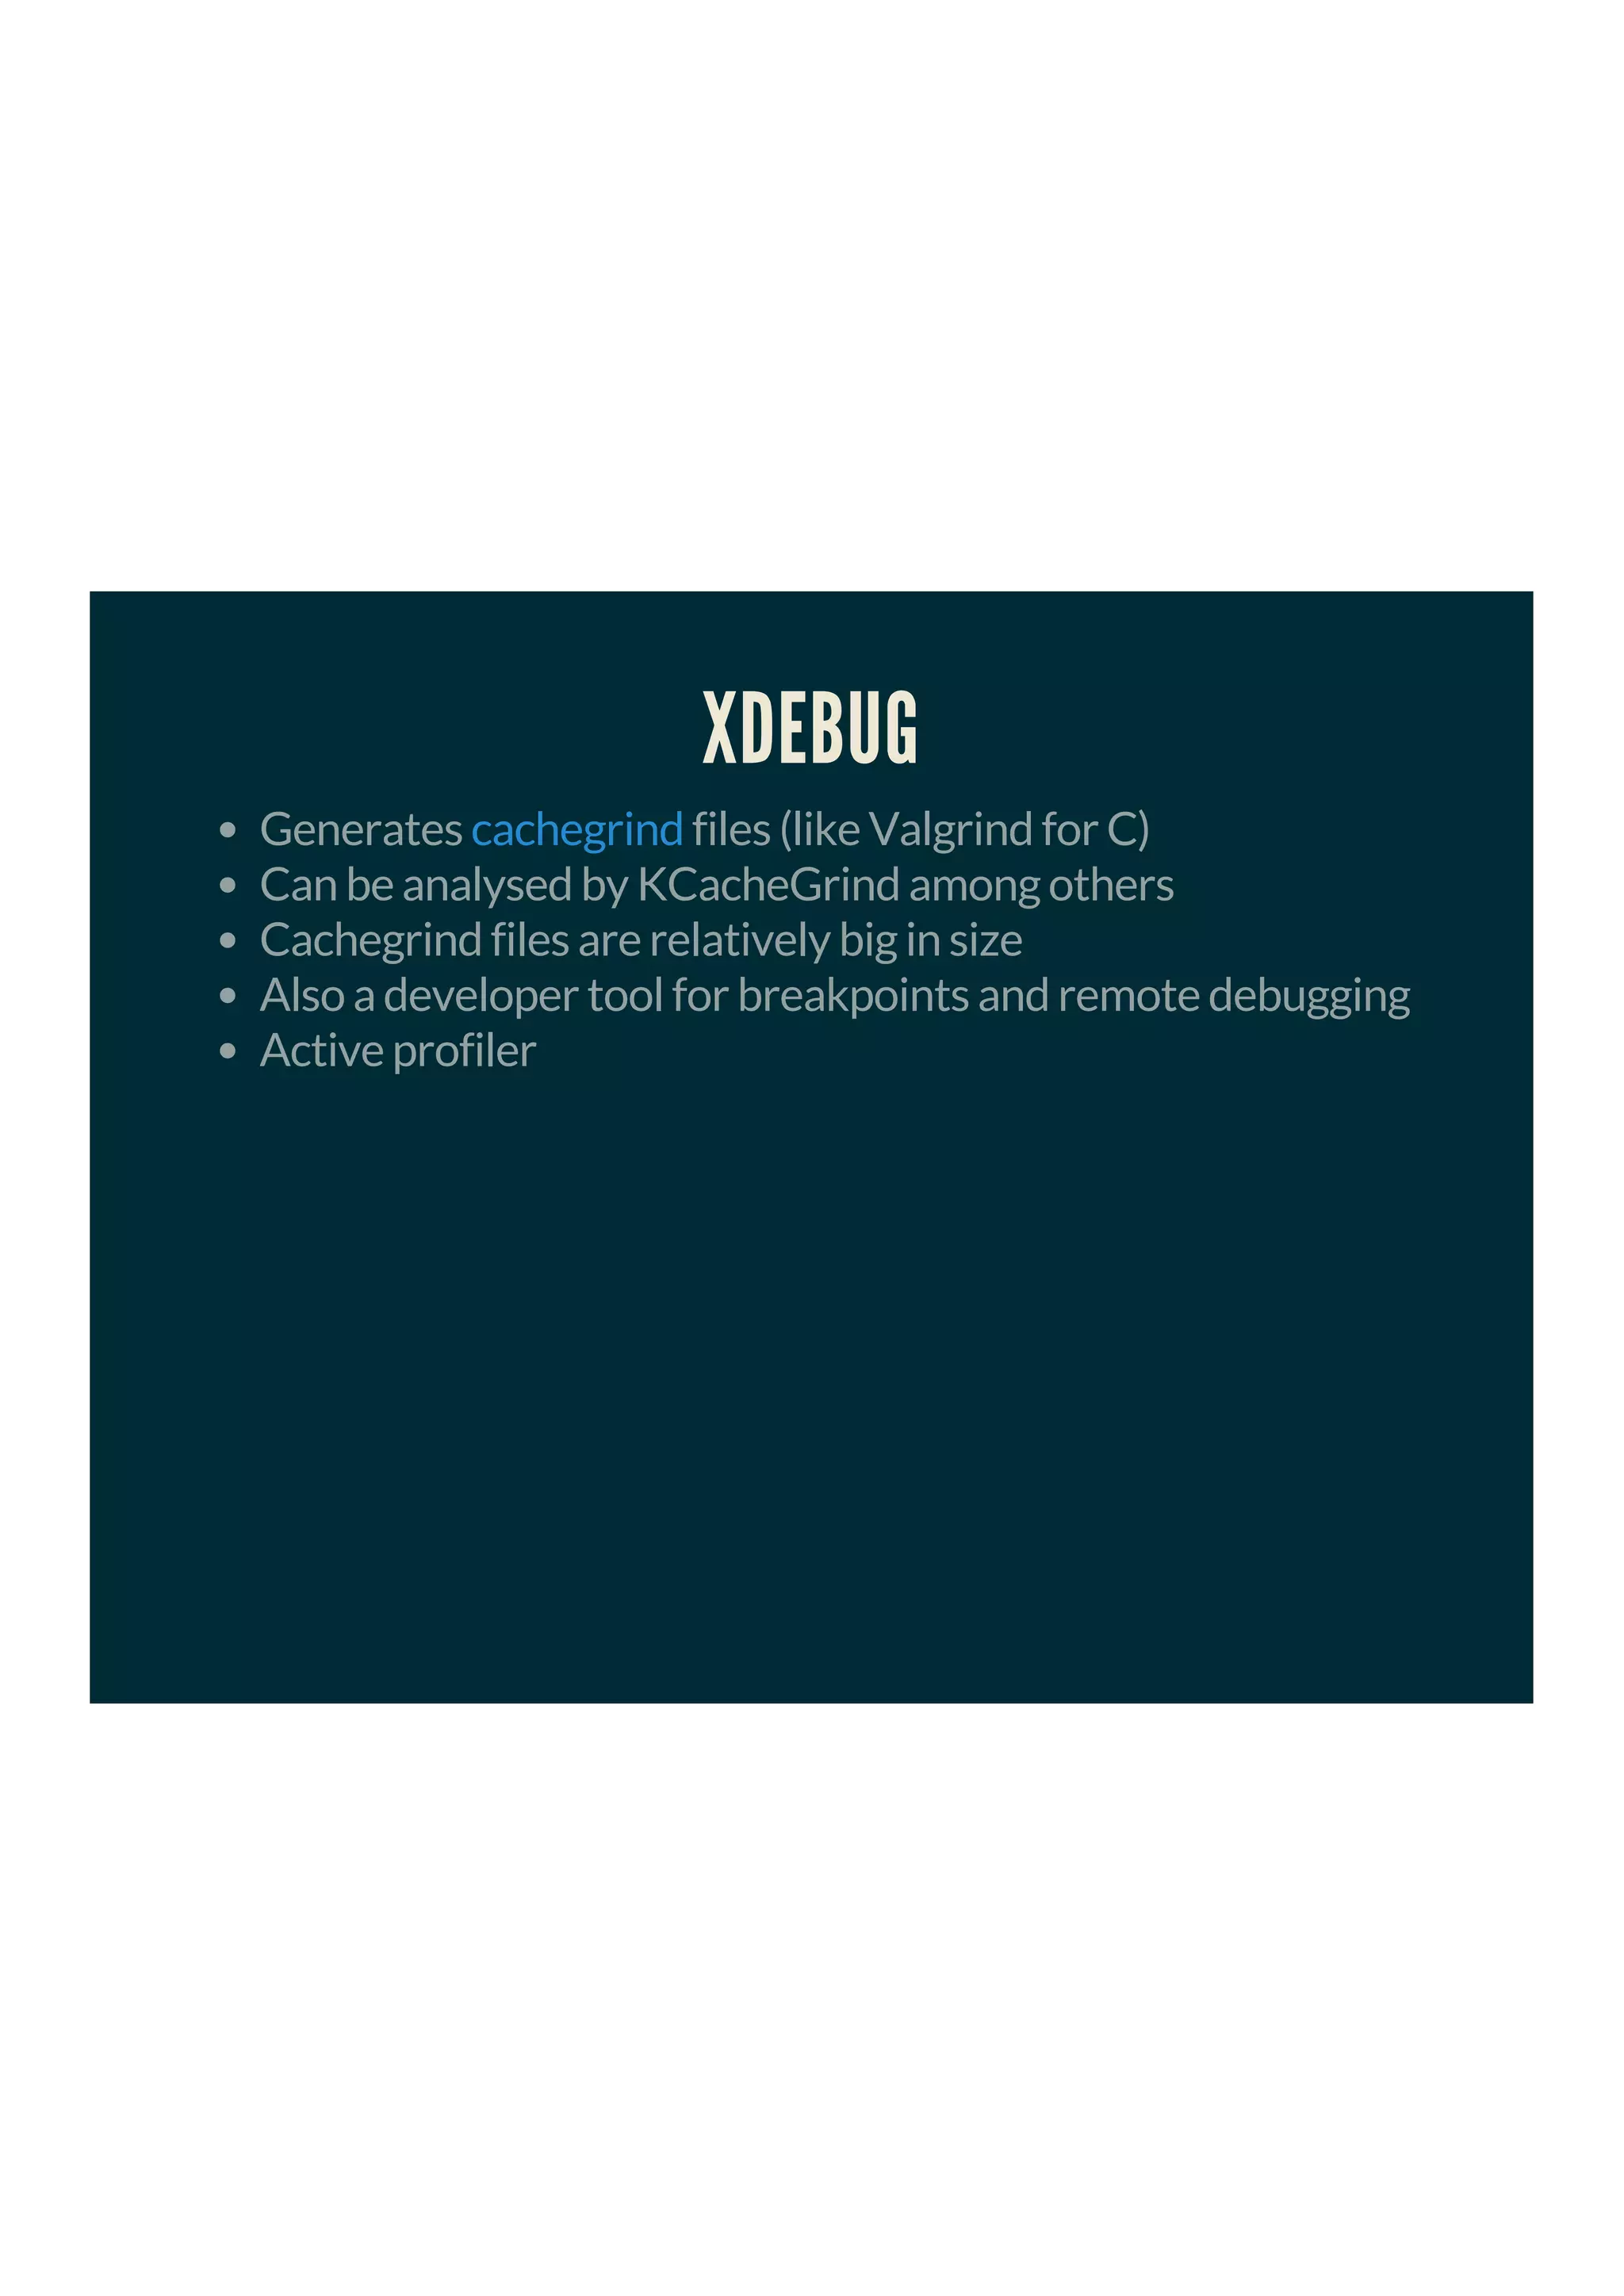
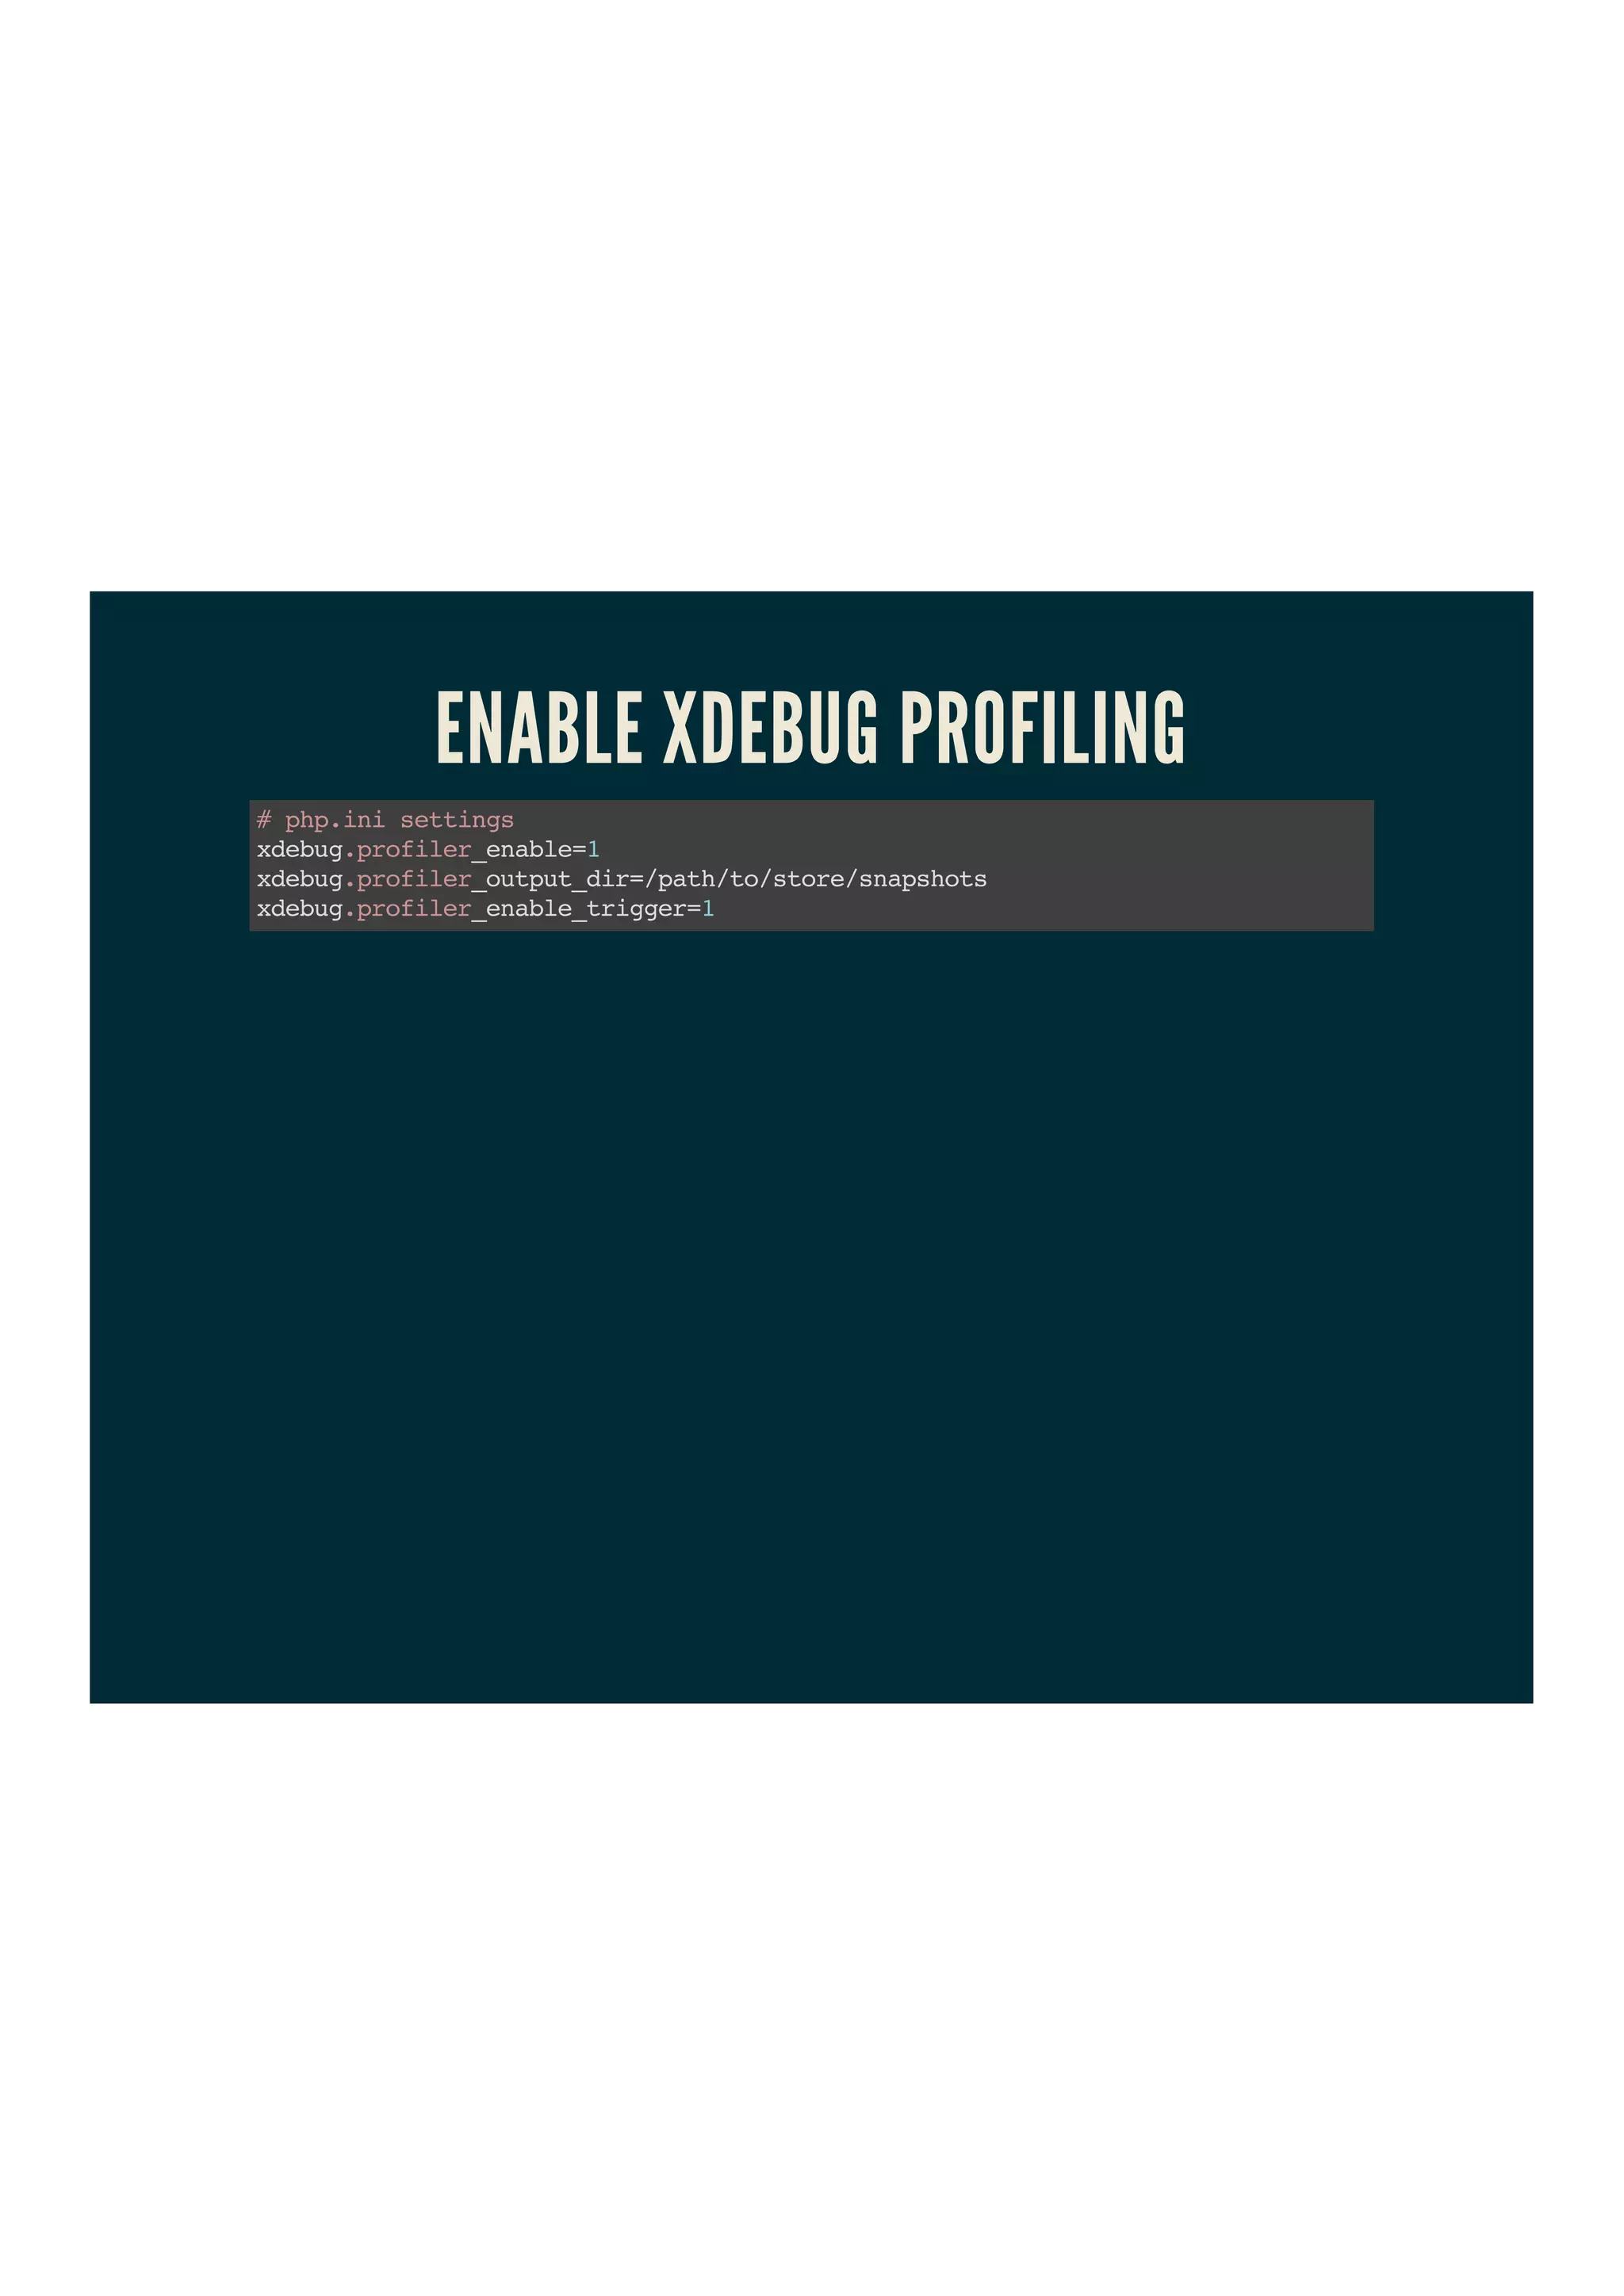
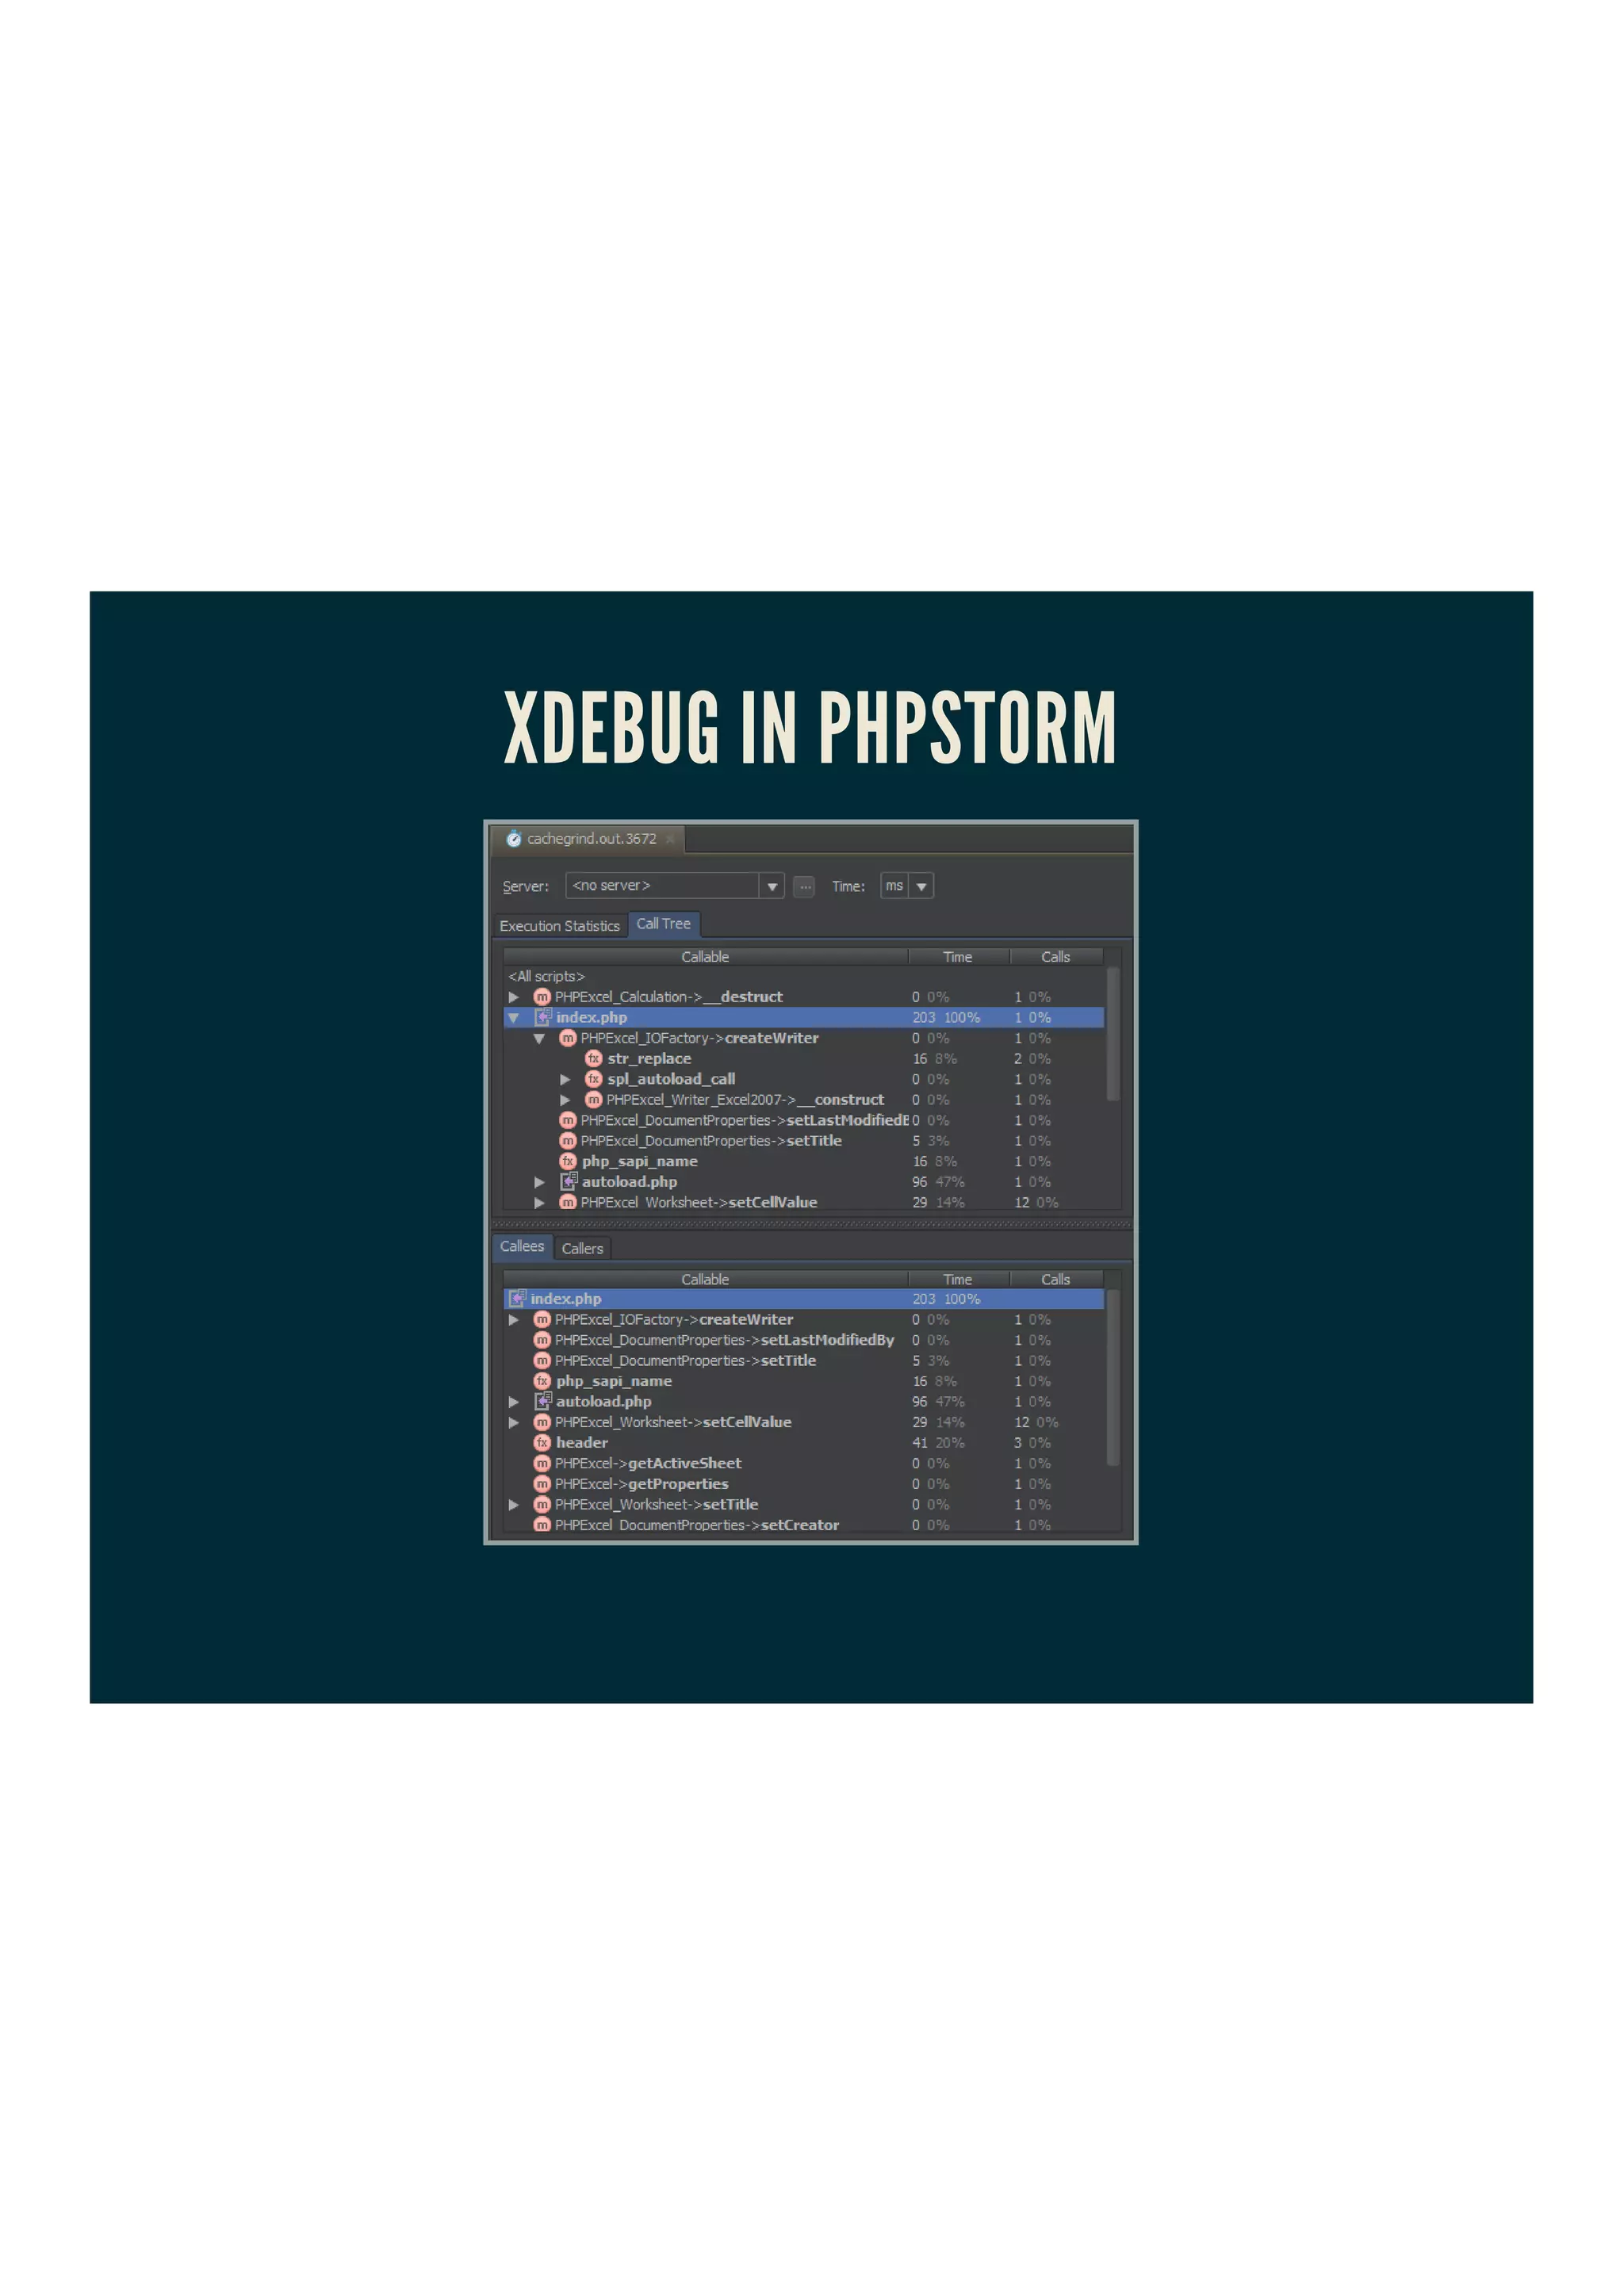
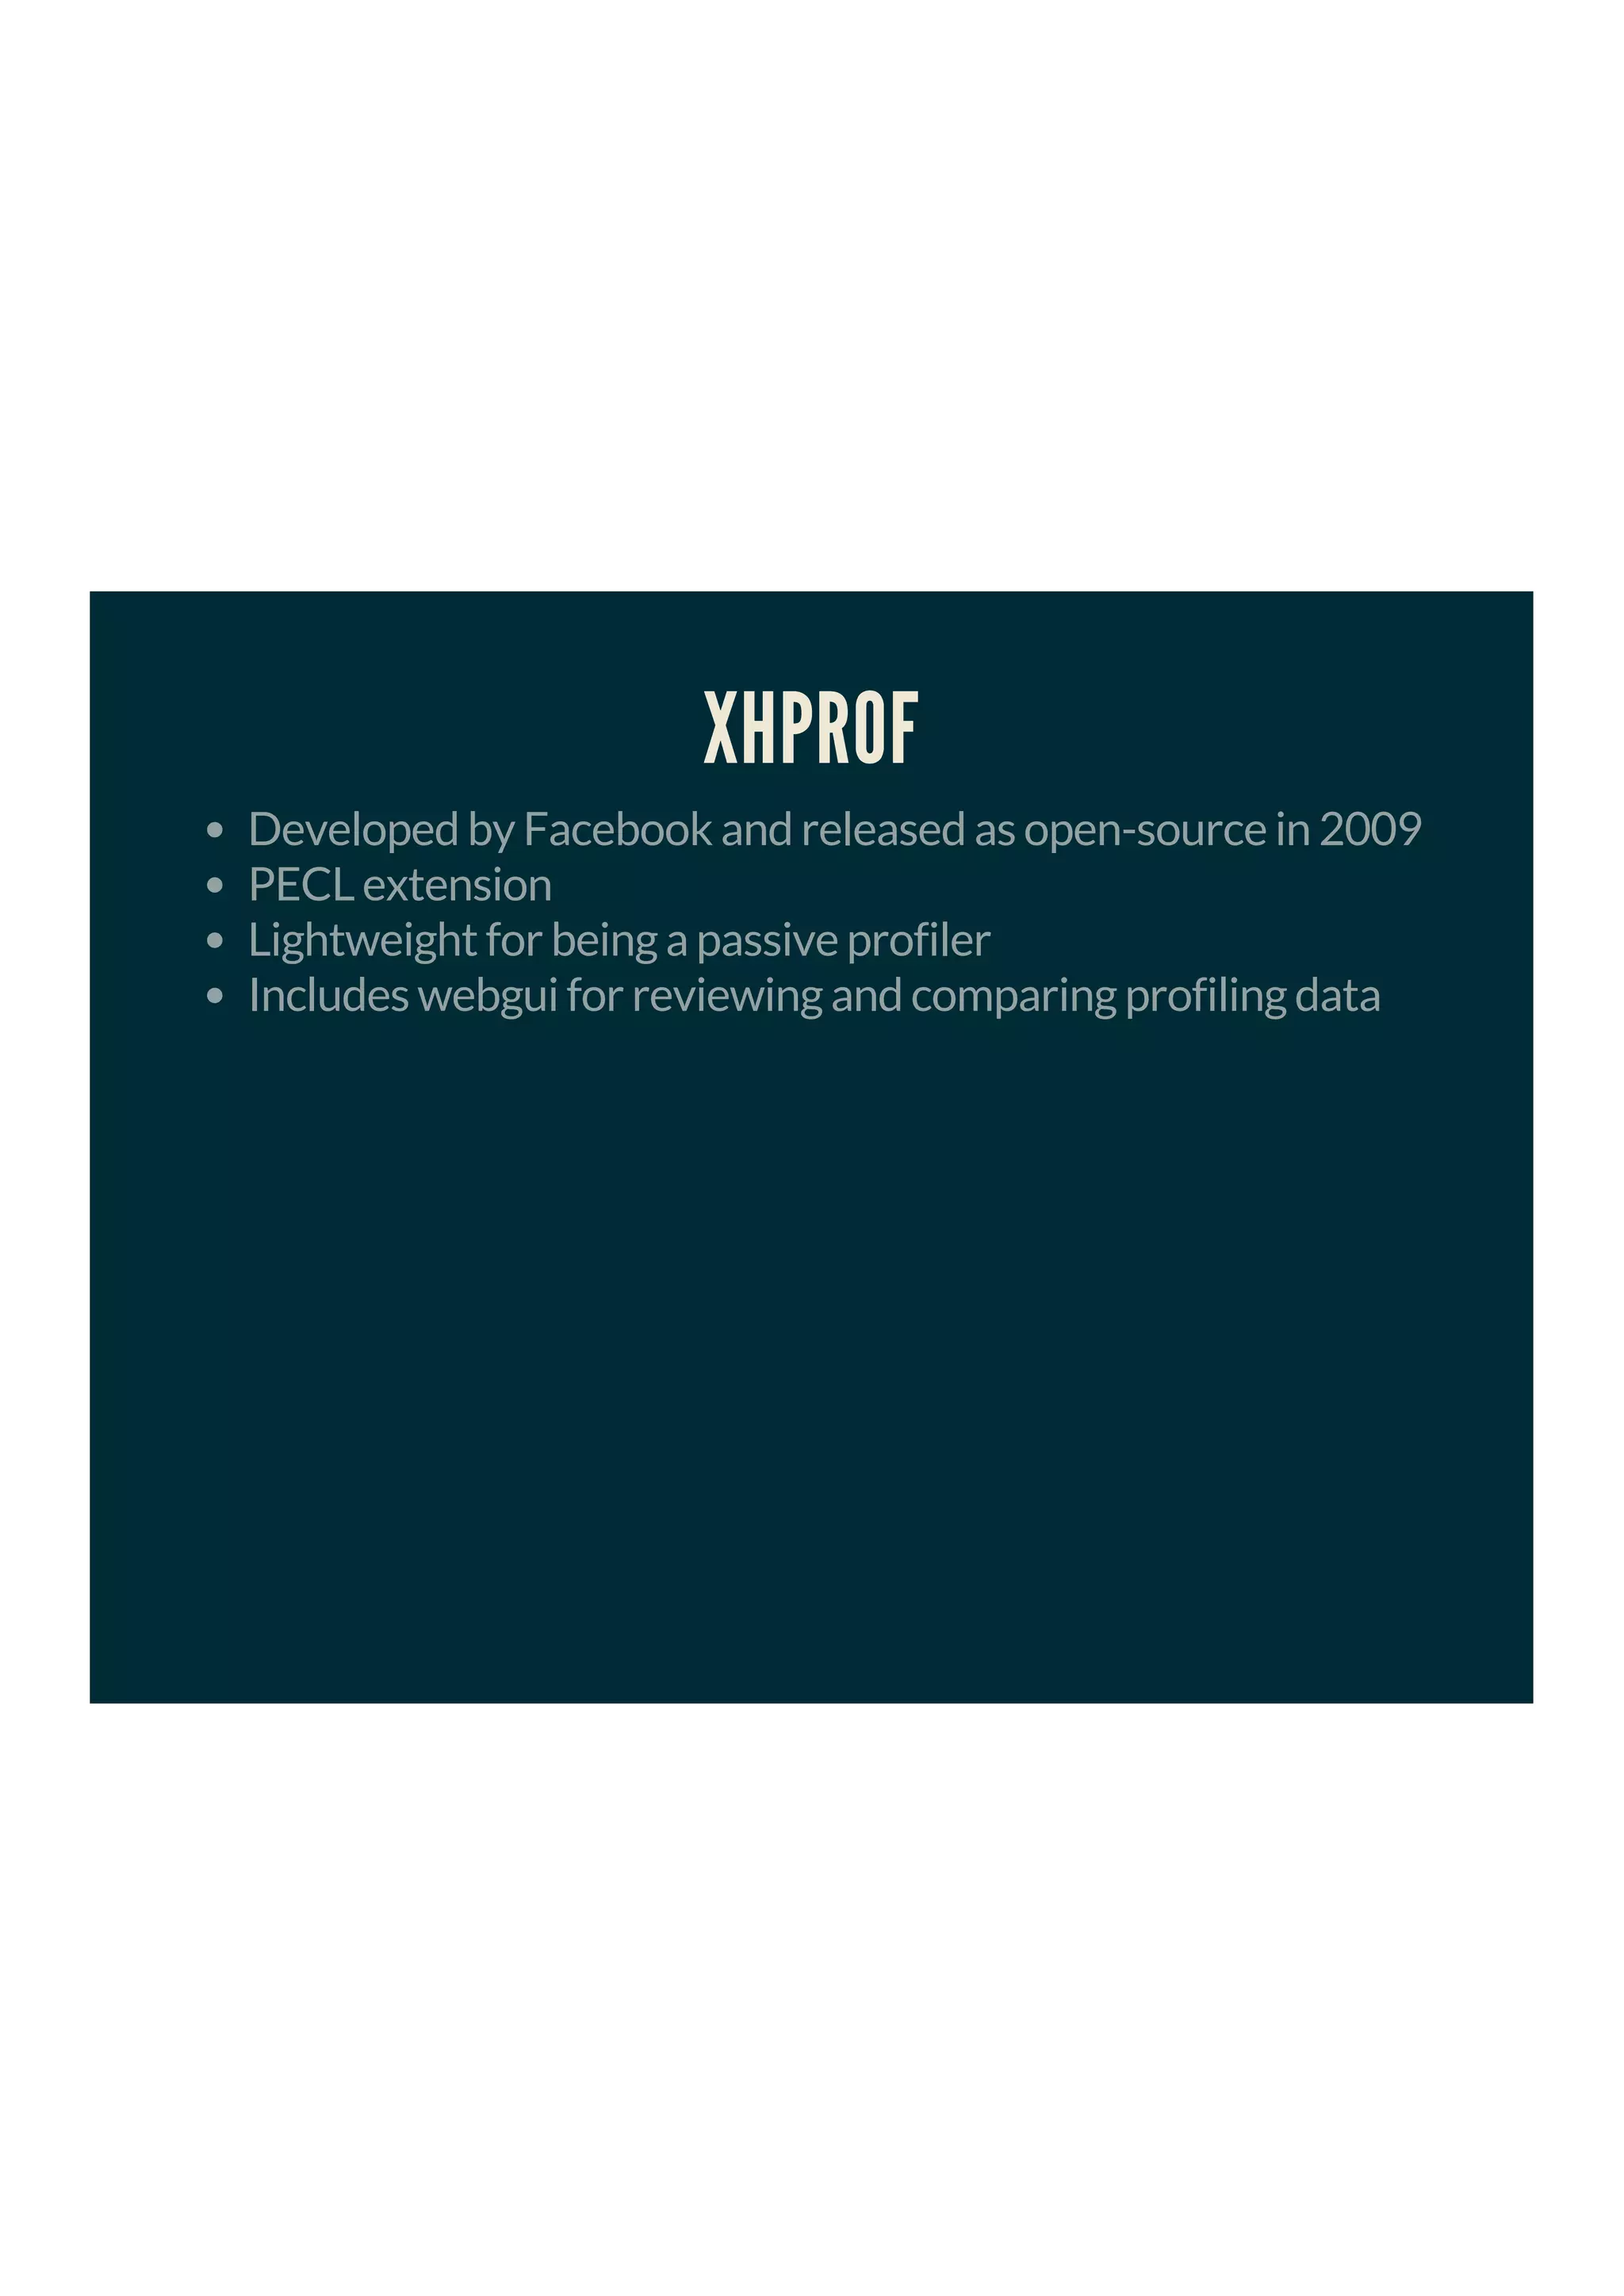
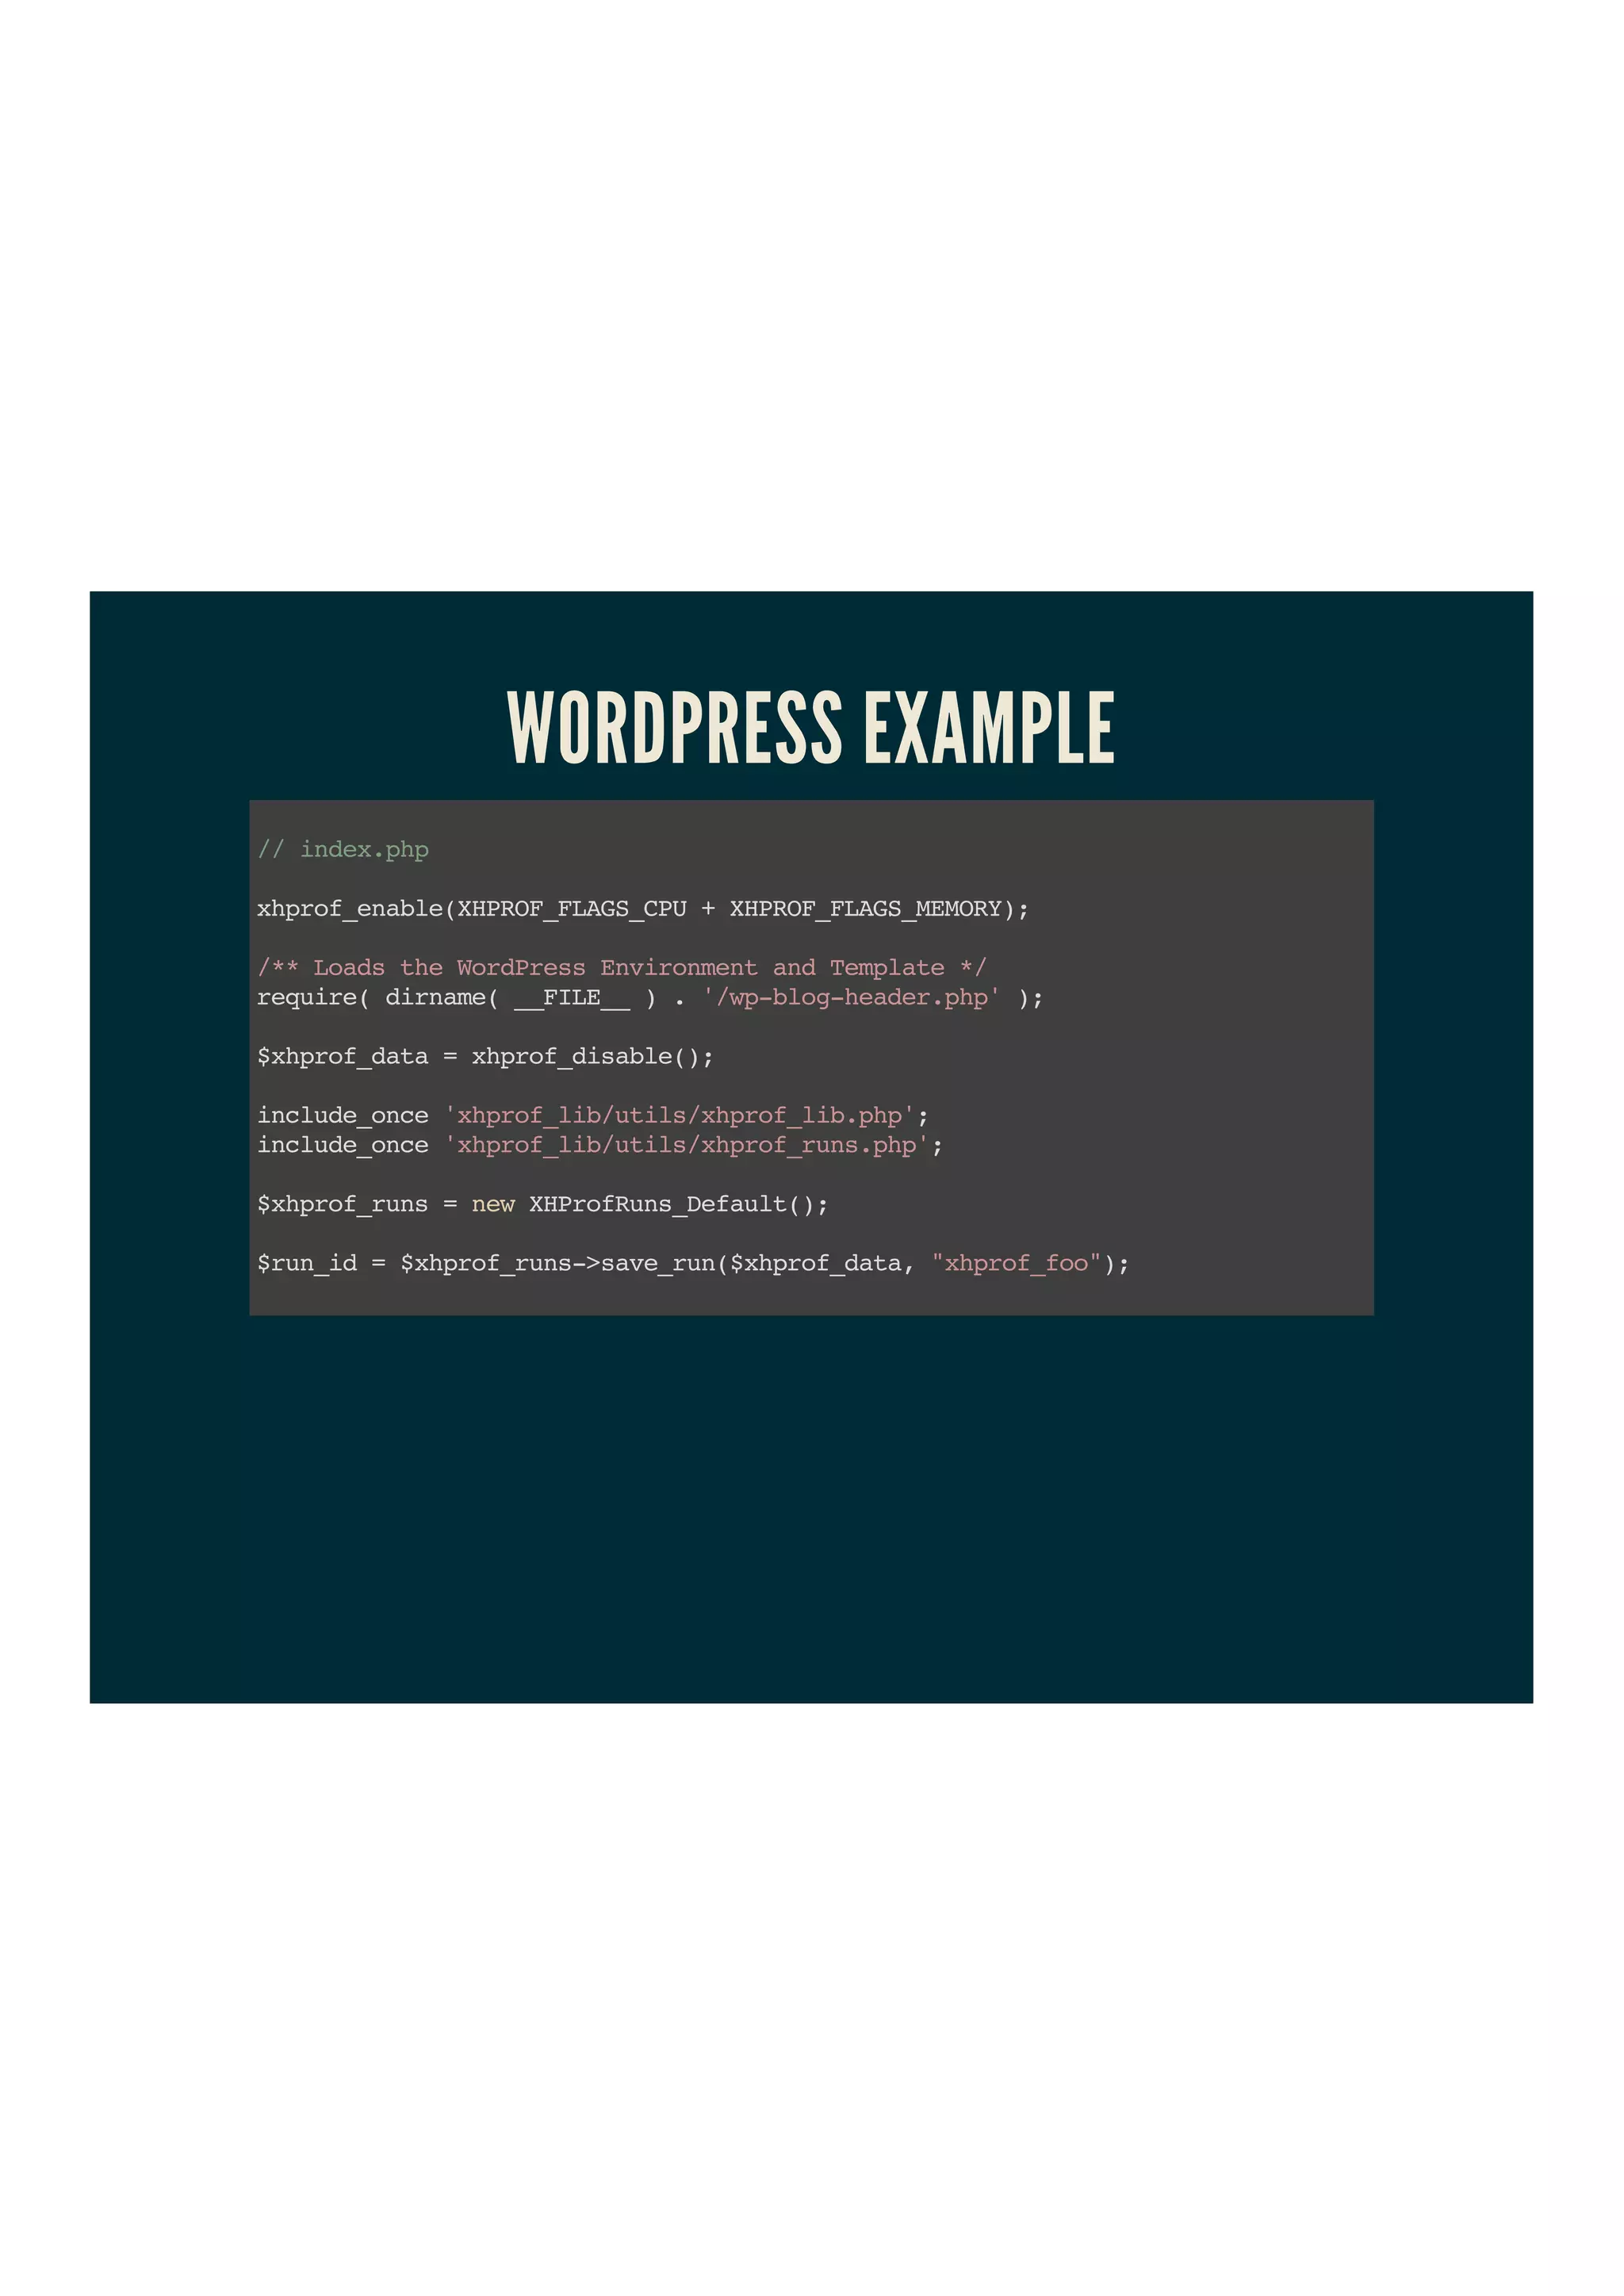
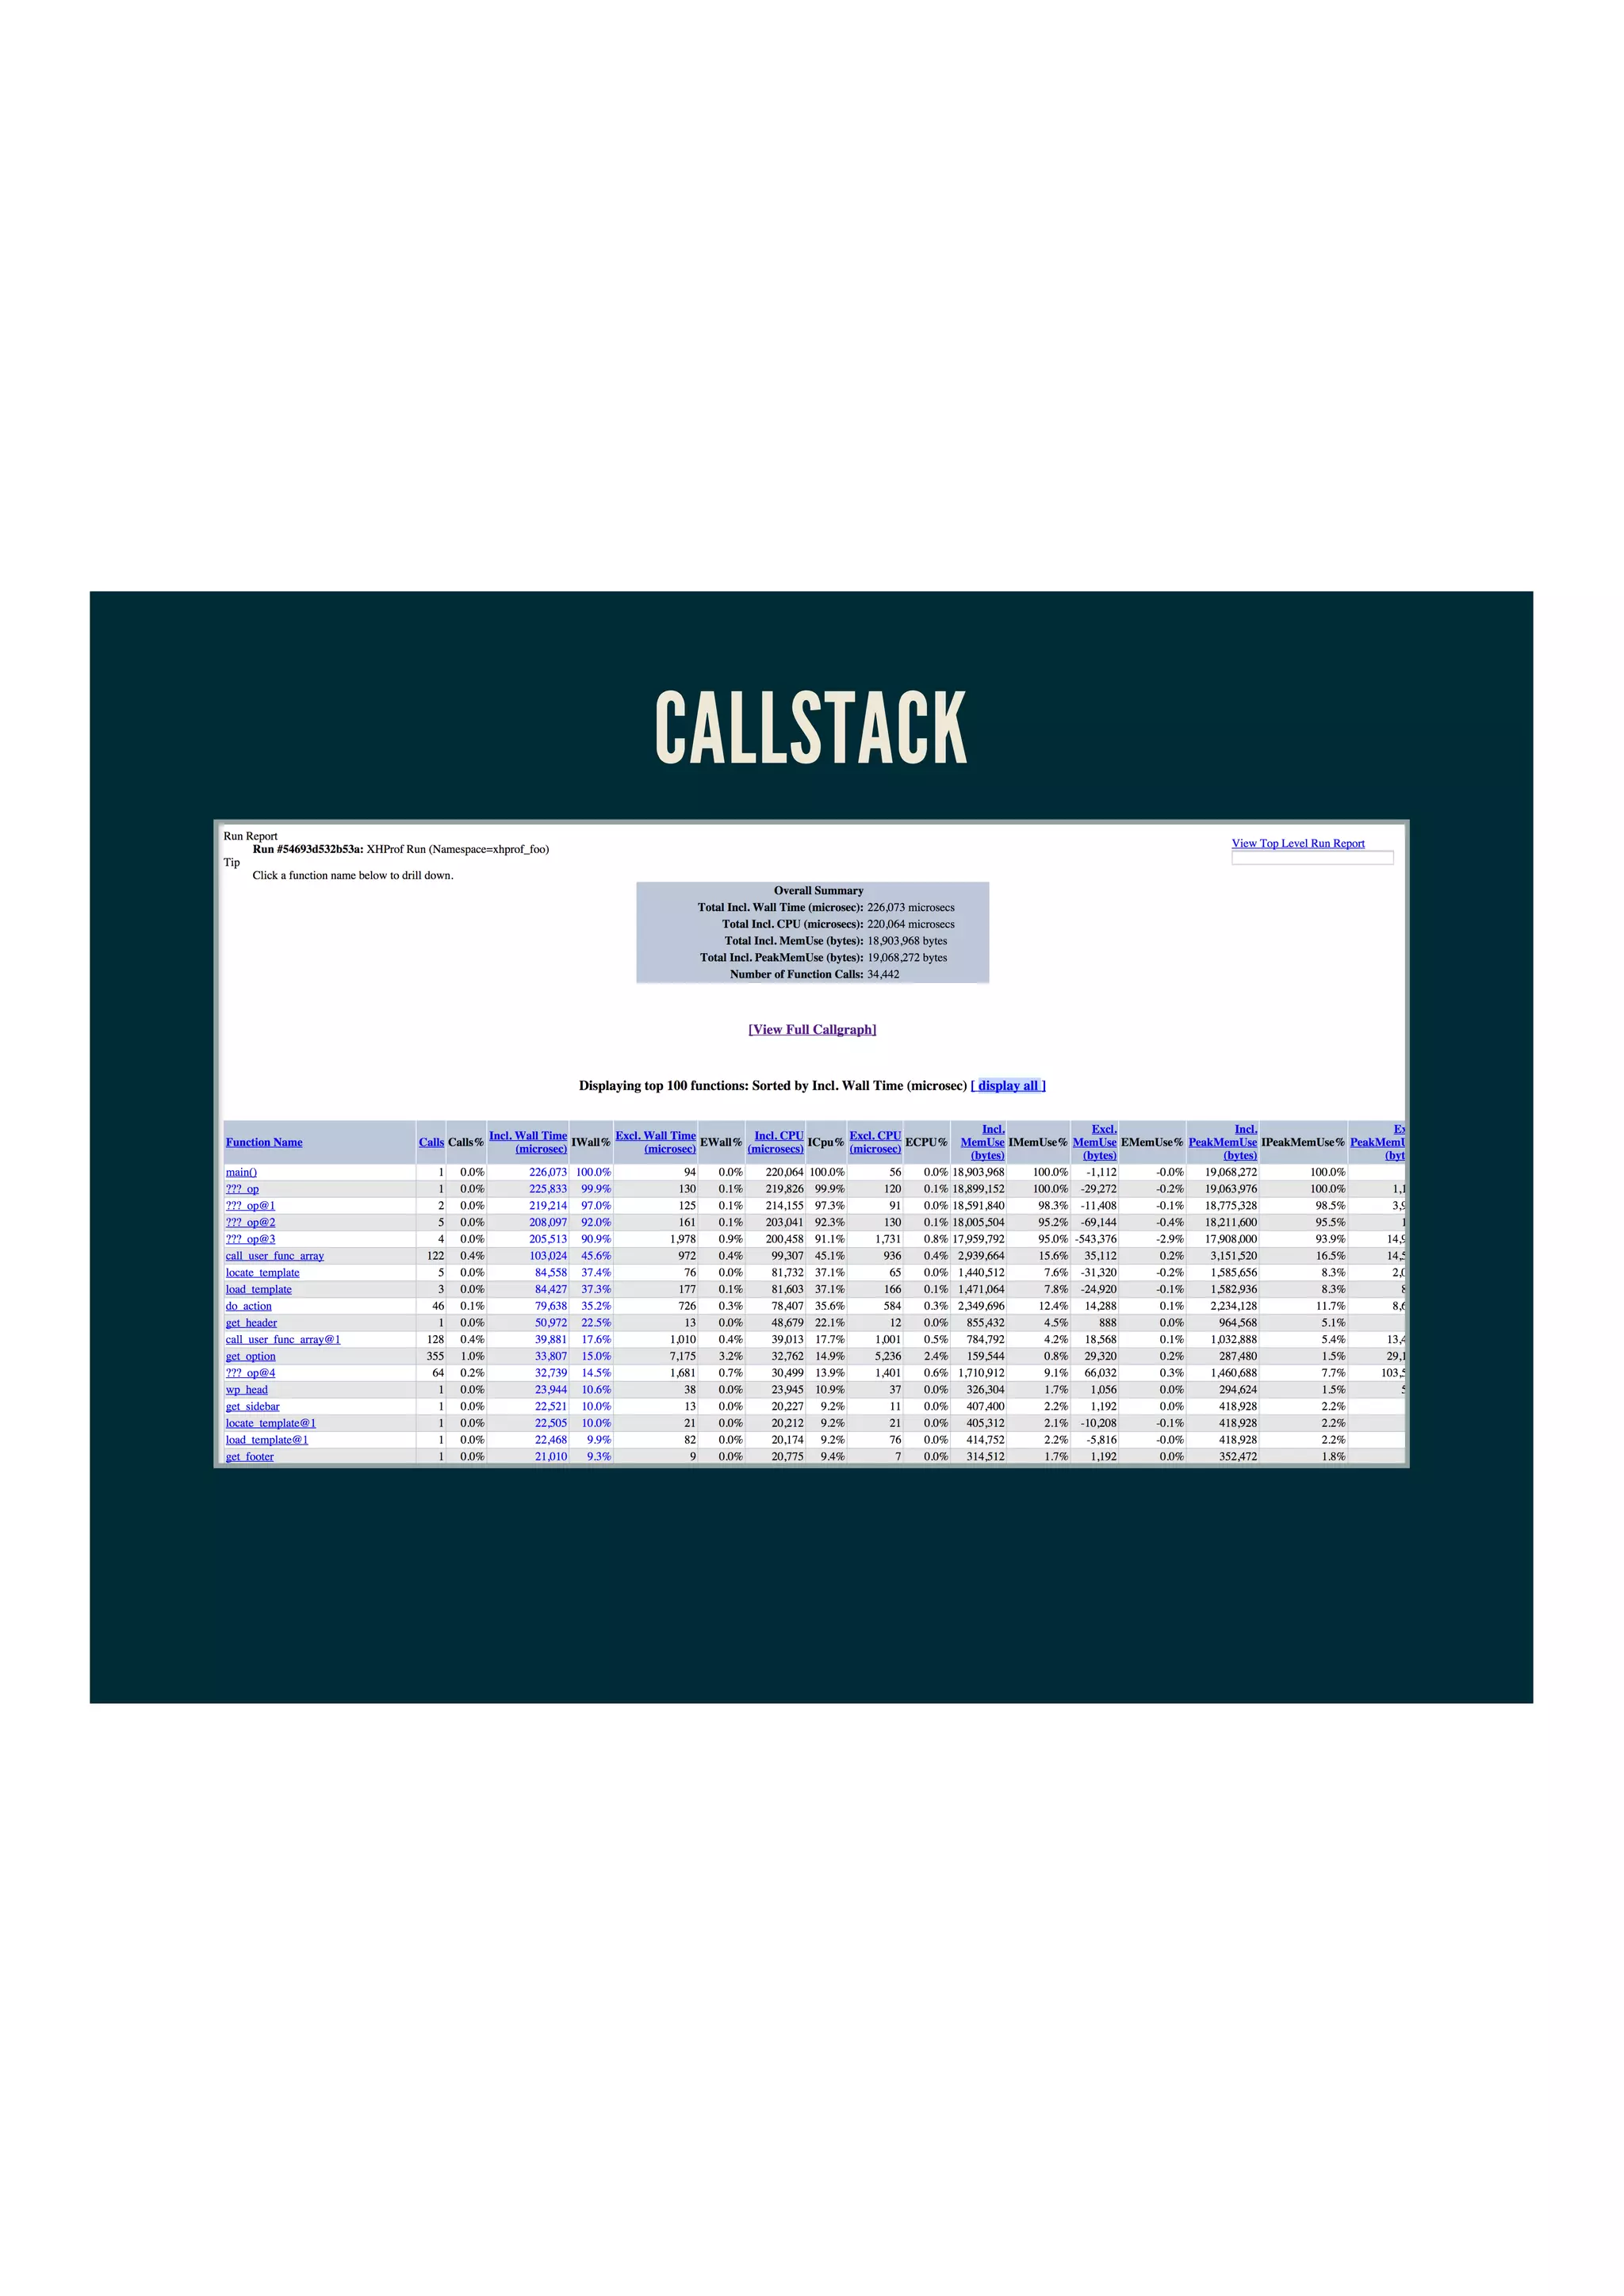
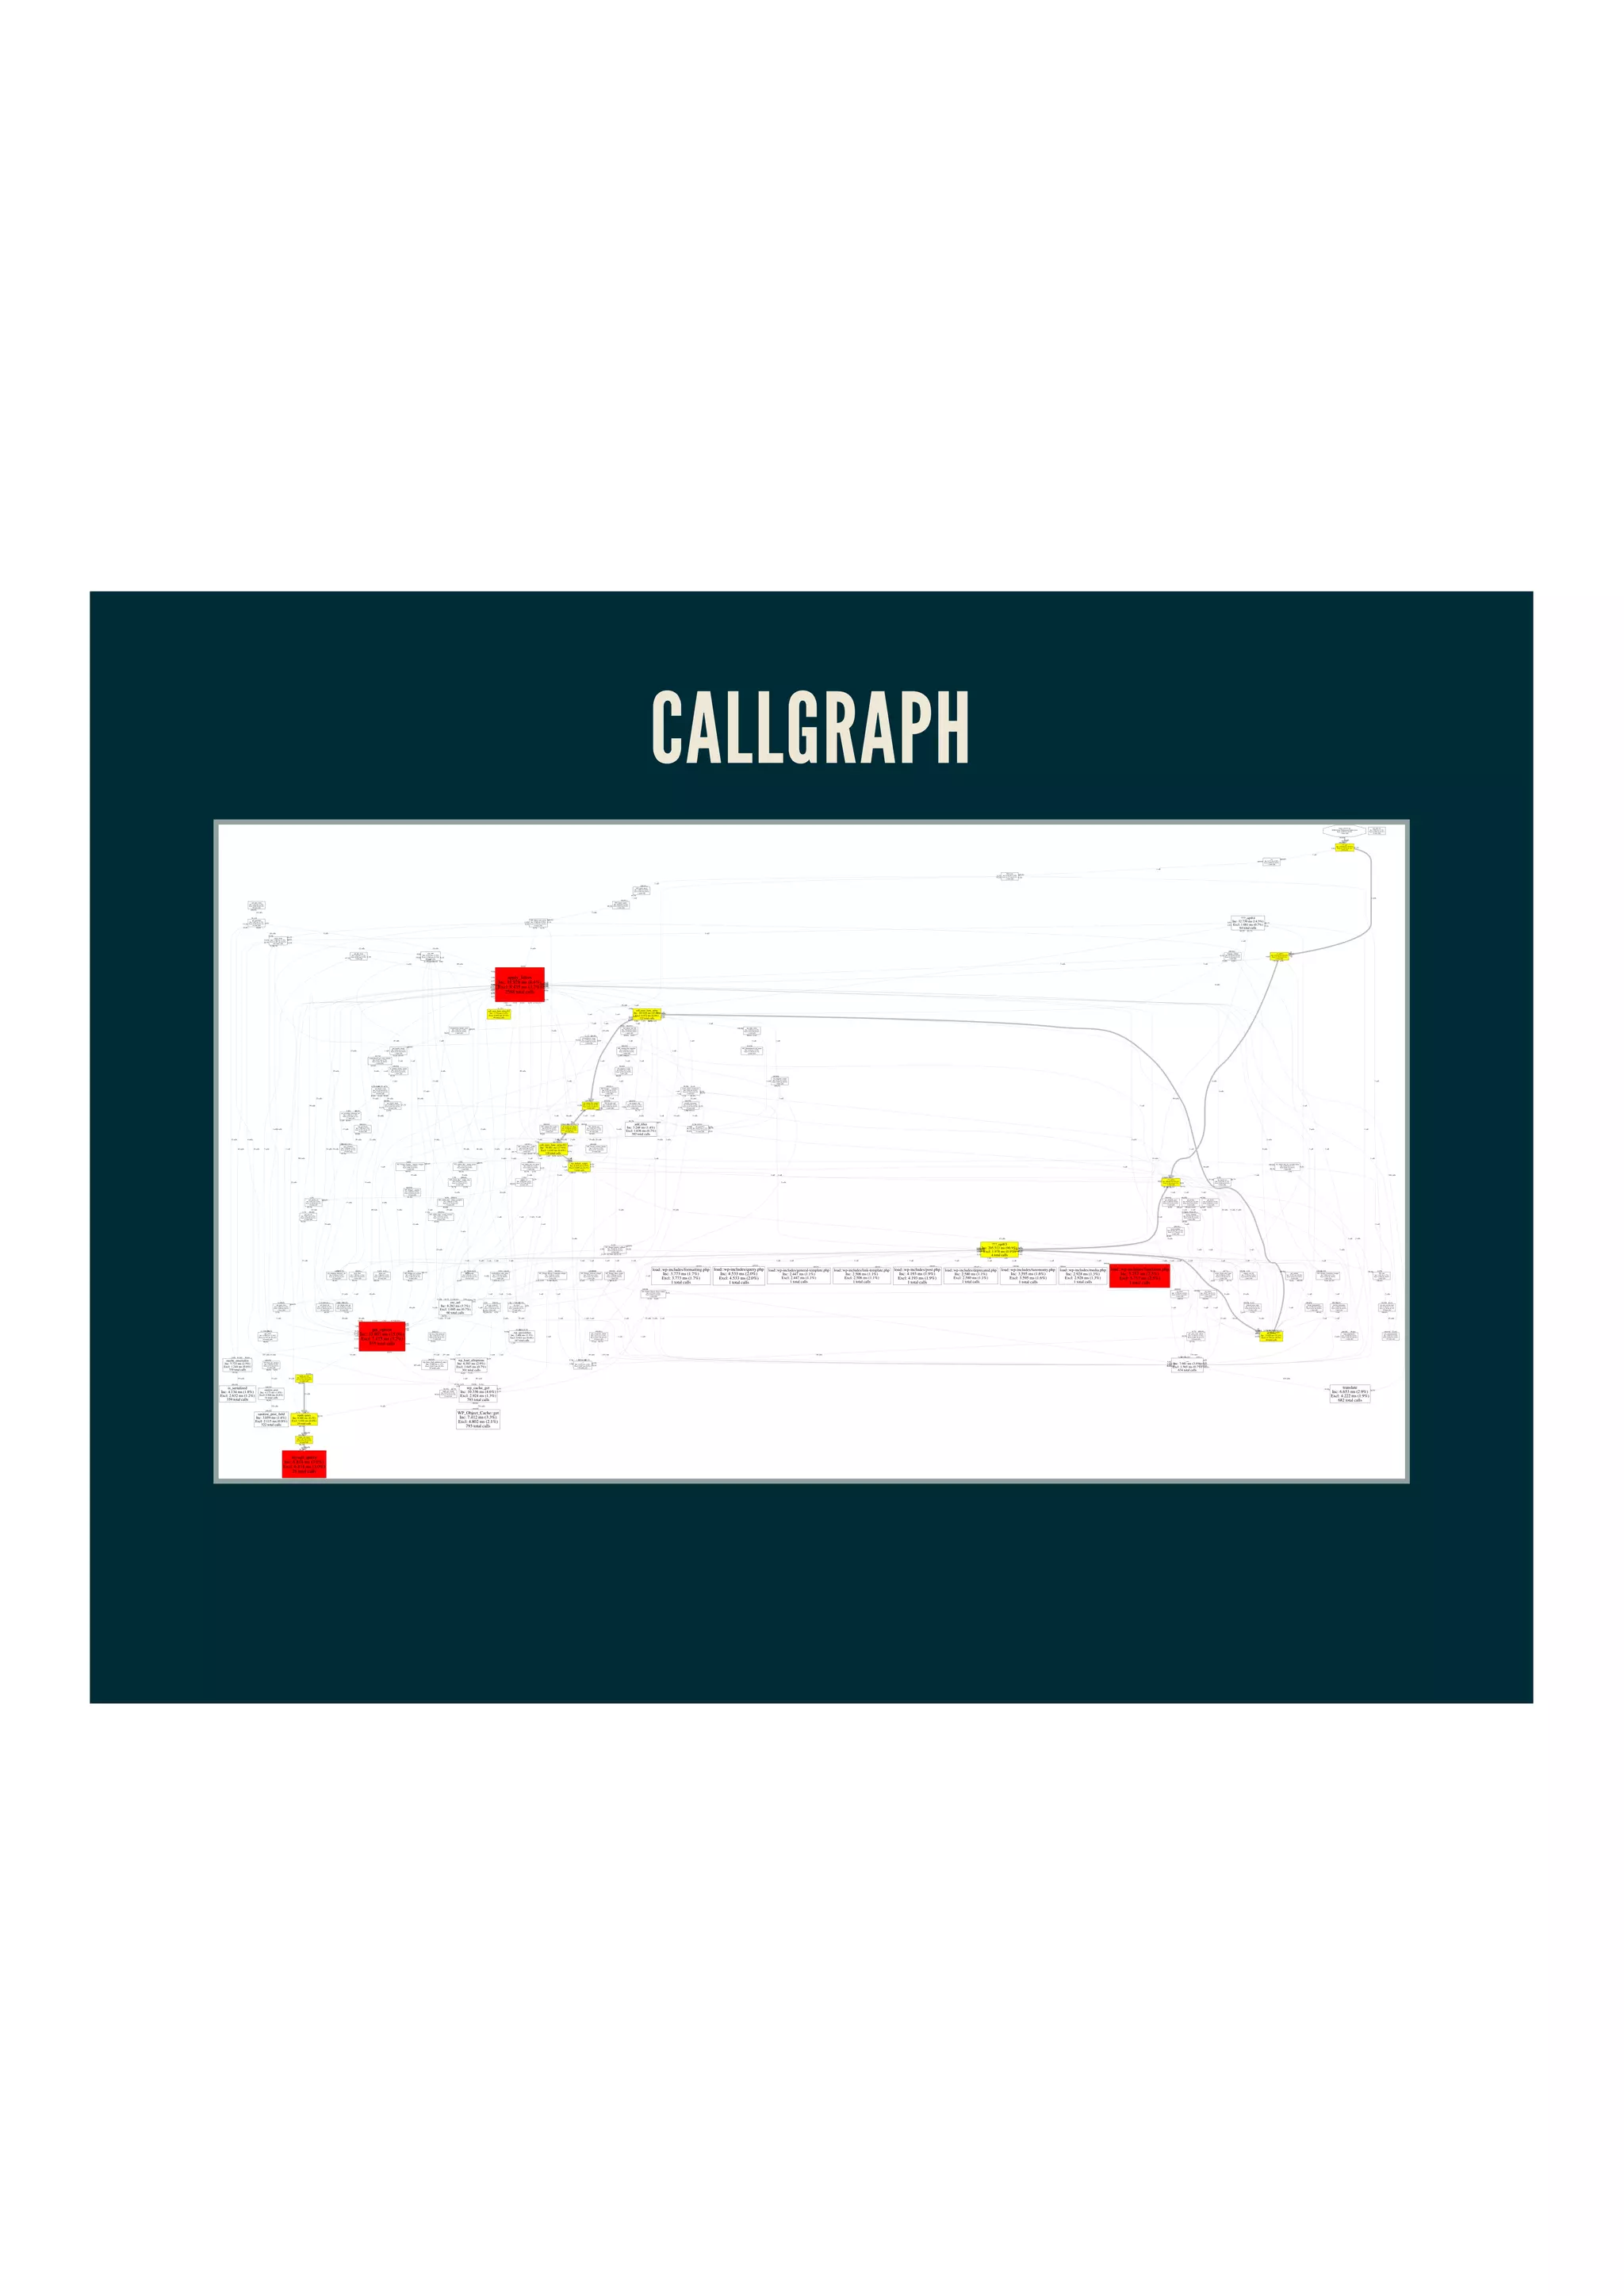
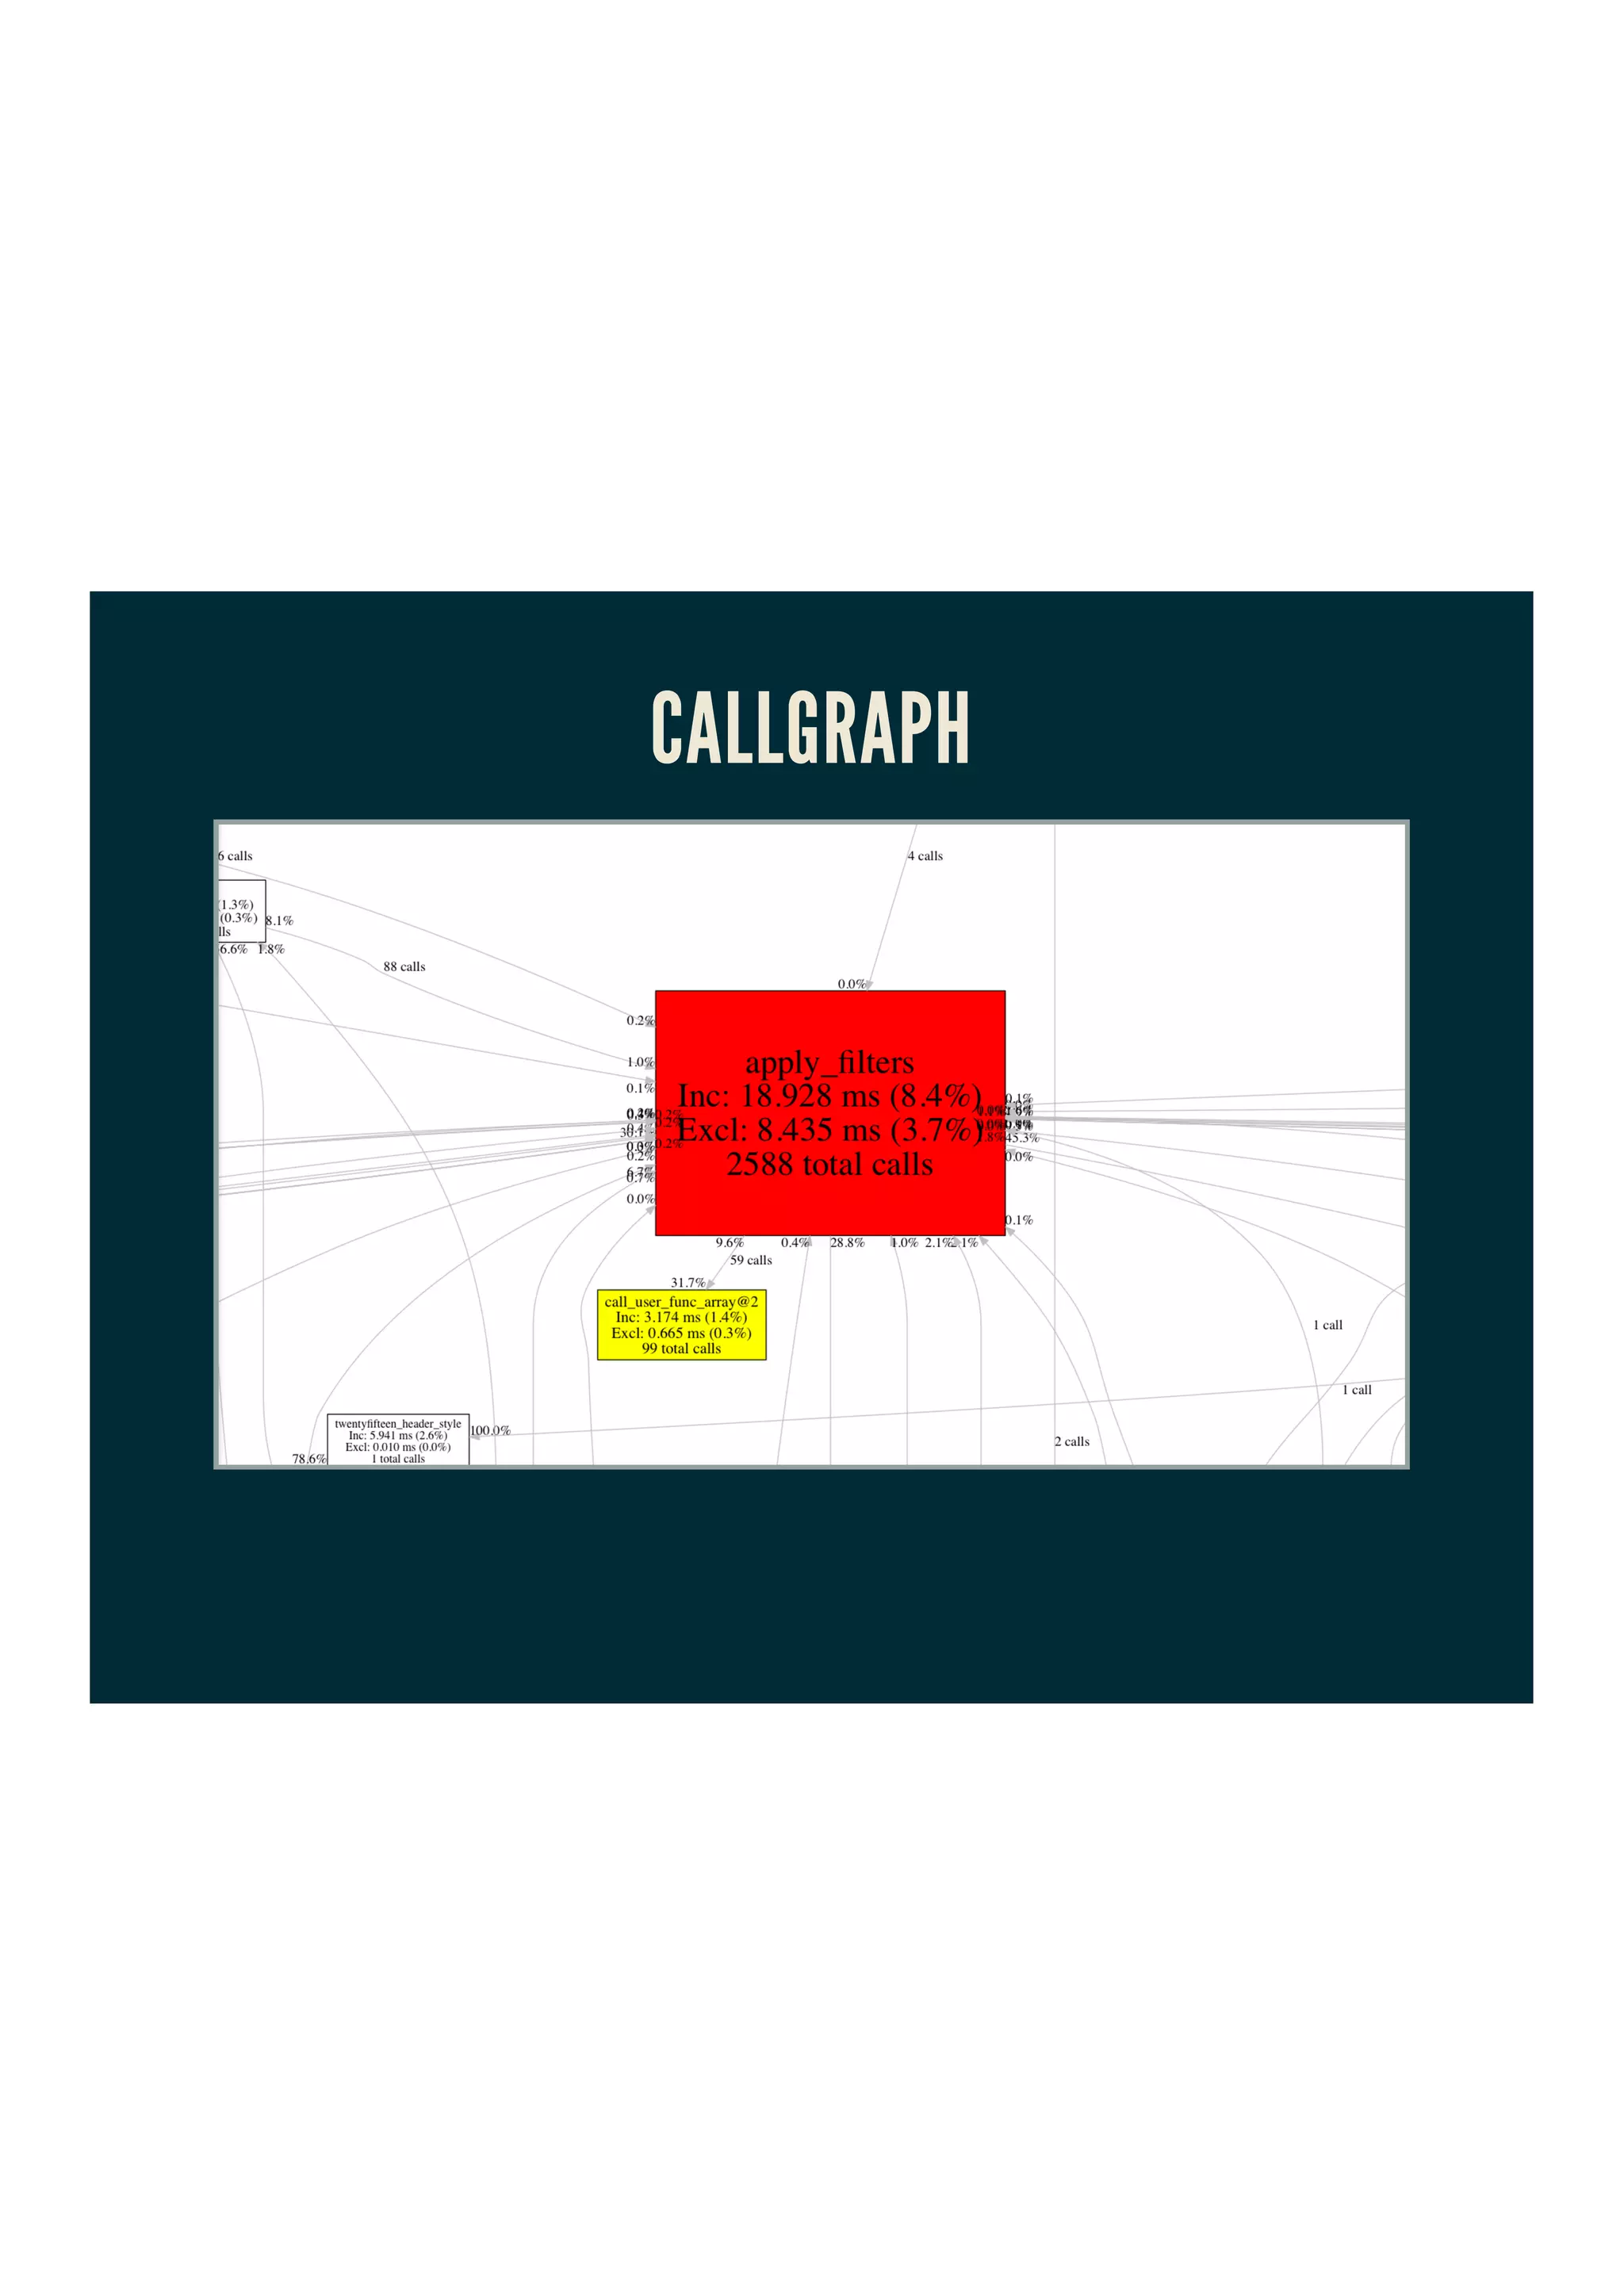
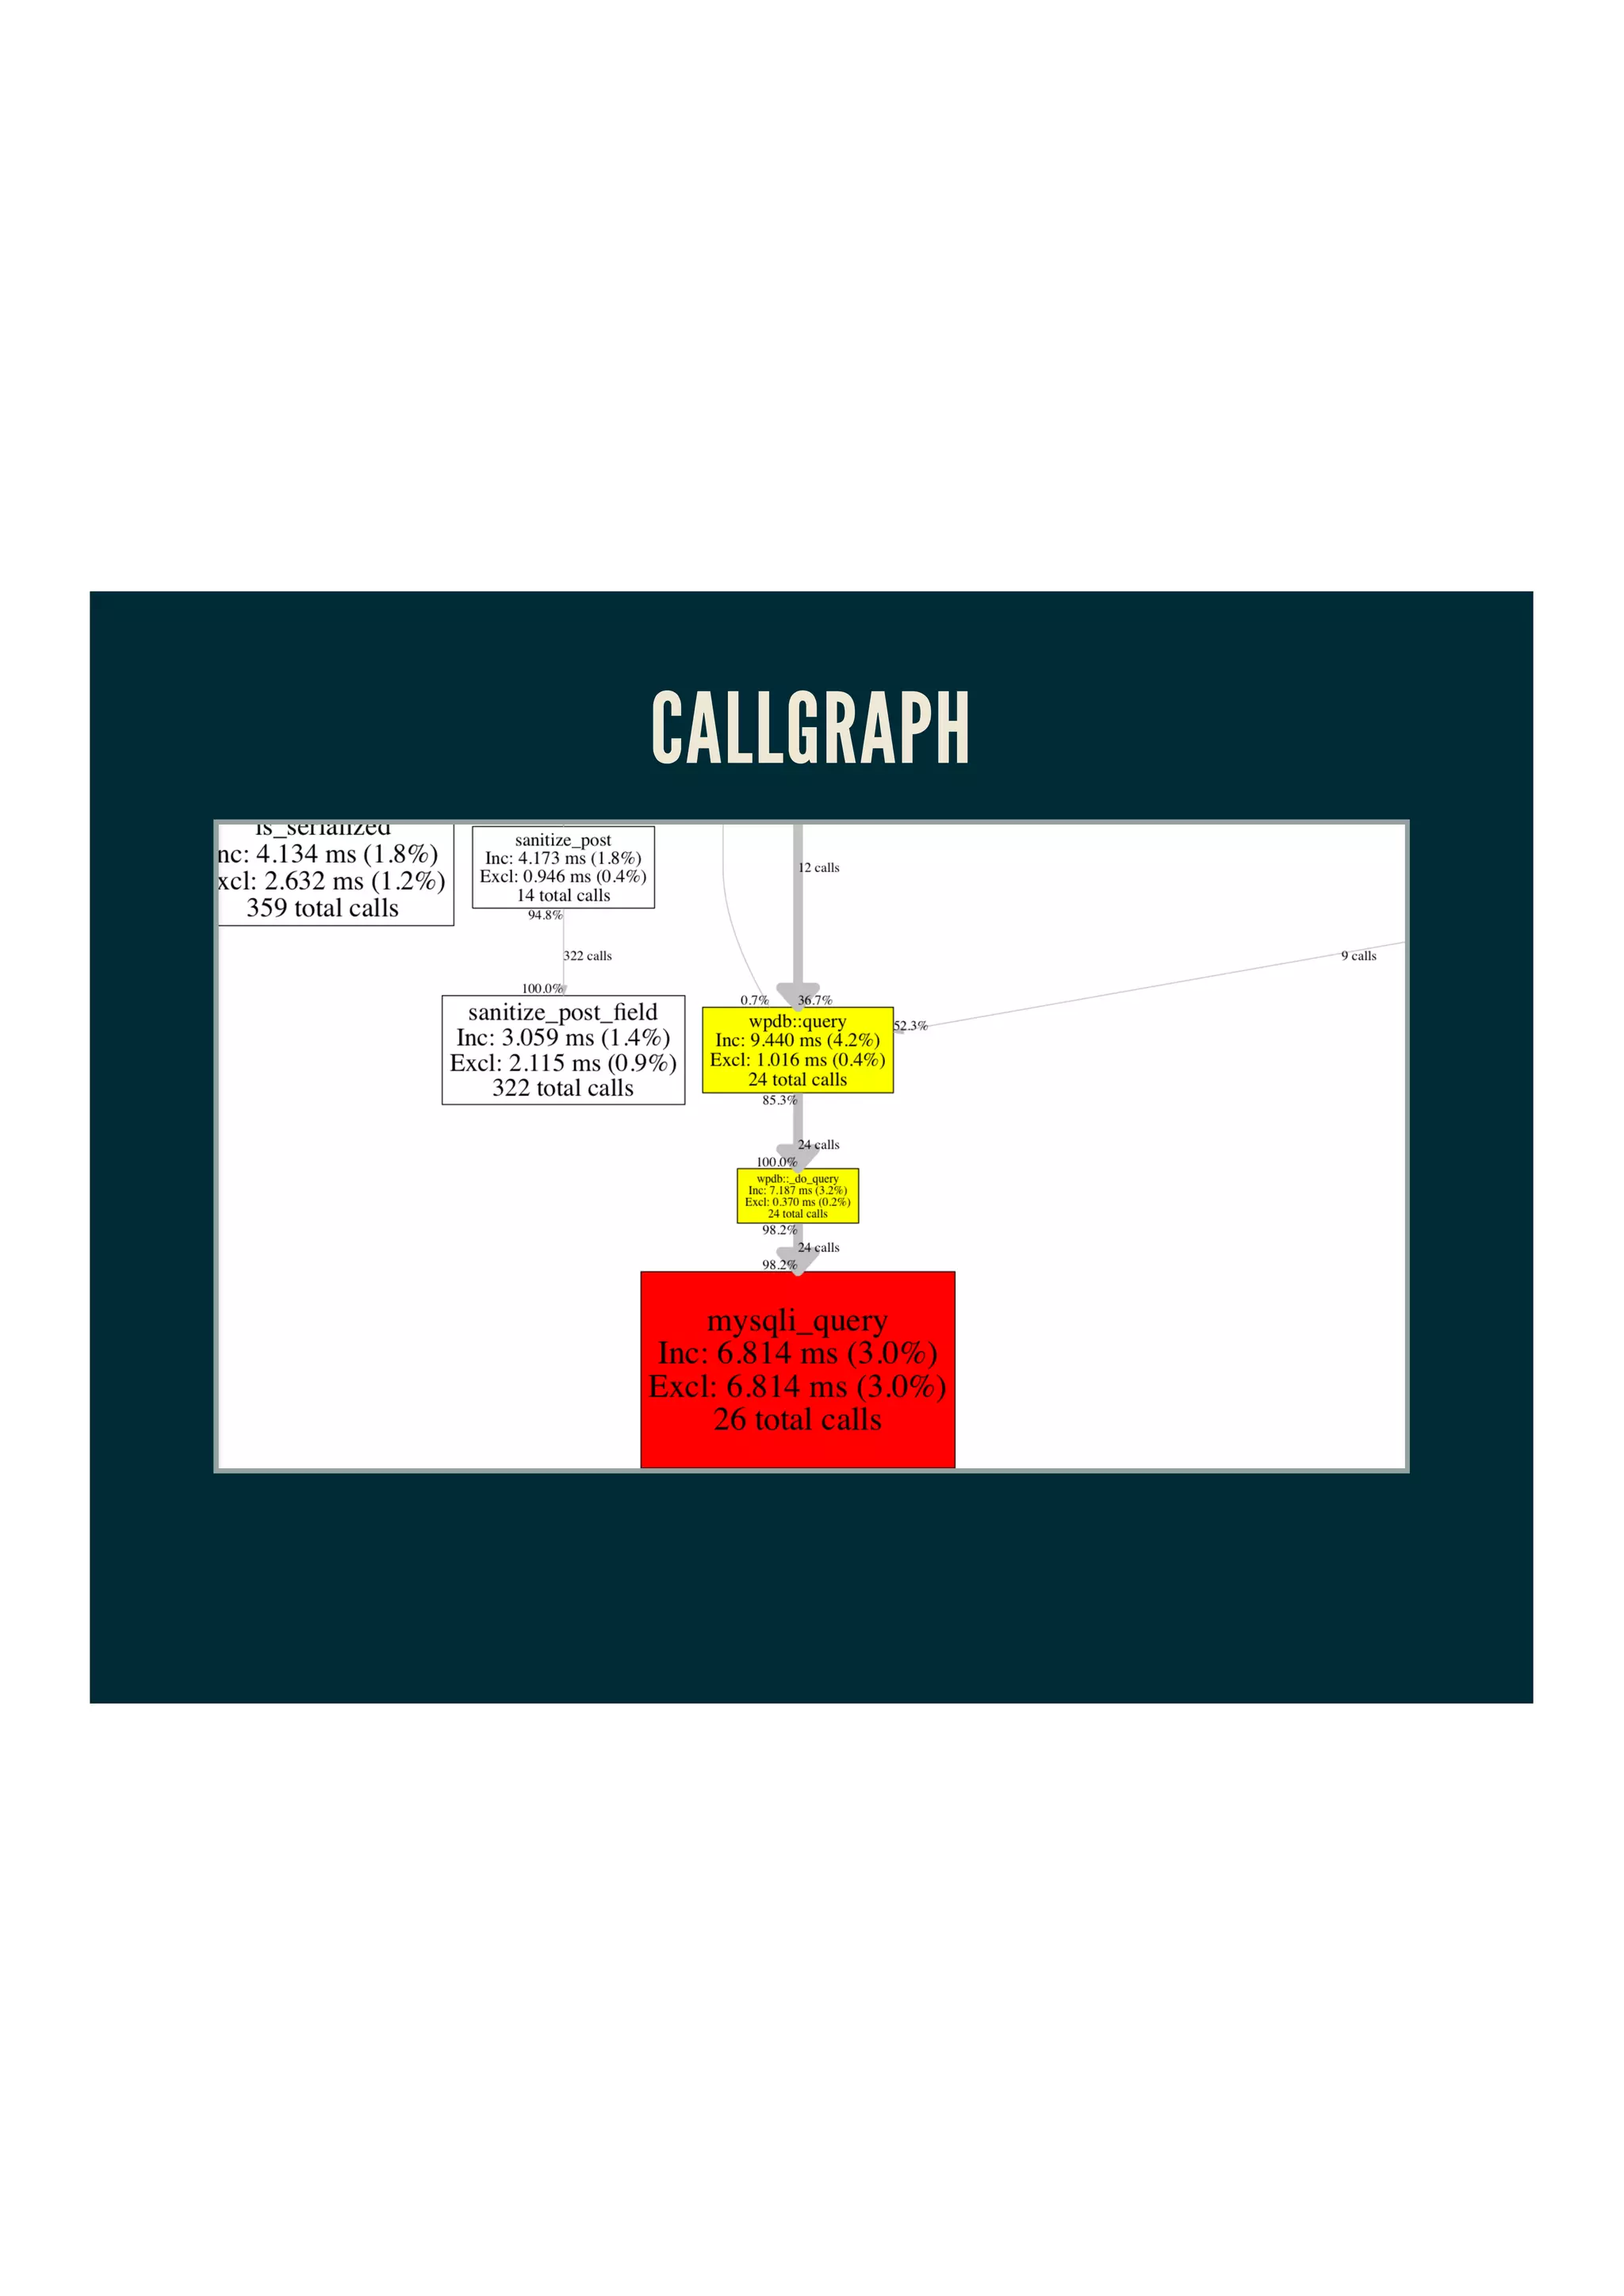
This document discusses profiling PHP applications. It defines profiling as dynamic program analysis that measures things like memory or time complexity during program execution. Both static and dynamic analysis are covered, with dynamic analysis involving actually executing the program to observe its behaviors. Specific tools for PHP profiling are discussed, including Xdebug for active profiling during development and XHProf for passive, production profiling. XHProf data can be viewed through the XHGui interface which shows call stacks and graphs. Other profiling tools mentioned include Link0 Profiler and New Relic. Profiling helps optimize applications by identifying slow functions, classes or code sections.