1. Market Skyline of India
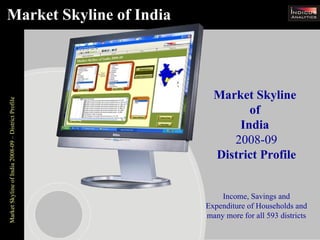
Market Skyline
Market Skyline of India 2008-09 – District Profile
of
India
2008-09
District Profile
Income, Savings and
Expenditure of Households and
many more for all 593 districts
2. Who will Benefit?
Market Strategist: I need to
Zonal Manager: I need Knowledge Seeker:
prioritize locations for
to identify right understand the vast
greater marketing emphasis
districts to appoint Indian market and
dealerships, prioritize how its emerging
efforts and motivate
sales teams
Sales Team: We
Market Skyline of India 2008-09 – District Profile
want to identify Entrepreneur: I want
locations where more in-depth focus into
new efforts need different local markets
to be started and than is currently
old channels available. - details on
need to be rural and urban areas to
strengthened further identify where I
need to expand our
marketing and sales
3. Why?
Understand largest markets in the sector both at the state and district
level
Identify:
The established markets (repeat buyers)
The emerging markets (new buyers)
Market Skyline of India 2008-09 – District Profile
“On-the-verge” markets (be the first mover)
Appropriate analysis after accounting for the inter-district variation
Suitable markets to launch or expand products
Kind of products that can be launched
Variants of the products and its suitability to the market
4. Identify Markets
A. Market Size (Demand)
Product Market B. Consumer Characteristics
Market Skyline of India 2008-09 – District Profile
C. Other Market Insights
Choice of New Locations – Comparative analysis using one or all above mentioned
parameters across locations to ensure distribution effectiveness
Wider Coverage within an existing market – Cross comparable analysis from these
parameters for building intermediate strategies and ensure marketing efficiency
Market Skyline – Provides this for all 593 districts of India
5. Identification Parameters
Geography (state/district)
Sectors (state/district)
Market Skyline of India 2008-09 – District Profile
Economic Groups
Identify Markets
based on …
Product Segments
Financial Indicators
Other Behaviour/ Patterns
6. What does it contain?
For each of the 593 district markets-
Indicators available across income groups separately for rural and
urban areas
Households
Market Skyline of India 2008-09 – District Profile
Individuals
Personal Disposable Incomes
Potential Consumption Expenditures
Potential Household Savings
Other indicators covered
Item wise market sizes
Short term growth rate- Income, Potential Expenditure
SEC Profile etc.
………and much more
7. Insights
The largest markets by volume
Delhi, Mumbai (Suburban), Thane, Bangalore,
Pune, Mumbai
Total Market Size
Market Skyline of India 2008-09 – District Profile
Mumbai (Suburban), Mumbai, Chandigarh,
Chennai, Kolkata
Maximum propensity to spend
Per capita Market Size
SEC profiling of consumers
8. Insights
Which are the most concentrated markets?
Districts States Market Density
FMCG Sector (Rs Total Market Size,
Cr per Sq Km) Geographical Area
Mumbai Maharashtra 11.1 of the district
Market Skyline of India 2008-09 – District Profile
Mumbai Maharashtra 9.4
(Suburban)
Kolkata West Bengal 7.0
In the largest markets, what share of total personal disposable
income is being saved by households?
Rank Districts States Total Market Savings Rate
Size (in Rs. Cr.) (%)
1 Delhi Delhi 102,453 23
2 Mumbai Maharashtra 100,652 13
(Suburban)
3 Thane Maharashtra 49,834 23
9. … more Insights
Ever-expanding Districts - an
aggregate Market Size of almost Rs 26 49% of India’s market lies in
trillion UP, Maharashtra, West
Bengal, AP and Gujarat
alone
Urban Millionaire Districts in
Market Skyline of India 2008-09 – District Profile
Northern Zone:
Faridabad (3rd largest)
Ludhiana (4th largest)
Largest Rural BOP Markets –
Medinipur, South 24 Pgns,
Murshidabad, East Godavari
Belgaum is the second largest Surat ranks top in terms of
market in Karnataka rural millionaire households
in Western Zone
10. … and still more Insights
21% of total households in Chandigarh
(richest market in India) earn more than Top 2 Urban districts based
10 lakh a year on Income Growth rate-D &
N Haveli (23%),
Gandhinagar(22%)
Rural districts with max no.
Market Skyline of India 2008-09 – District Profile
of millionaires-Gurgaon,
Ludhiana, Surat, Waynad
Ganjam : Largest market in
Orissa
Upcoming districts based
on absolute increase in
income- Thiruvallur,
Potential Rural Markets: Vadodara, Barddhaman,
Alappuzha, Thrissur, Ernakulam, Rangareddi, Faridabad,
Pathanamthitta, Kottayam - high Medinipur
per capita income but low per
capita expenditure.
11. List Of Indicators
Annual Market Size for food,
FMCG, durables, clothing and
footwear, and miscellaneous goods
Annualized sector wise growth rate:
and services
income, potential expenditure, potential
Market Skyline of India 2008-09 – District Profile
Socio-economic classification from saving
A – E (A – highest propensity to
Household income categories namely –
consume)
<75k, 75k-150k, 150k-300k, 300k-500k,
Information on district area, 500k-1,000k, >1,000k
population, urban population Information across household income
categories on - Percentage of households,
population, child population, total household
income, potential savings, potential
expenditure & per capita income, potential
savings, potential expenditure across
household income categories
12. Market Skyline of India 2008-09 – District Profile
Our Patrons
…..growing by the day
13. Call Us
Market Skyline of India 2008-09 – District Profile
For query or placing orders please contact
Indicus Analytics Pvt. Ltd.
2nd Floor, Nehru House,
4 Bahadur Shah Zafar Marg
New Delhi- 110002.
Phone: 91-11-42512400/01
E-mail: products@indicus.net
www.indicus.net